Winning with kids apps can be super-tough. There are a lot of rules and regulations to follow. But knowing them unlocks a world of opportunity, making this space lucrative and enticing for app developers. Singular is uniquely positioned to help app publishers market and measure success for kids apps among MMPs, with privacy and protection features no one else has.
We sat down for a chat about the challenges and opportunities in kids apps with one of the biggest developers in the space, TutoTOONS.
Click play on the video above, subscribe to the podcast, and keep reading!
Note: if you’re looking for privacy and regulation compliant mobile attribution for kids apps, learn more about Singular’s solution here.
TutoTOONS: a leader in kids apps
TutoTOONS is a Singular customer with over a billion app downloads and a very interesting subscription model: buy it once, and get full access to all of its 50+ apps on the App Store and Google Play. The value prop is simple
- Full access to all the games
- No ads
- 100% kid-safe
- Entertainment, sure, but also learning
- Regular updates and new content
- Cancel anytime
The interesting part of this model is that there are literally 50 front doors to the TutoTOONS subscription universe. While the company can concentrate paid acquisition on the most performant entrance paths, all are organically collecting customers and funneling them to the one subscription that opens a universe of app fun and learning.
We also added an expert from privacy consultancy and technology provider PRIVO, plus a Singular expert for an in-depth focus on kids apps. Our full panel:
- Celeste Rollason: Senior Child Privacy Expert at PRIVO
- Stefano Accossato: Head of UA and Ad Monetization at TutoTOONS
- Mike Gadd: Customer Success Director for EMEA at Singular
Here are 10 things I learned about building and marketing kids apps
- Start with kids
The parent is the purchaser, so the parent is important. But the kids have to like the apps. If they don’t get interested, engaged, and hooked, there’s little chance that you’ll be getting a subscription from a parent. - You must earn parents’ trust
Kids need fun. Parents demand trustworthiness. You absolutely need parents to trust that they can give their kids your app experiences and nothing bad will happen. Fail this test, and you won’t win. - Compliance is marketing
Visible compliance with all child safety regulations and platform standards is key to winning the trust of parents. For a subscription app, that might mean that their kids won’t see any ads. For all apps, it means that privacy and a curated, safe environment are critical. - SKAdNetwork was great for kids apps
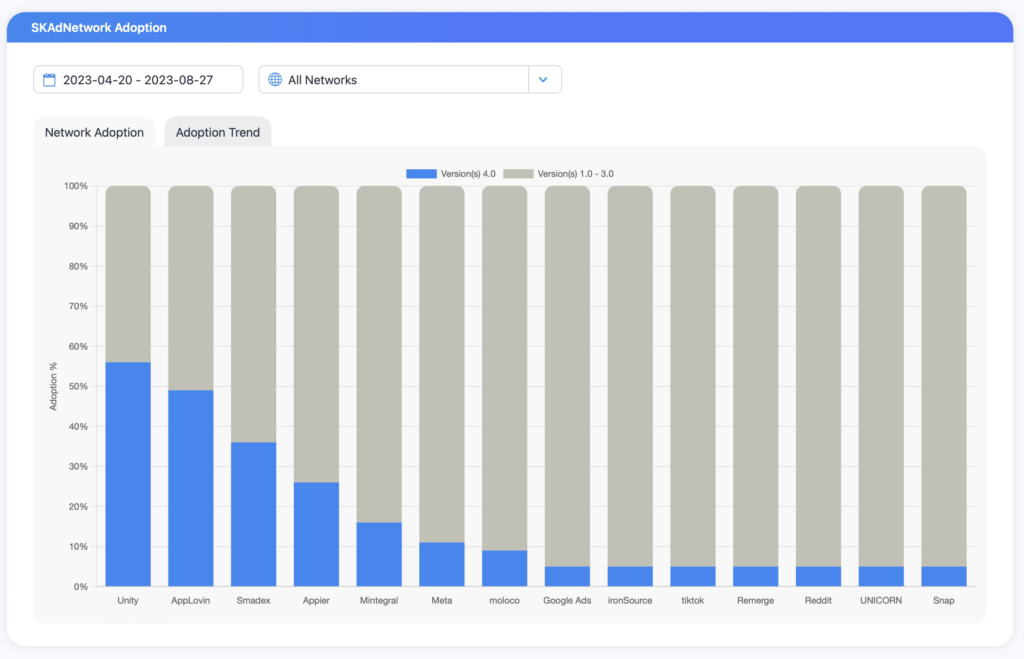
SKAN was a great thing for kids apps. Before SKAN, kids apps on iOS could not advertise on self-attributing networks like Meta. Now, however, with SKAN3 and SKAN 4, you can run privacy-safe user acquisition campaigns pretty much anywhere. And on the ad monetization side for kids apps that how ads, ad revenue is up since SKAdNetwork. - Kids apps are ahead of the privacy game
Because kids apps have to comply with COPPA and GDPR and any other local or regional regulations, kids apps are already compliant with pretty much any privacy regulations or platform changes. They’re built for a world with SKAN and Privacy Sandbox. - Anything is possible, almost
You can’t do behavioral targeting advertising, of course, in kids apps. But pretty much anything else is possible: video, games, accounts, email addresses. The keys are consent and transparency: what are you doing, why, and how will any data collected be used? Parents need to be in the loop, and parents need to provide consent. - Change your data collection practices
Most apps collect data on everything that goes on in their apps, 99% of which goes to die a long lonely death in the cloud. Kids apps need to be intentional about what data they collect and transparent about it. Only collect data that you need, and privacy legislation compliance gets a lot easier. - Three tiers of monetization for kids apps
You can monetize kids apps in almost exactly the same ways you monetize regular apps: ad monetization, in-app purchases, and subscriptions. Subscriptions and ad monetization tend to work better for parents, but all the options are open. - How to pick your ad networks
If you’re running ads for monetization, you need to pick ad networks that are certified COPPA compliant. Adding a network that is not COPPA compliant will mean inventory that won’t monetize. You need ad networks that provide ads that are certified kid-safe. - Get tech partners that are compliant from day 1
All of this is possible with the right tech partners to navigate compliance and ensure data collection is complete kosher and above-board. PRIVO is a good partner for what to do, among other things, and Singular is the only MMP with all the technology you need out of the box to ensure complete kids safety compliance.
Subscribe to Growth Masterminds and never miss an episode
If you haven’t already, subscribe to Growth Masterminds and Singular’s YouTube channel. You’ll always be up to date on not just what Singular is doing, but also what the world’s top mobile marketing experts are learning and sharing.
Now check out our full conversation:
Full transcript: conversation with TutoTOONS, PRIVO, and Singular
Note: this is largely AI-generated. It has been lightly edited for clarity
John Koetsier: Hello everybody and thank you for joining us today on Growth Masterminds. My name is John Koetsier. We’re doing something a little different today. We did a LinkedIn Live just recently with four global experts, and it was about kids apps. And maybe that’s not the space you’re in. Maybe you are thinking about that space. Maybe you’ve never thought about that space. It’s actually a fascinating space where, yeah, there’s a lot of barriers on the one hand. But there’s also a ton of opportunity and super interesting, and some things that actually Singular does really, really well.
So this is a recording of our LinkedIn Live on kids apps. We had some amazing people. We had Celeste Rollason from PRIVO. We had Stefano Accossato, who’s the head of UA & AdMon at TutoTOONS. We also had Mike Gadd who’s from Singular. He’s the customer success director in EMEA.
So, we had a lot of interesting conversations about what works, what doesn’t work, what you have to know, what you have to think about in kids apps. Enjoy the conversation.
John Koetsier: Hello everybody. Hello and welcome. How can app publishers win in the most managed and restricted areas of Google Play and the Apple App Store? Welcome, this is a special Growth Masterminds. We’re live on LinkedIn. It’s awesome. We’re happy to have you with us. Hope you’re joining and sharing and liking and all that stuff… commenting, questioning.
We’re talking about marketing kids apps—how to be effective and compliant. And when we’re talking about kids apps, we’re including both kinds, right? There’s official kids apps and official App Store sections for kids. There’s also apps that are just built and released in the regular App Store, Google Play that are just targeted for younger users.
We’re going to get into a lot of stuff. What are they? How do Apple and Google manage them? Is this an attractive space to do business in? How much competition is there? What rules do you have to abide by? What are some massive mistakes that companies make? And how do you win in kids apps publishing? To chat about it, we have an all-star group of people, which I am super pumped to introduce you to.
First off, we’ve got Celeste Rollason. She’s a Senior Child Privacy Expert at PRIVO. PRIVO is a global expert in minors, privacy, identity, and consent management. Thank you so much, Celeste. We also have Stefano Accossato. He is the head of UA and Ad Monetization at TutoTOONS. They’re an app publisher that focuses on kids aged 3 to 12, they have over a billion app downloads. And we have Mike Gadd. He’s the Customer Success Director for EMEA at Singular. Singular is a next-generation privacy-focused MMP.
Welcome, all. If you have questions, by the way, we’re going to take some time at the end, so please add them. If they’re super relevant, we might even bring them in right away. We’ll see how it goes. And guess what? We’ve got one. Welcome everyone online, absolutely. Welcome everybody.
We’re going to start by setting the stage. Start with the big picture. What is a kids app? Is it different on Android and iOS? Stefano, please lead us off.
Stefano Accossato: Right. Thanks for the intro, John, in the first place. Well, what is a kid app? Everybody thinks straight away about kids games, like something more cute, something, in our case, very pink—definitely that’s the color that is mostly present in our apps. But the question here is about how do you distinguish a kid app from another kid app, a kid-oriented app or an actual kid app?
So, what we call as official kids apps is what you may find in the stores under the kids section, right? But there are also plenty of apps which are not part of that category in the store, but they’re still oriented to kids, right?
So Google Play, App Store have different understanding of what a kid app means, and it’s really down to the publisher to understand where better to fit their app. But all those categories come with restrictions. So you need to be aware of those. You need to really read down the guidelines to understand where your app basically should be placed.
John Koetsier: Cool. Celeste, any thoughts on that as well? What are some of the differences here? How do we define a kids app?
Celeste Rollason: Right. So, speaking from the regulatory side of things, and there’s definitions of what’s a website directed to children? What’s an online service directed to children? Are there characters? Is there language that speaks to the child, etc.? And the regulations have those definitions to help you understand if your service is directed at a child. On top of that, whether your service is likely to attract a child, that’s a whole other conversation.
There’s clearly child-directed, and then there’s the idea that kids are playing these… are accessing these games, accessing these services, and using it. You know, everybody’s online now, there’s no limits to who might touch what you’re creating. And when considering compliance, on top of all of that, it shouldn’t be a barrier.
Entering the kids market shouldn’t be a barrier. You hear legal, you hear regulations, you hear these strict, Oh, this is for kids, or this is not for kids, etc. But it should be enabling you to think, really, what you can do for them and how you can use regulations, how you can use these definitions to achieve what you want to achieve, rather than stifle your creativity.
John Koetsier: That is a great point and we’re going to get deeper into that later on as well. We’re going to talk about that. When I hear compliance, I hear something and you hear something different. And there are opportunities in that as well.
Before we get there, Celeste, we’re going to stick with you. There’s a ton of legislation around kids’ privacy protection. What are the key pieces of regulation? I mean, we all know GDPR, COPPA. What are the differences between geos? Lead us into that conversation, please.
Celeste Rollason: Absolutely. Yes. So, COPPA, the big one in the U.S., and then the GDPR is the big one that covers the EU, U.K. We’re also seeing a lot of state legislation, a lot of state regulations coming out, and movement in the Asian market, and movement in South America, Brazil, different regulations coming forward.
So what’s most important to consider is, again, going back to what is a child-directed app? What is your audience? COPPA defines users as… children as 12 and under. The GDPR and a lot of the global regulations speak to users 18 and older, and these regulations are going to have a global impact.
You might consider that, Oh, I’m in the U.S. I’m a U.S. company. I have to stick to one regulation or another. But we all know that the internet is ever-reaching. You’re not limited to a group of kids. You’re not limited to a single space. You’re not even limited to, you know, your employees. We all know, we’re all coming from all different places in the world today, in this call.
So, touching the regulations thinking you might need to stick to one, but you’re going to need to consider an audience. And a lot of the state regulations are going to meet that high standard of the GDPR: speaking to kids 18 and under, considering 13 to 17, the impact of teens, and how that’s going to affect your service.
And then, fundamentally, that leads into your notice, your transparency, how you’re speaking to users. COPPA speaks to having… speaking to the parent, having a lot for the parent engagement. Whereas the GDPR brings in ideas of having a privacy notice, having a privacy policy that lets children know, What is privacy? What are we doing here today? And why do you need to worry about your identity online?
John Koetsier: Stefano, come on in and talk about this. You’ve got over a billion apps downloaded. You’re based in Europe. You’ve got customers, users all across the globe. How have you managed to deal with this web of legislation?
Stefano Accossato: Yeah, when I joined TutoTOONS, I think it was one of the first things I noticed to be aware of all those policies and regulations and so on, like, almost had to become a lawyer overnight. But when it comes to the practice of it, you want to know as a publisher, as a developer, you want to know how those regulations really affect your game from a development perspective, monetization perspective, and publishing perspective, right?
So, if you were going to try to keep track of all of them separately, it might just add a lot of extra work to it. You need to start from the basics. What are the common aspects in different regulations? What are they actually talking about? Are they talking about content? Are they talking about ads? Are we talking about monetization basically, or they are talking a lot about data, like data sharing, data collection? So, often as I’m more into ad monetization and UA, of course, I focus more on: Okay, what does it mean in terms of ad monetization? What can I do? What can’t I do? UA, we will talk more later, I guess, but what does it mean tracking UA activity in a compliant way for kids apps? In our case, we are a hundred percent compliant, like we don’t use an age gate in order to divide our user base in adult players and kids players. So we consider all of them as kids.
This is also a very important aspect, like, is it compliant to use an age gate? How should it look like? What does a certain regulation say about it versus another one? And what can you do about it? Because when it comes to publishing on Google Play you can have different app versions for different geos. So, if you are 100% sure that you want to go this way, you could even have a different user experience for different geos, right?
But you really need to mind your resources in this case and then not mess up too much the situation. But when it comes to iOS—because I guess you want to be on iOS as well—it’s not really working that way. So we can have completely different versions on different geos. So it’s going to be a unique, a unified experience, basically.
So, basically if you look into what PRIVO is doing when it comes to GDPR and COPPA compliance, they also can talk about other regulations that are in other countries like the U.K., like Brazil, or even statewide in the U.S. when it comes to California, for example, and now more states since these years are joining this, right.
So, but if you are really having a good base when it comes to COPPA and GDPR, you probably find yourself in a good place already. And then it’s about very small changes or small attention to details when it comes to other regulations, because COPPA and GDPR are really broad. They cover almost everything.
You’ve got to for sure remember, as Celeste said, the difference in age. So if a user is in the U.S., you might want to have a custom age gate when it’s about 12 to 13 years old, right? That’s when the switch happens. But if you are in Europe, originally at least under the GDPR-K, there were different ages for different countries. So one country would say that, oh, a kid is under 18. Another would say that the kid is under 16, and another would say, no, we like the way that COPPA does it—it’s under 13.
So what your age gate should do, basically, when it should switch into a different audience, right? So, this is usually solved if you play games and they are having an age gate. You will often see that if you’re in Europe, you get the European age gate, which is usually unified across Europe. It’s not by country, usually, and it’s about, let’s say, 16 years old, because that’s where, I guess 90% of the country agrees on, right?
But if you go to the U.S., you don’t really have a choice, or North America, you don’t have a choice. Your age is 12 to 13. So these are some of the main differences. But if you go deeper, of course, the way the data is treated, what does it say about what data you can collect, manipulate, and then share. That’s where it gets more tricky, and that’s where you really need the help of a partner that helps understand what happens there. Unless you want to do everything by yourself, but, you know… plan some time for it.
John Koetsier: Doing everything by yourself is pretty challenging, but I can understand why you’re treating everybody as a kid. It kind of simplifies your world in that sense. That makes a ton of sense.
Okay. We’re going to get into compliance. We’re going to get into tips of what works and what doesn’t work and a lot of other stuff. Before we get there, as we’re still kind of unpacking here, Stefano, we’re going to keep you on stage here. Who are you really marketing to? Do you have one audience? Is it kids? Is it one audience … that’s parents? Is it both? What are you doing?
Stefano Accossato: Yeah. Yeah. That’s something that is always on our mind and top of mind is like, how can we give a good experience to the kid in the first place, but how can we translate that into value for the parents? Because yeah, needless to say, the parent is the purchaser, right, when it comes to doing a purchase and buying power. So they really need to be able to see the value there. So we can’t… I don’t know, do something which is just looking into what the parents need and then forget about the kids, and vice versa. That’s really not possible.
So when it comes to the kids, you really want the quality to be really high. You want the creatives to be the best possible creatives that really inspire kind of happiness for the kid when it gets into the game, right? You really want to use the right mechanics so that the kid is able to understand that it’s not too complex, but should be also, of course, challenging, otherwise it gets boring too fast. And I guess who has kids or not, but we can imagine that the kid gets bored pretty quickly if something is not catchy enough or challenging enough, but it also gets pretty frustrated if it’s too challenging. And the line there, it’s pretty, pretty narrow. It’s pretty hard to define. So it requires some game testing done, collaboration with, for example, something we do—we do go to schools, and we do have like kids playing our games during, for example, development phase, or if we want to have a content update, we have our kids playing with that and see how they react to it. Everything is done in a compliant way, and these really help answer those questions. In a way, it’s harder to get the parents’ perspective because, well, you’re not gonna go to school and get the parents to play with the kids.
So, first of all, you need to have the kids really engaged in the game. Then the parent notices that the kid is actually engaged in this game. So it starts to pay attention to what it is, and that’s when you need to start giving a solution for the parent. So what that may be, right, iIn the first place, you want the parent to feel safe that your kid is in a safe environment.
There is no, I don’t know, tricky behavior in like… I don’t know, prompting you to make an in-app purchase in the middle of the screen and by mistake it gets clicked and so on. So all these things need to be addressed for a parent to feel safe.
The ad experience is extremely important of course here, and I guess we’ll talk more about it later in detail. But then at the end, also, what problems are you trying to solve?
And one simple aspect to it is like, well, you want the parent to trust the kid while playing the game and not being there all the time looking at what the kid is doing in the game. So, one example, it’s our subscription service that gives to the user the possibility to unlock all the content to make sure that there is no ads involved of any kind, at any point, so that the parents feel like the kid is spending time in an entertaining and sort of informal education way as well, because some of our mini games have something that does with mathematics stuff, but in a very informal way, there is not like actual division and multipliers involved.
But the subscription, it’s really important in order to make sure that there are a bunch of apps that the kid can use. They’re all under the same account. They’re all under the same payment. There is no need to pay more for it and, I mean, more for each single app. It’s just one. And then the kid can actually enjoy a big variety of games, mini games, characters, and so forth.
John Koetsier: I want to go to Celeste on the same question, but just before we do, Stefano, do you have multiple apps that you get with the same subscription, or are they mini games within one app?
Stefano Accossato: No, it’s about multiple apps. So, as we have like around 50 apps live in each store, so once a user decides to subscribe for one game, they get also the suggestion of all the other games that are included in our TutoClub subscription, and they can directly get to the store from the panel inside the app, or find this information as well shared on the store when you read the description of the game.
At the moment, we have this on per store, right, and we’re working on delivering a solution that will actually be a one unified experience, so one account covers all stores.
John Koetsier: Super interesting. I’d love to dig more into that, but we can’t right now.
Celeste, same question. You’re marketing to different audiences. What are some of the implications of that?
Celeste Rollason: Right, yeah. So, I’m going to touch on a lot of the similar points to what Stefano was going through. The idea that COPPA, these regulations are designed to put parents in control.
But what’s key—and this is one of those misconceptions about the barriers of compliance is consent, you know, a parent has to say ‘yes’ and get permission—but it’s very important to get the kids engaged from the start and to create an experience that is compliant that they can just come in, open up in your app, and just start playing it. And then, when they’re invested and engaged and interested, they bring their parents into that conversation. And then when those parents come in, the marketing, the compliance is a marketing tool on its own. Parents are looking for trust marks. Parents are looking for Parents’ Choice Awards, etc.—those big badges on the website that say, This is a safe place for your child to be.
So you want to bring kids in, but you also have to have something that the parent is going to see and go, Oh, this is a good place for my child to be. I might want to put my money here. I’m going to put my money where I know my kid’s going to be safe. I’m going to take an extra step and provide consent. I’m going to get my kid more engaged in your service. And then when you’re coming out with a new product, a new service, it just carries on. And building that legacy brand and compliance are really tied hand in hand.
John Koetsier: Very cool. Mike, let’s bring you in here. Thanks for joining, by the way.
I want to talk about the level of competition in the kids space and maybe some of the unique challenges associated with that, because there are some additional barriers here.
We’re going to talk… Celeste has some different opinions about that, we’re going to get to her in just a moment because those barriers are actually opportunities, in her thinking, but what’s the level of competition we’re dealing with here? Is it as bad as everywhere else in the App Store? Is it better? What’s your thoughts?
Mike Gadd: So, I mean, from what we’ve seen with our customers, it’s not so much like you’re trying to beat other people. It’s sort of like improving your personal best all the time.
There are a lot of barriers, I think, that need to be… that are rightly in place, but you need to be able to work within those limitations to make sure that you’re compliant, but also be able to do that optimization. And what’s really amazing is actually we see quite a lot of our customers who are in the same space actually working with each other.
And Stefano is a good example who has actually helped me with other customers in the past and things like that, where actually we’re quite happy to share ideas and things like that because it is a challenging environment to work in, but actually, there are opportunities within there.
And I think the fact that we’re becoming more privacy-centric as an entire industry anyway, actually really boosts this part of the industry. Because actually things like SKAN, you didn’t have that before, and you couldn’t actually use self-attributed networks. So if you were on iOS, you couldn’t use something like Facebook to advertise properly, whereas now you can in a privacy-safe way. That’s pretty cool. So, yeah, that’s what we’re seeing with our customers.
John Koetsier: We gotta bring in Stefano on that because, I mean, if you’re a kids app and you see all these privacy things happening and you see the bulk of the industry, the ecosystem going, oh no, all these challenges! It’s so hard, it’s difficult, and SKAN is here, and I don’t have my IDFA anymore.
And you’re going like, Welcome to the party guys. This is better than I used to have it.
Stefano Accossato: Right. That’s one way to put it. I would say that, yeah, we kinda were ready before in order to, how say… to have the right mindset, you know, of like looking into the policies. What do they mean? Like, what does it mean to have less visibility on data? What does it mean to be less able to reach the right audience? So, yeah, we’ve been there from the very beginning.
So, let’s say that it’s not that there is no impact, of course, when it comes, for example, to ad monetization. When it comes to the monetization side of things, in a way, there was nothing much to do for us other than updating the list of SKAdNetwork that are available for each network. But that’s a regular kind of development job that we do in the back end.
But the ad revenue didn’t see a drop, for example, when the SKAN came in. We are rather more likely to fill in ads because suddenly there are more contextual ads available. So from that side, things are getting better, let’s say, for a kids developer like we are.
On the other hand, it doesn’t mean that all comes to that because we still enter the new system, in the new SKAN, then there will be the changes on Android as well—which, by the way, from a certain point of view, already hit us.
So, GAID is already something of the past for us, while many developers will need to come into it in the coming years. And from this point of view, you know, kind of looks like we are advantaged because we already went through the lack of GAID, but we already have a solution thanks to Singular here as well.
So we kind of solved this problem, but the same has happened with iOS.
Once it’s going to kick in, the whole new Privacy Sandbox, we are going to be part of it as well. So all that Google will do, and what I guess is already doing, all the system, how things are working, we anyway need to go through it, so it’s still impacting on the UA side in a very similar way as it’s impacting everybody else.
On the other hand, the level of competition might be looked at in a different way compared to what we can call adult apps. Because being in the field of kids games for more than four years, when you look at who are your competitors, who is in the top of the charts, you often see the same names, right? Like you rarely get some new player that suddenly breaks all the charts and it comes through. There is a lot of, let’s say, stability in who are your competitors where, well, you get inspired, you inspire others, and so on.
Of course, I’m talking about fair competition. I’m not talking about stealing game ideas and/or making, hacking down your builds. It happens in this field as anywhere else, by the way, but the level of competition is a little bit different.
But at the same time, the perception of different options is also different. Kids and also parents, at least some, they tend to stick with something that they really feel safe with, right?
So how you’re going to get there and take that user on your side, you need to give a sense of relatability—is that an existing word?—and a sense of safety, the same as is perceived in other games, or actually improve that and do a better job. And then you’re going to get more attention, right?
And the value, you know, whether it is educational value, whether it is entertainment, it should be very clear from the very beginning as well. So that’s how you’re going to succeed as well. And of course, running UA in a proper way, contextualized to your field and not thinking that you’re running UA like a regular puzzle game out there. You’re running UA in kids games, so you really need to pay very much attention to what this means and what does it translate into practical actions that you can take every day.
John Koetsier: One thing I got out of that, which is super interesting, is that your retention can be quite high in kids apps once they feel good, once they feel safe, they’re there. Obviously they’re going to age out at some point, but your retention can be good. That’s awesome.
Celeste, we’re going to go to you again, and we’re going to talk about something that, you know, I’ve hinted at a couple of times like—and we talked about it in our prep as well—I hate the word compliance. I personally hate the word compliance.
Should people in the kids app space learn to love that word? Is compliance an actual enabler of success here?
Celeste Rollason: Well, I want to say yes. And of course, we at PRIVO know we have a very, very steep hill to climb to have that kind of relationship we have with TutoTOONS and Singular.
I mean, the sort of triangle of our three great minds coming together with a lot of the regulations, but even what both Mike and Stefano were speaking to there about these new privacy, like, tech… less regulatory, industry is moving ahead in privacy. Privacy Sandbox, the iOS 14 updates, everything that came out. And you’ll start to see that kids apps, like Stefano touched on, were already there. They’re already ahead of the game. They’re already considering this.
Compliance is… that’s the direction everything is moving in now. The regulations are built in a way to help you build privacy by design. That’s a big key word that’s big in our space. I don’t know how much everyone else has heard that, but I’m sure it’s come up. Starting from zero, thinking about privacy first because that helps build your app around it. More and more people, not just kids, not just parents, want to know, Why have you collected my data online? What are you doing with it? Why are you taking… everybody has an anecdote about, the advertisement knows what you need before you do. And that’s a conversation that many, many people are having, and more and more people are trying to keep their data close to their chest.
So, using the regulations to, like I said, structure from zero should be an enabler. It should not be a barrier. It should start helping companies form what their apps are going to look like. Because kids having fun is one thing, but even from a child development standpoint, kids having fun within a closed environment, within what we call a walled garden, is going to give them a better experience whether you’re coming from education, or entertainment, or however you want to engage kids.
John Koetsier: Okay, cool. Thank you. So let’s dive into how to actually get compliant. We’ll talk about what the actual rules are. We’ll talk about how challenging it is. We’ll talk about the tools and tech.
Let’s start off here, and we’ll start off with Stefano. You’re kicking off a kids app. How do you build safety and compliance in? What do you need to do?
Stefano Accossato: Well, you gotta get knowledge, basically, the first thing you gotta do. You need to start looking at their policies in the stores, really, pay attention to that. Google Play has courses on how to be compliant with their policies. You can actually take tests and learn about it.
Learn about what it says when it comes to the Designed For Family program? What does it mean in terms of monetization? What does it mean in terms of data collected already for the store? We’re not even yet going into COPPA or GDPR here, we’re still sticking to the store policies and guidelines.
That is the first step.
That is the first step to take when you’re thinking about publishing an app, maybe just for kids or also for kids. Because this applies also to those apps that are including the kids in their audience, not the ones that are only made for kids 100%, right? So, that’s really the first step.
Then the second would be, of course, to get certified by a company like PRIVO here, because that gives you much more control over your compliance path and requirements, but also gives you really a sense of safety as a developer, as a business. Because having that seal on your app, it’s really a proof of quality, a proof of commitment for the developer to be safe for kids.
And parents do look at that, as was mentioned before. So that’s really important as well. And you need to start doing that asap. You don’t do that when you have your game two weeks from hard launch. You’re gonna start to do that when you are starting the development of a game, or even, I would say, the idea of a game.
Because if you wanna dedicate resources correctly and effectively, you need to consider that part of the time from the team will go into understanding all of this and collaborating with external partners on this topic specifically, which eventually touches everyone—all the ad networks, all the UA channels that you want to use, you’re going to have to bring this up every single time. So you need to start from it to get to a product later on. Yeah. So, the idea is where I would start.
John Koetsier: Super interesting. I’m gonna come back to Celeste. What are the actual rules? What can you do? What can’t you do?
Celeste Rollason: Well, I don’t have that much time, but… and I think we touched on a lot of this call is, you know, thinking about what you want your service to do is going to help figure out what you can do and what you can’t do.
But basically a lot of the regulations boil down to being mindful of the data that you’re collecting and processing—whether it’s actively, you’re asking a user for an email address, you’re asking user to sign up for an account, or passively, are device data advertising identifiers—and how that data is managed. That’s a building block right there. And that’s going to bring in the rest of your app and is going to be built on top of it. Do you want users to have video on? Do you want them sharing content, etc.? And so building up.
So, and everything is possible under the regulations, except behavioral advertising. But even then, there’s a world for it. But really, there’s a lot… a lot that can be done.
There just has to be maybe an extra step in place first, having consent or having, you know, transparency. Transparency is always going to be key. So once you know, it’s surprising how many companies don’t know what data they are actually collecting about their users.
‘Cause frequently the tradition has been to collect it all and dump what you don’t need and just use what you need to, and it’s all sitting somewhere. But thinking about that and then telling your users. That’s what you need to do. So, as long as you’re transparent, as long as you’re mindful and aware of exactly what you’re doing, there really aren’t any limits to what a kids app can and can’t do.
I hope that answers that question.
John Koetsier: I think so. What is this dump the stuff you don’t need? I don’t even know if companies sometimes go back and look, Oh, we have all this extra stuff, let’s see. I suspect they are now.
Stefano, anything to add to what Celeste said there about what you can or can’t do?
Stefano Accossato: Well, a question I get really often is like, How do you even monetize kids games? That’s something I probably get at least once in every conference I attend. And the simple, fast answer is that you can actually monetize with the same tools that you use on any other game.
Yes, you can do ad monetization. Yes, you can do in-app purchase monetization. Yes, you can do subscription. You gotta just maybe sometimes get a little bit more creative in the way that you do your in-app purchase offering, of course.
And when it comes to ads, the practice is very much the same as any other game. The main difference is what are your possibilities, because you need to stick with the networks that are certified to ensure compliance for COPPA, which usually automatically covers GDPR and other regulations, and it’s often applied pretty much worldwide. Like, if there is a COPPA flag available in a network, it’s going to cover all your countries. You don’t need to go country by country and learn about the law locally and so on. It’s a pretty simple, straightforward process.
But you’ve got to be aware of where those flags are, what they should look like. Is there something on the UI of the network, if there is something that is more into the code when you add this network or the adapter for a mediation inside your app, because it often can be in both places. So, but once you are clear with this, you just go with regular optimizations, regular kind of partnership and so on.
And one important thing as well is that Google and iOS see this thing a bit differently. iOS has a kids space, which is—I don’t even know if it’s an actual category; it’s more like maybe a flag that your game is a kid game. That is for the games that are ready to offer just, for example, in-app purchase bit, or even be like a premium app that you need to pay to download in the first place.
But you can be in the kid system and monetize with ads on iOS as well, categorizing yourself as an educational app, as an entertainment app, and that’s fine as well.
So there is more possibility once you do that. And it seems also that it may look to you, once you get into this, that, oh, I can add any kind of SDK then on iOS. Which technically sounds like, yep, maybe. But if you actually look at what this SDK can do, then once you actually, your app is for kids… well, yeah, you may add that network because iOS is not stopping from doing that, but it’s not going to monetize. It’s not going to monetize because it’s not having those flags, or if it’s having them, it just says to the network that, Hey, it’s a kid. Okay, we’re not going to do anything with it.
So, there is really no point in spending time on things that don’t bring you anywhere. So you need to ask these questions first before jumping into a new partnership.
John Koetsier: That makes sense. Mike, let’s come to you. So there are some challenges here for making kids apps. Is it worth it? You’re on the business side. You see measurement. Is there a pot of gold at the end of this rainbow?
Mike Gadd: Yeah, I think definitely. I mean, we catch up with customers on a regular basis. I’d say, actually with apps that are targeted towards kids, they almost need some sort of even more partnership support because there are so many different things to consider and things.
So we spend a lot of time talking to our customers to make sure we’re supporting them, and it’s great to see—I mean, I’ve known Stefano for over two years, I think, in terms of the time that we’ve been working with him, and it’s great that we’ve seen how they’ve developed and they’ve grown and things like that.
And we see that with a number of our customers. So yeah, it definitely works and there’s definitely success stories there, so it’s definitely worth doing.
John Koetsier: Talk a little bit, Mike, about what it means to be an MMP for kids focused apps. Is it different? Are there things that you have to do that ordinary MMPs can’t do, or don’t do? Do you have to do different things for kids apps in terms of measurement than you do for all other different kinds of apps?
Mike Gadd: Yeah, definitely. So, I mean, first of all, it’s the technology.
So you need to have the right technology in place to be able to collect data in a compliant way, and share data in a compliant way, and understand where you can share, where you can collect, etc. And it needs to be really flexible. I think, as Celeste said, there’s lots of different options you’ve got to be able to still be compliant. And so you need a solution that’s super flexible so that you can set the parameters of what you can and can’t do in the platform and allow it to work that way.
And then the second part is the partnership piece.
So, making sure that you have someone like PRIVO, you’ve got someone like Singular who can work with you. We’re definitely not lawyers and I never give legal advice as part of a customer success function.
But what we can do is we actually do talk with our customers’ lawyers or with advisors, where we can say, If you select this option, this is what data is shared; this is what’s collected. And we can give a really sort of strong walkthrough of exactly what’s happening, and then you can make your own decision in terms of whether that’s compliant.
John Koetsier: Celeste, talk about the technology that you need to manage all this stuff. You offer some of it. Singular offers some of it. How does it all work?
Celeste Rollason: Well, I mean, it’s a building partnership. So, obviously with, you know, the regulations are self-regulatory. There is enforcement action that comes down. It’s very important to keep that in mind as well. So, not to be biased, but engaging with a privacy expert is always a great start to be building that partnership.
You know, as we’ve touched on, PRIVO, Singular, and TutoTOONS all have a long-standing relationship. We’ve been working together for a very long time and I think that sort of helps sort of build those tools. You have experts with different priorities, but also different considerations that all come together. And we’re all invested in, at the end of the day—well, maybe not the MMPs, but giving that child, giving your audience and selling the audience. So, just the tools that are out there looking like, as Stefano touched on, looking for flags, looking for settings, anything extra that you can bring in to help move your app into a compliant direction, moving there.
And your best tool, yeah, is… well, I want to say compliance, that’s your best tool. It’s good for marketing. It’s good for building. It’s good for thinking about as a starting point. I, again, I’m a little bit biased, but I still see that as the starting point.
John Koetsier: I guess we’re all biased to some degree or another. Stefano, as you are going through this whole journey of tools and tech to make sure that you’re doing what’s right, what do you need from the tech? How are you using the tech to make sure that you stay compliant?
Stefano Accossato: I would say to pay attention—to pay attention to our questions and really try to answer them and not trying to avoid them. So this may sound obvious, but you can really meet that often in the industry—not the kids industry—in general, you know, in the industry whenever it comes to tech, making it for the tech providers not to stick with what they know, and to how they think the tech should look like and should work, and should be a one measure fits all.
That’s really the main point when, in my opinion, in my experience, that’s when we started to work with Singular. They really understood the point of like, okay, we may not be ready right now, but we can get ready. So Singular did it. Everybody can do it, basically.
The networks can do that as well. That’s why you can see that over time, more networks try to be compliant, try to develop a system that let them also deliver ads, for example, to kids games in a safe way. It may look like a complex process and so on, but it was also, of course, about being consistent with this work that you’re doing.
So, for us, the fact that we were not just the ones that were the middle guys between Singular and PRIVO in this case, that did all the communication job. It would have been quite challenging if that would have been the case. I don’t know if we wouldn’t get to our results as we got in the end, but the fact that they stepped in—Singular stepped in; PRIVO was open for the conversation—and then they kind of put together a solution that works, compliant through from the beginning. Not building a solution that should be compliant and then you go into a review process and then you get an answer, yes or no, but you actually start from the beginning. You collect first the info on what needs to be done, and then you deliver a result.
After the job was done, basically between Singular and PRIVO, we didn’t have to put extra effort in order to understand what we need to do now to use that tool. Singular provided the guidelines for it. So that’s really where you want to be, because as a developer that works in the kid space, you already have a lot of questions to answer all the time and to raise. You really want the tech to come towards you and kind of meet you halfway, basically. Do part of the job in understanding what does it mean for them to be compliant, and be honest about it, because there is no point in starting a potential partnership or a conversation and then three months later find out that, Oh well, we can’t really do anything about it, so why did we waste three months of our time?
And these things happen, but it all comes to the human approach that in the first place tech puts near the top. So, and also it’s hard probably to find tech that has a lot of experience with kids games, right? So when you ask this question for the first time, you might not get a lot of answers.
But there are some technologies which, yeah, they don’t have a client right now that is COPPA, a hundred percent COPPA, but it took the COPPA seriously from Day 1. So, you just mentioned COPPA, they already understand everything you’re talking about. They already can tell you yes or no.
And I really appreciate when people honestly tell me ‘no’ in the first call or in the first exchange of emails that we have, because that will help me respect them more later on when they are going to get compliant, because I know that they will actually have done it properly by then.
So this is something to really consider when jumping into, well, which tech can I use, which tech I cannot use, or who I can trust and who I cannot.
John Koetsier: Love it. Makes a ton of sense.
Okay, Stefano, we’re going to stick with you for a bit here because we’re going to talk about monetization. We’re going to go into AdMon, how it works. We’re going to talk about in-app purchases, subscriptions, all that stuff, how that works as well. Let’s start with AdMon for kids. Give us the big picture of how that functions.
Stefano Accossato: Yeah, so I mentioned something before, but the main rules are: no targeted ads, no behavioral ads—how you want to call them—so it’s contextual only, right? So that’s the first thing. Yes, it has an impact on your CPMs. It’s fine. But you can still get a very good fill rate by considering that we surpassed a billion downloads. We have quite a lot of impressions we deliver on a daily basis, right? We don’t really struggle with fill rate.
So, there are ads available out there. You need to find the right partners. You need to, of course, find them. Test them.
So how can you find them? The first step, you go to Google policies, you see the list of certified networks for the Designed For Family program. That’s your way to go. That’s where your answers are. And that’s where you’re starting, because if they are there, it means they have all the right flags and you don’t need to start asking a lot of questions.
In this case, private will be the ones that confirm that, yeah, that is fine. We just approve of it that you actually did it during the setup of that network, but that’s it. You know, you’re ready to monetize. It’s pretty simple. But with this comes another challenge that I will try not to go too deep into it, because I tend to get too passionate about it, but it’s ads quality. So, basically, what is ads quality?
Usually it’s intended as UX, user experience. Is the ad easy to close, is the ad easy to navigate and then get back to your game. So this, of course, applies to us as any other game out there for adults as well. But in our case, it’s also a lot about content. It’s about the appropriateness of the ads and this is a huge topic, and you need to take it very seriously.
In our case, we actually haven’t started at-scale monetization. I mean, we were already doing end monetization because there are also networks out there which work just with kids brands, which are delivering safe content all the time. You didn’t need to even check that it’s going to be fine. We do check this anyway, but you can really trust them. They know what they’re doing. They’re certified already and you can trust them a hundred percent. They work only and exclusively with kids brands. So that is already giving you a decent revenue in the first place.
But if you are scaling up your business, usually that’s not enough. You need to start adding SDK networks to your stack as well. So that’s when the ads quality becomes really, really serious. Because, yes, you have the flags. Yes, the flags should say that an ad that is for 12+ or 17+ shouldn’t show in an ad that is marked primarily direct to kids. But technology sometimes fails the developer that is running that campaign. That UA campaign might not have properly categorized their game on the App Store in the first place, or not have given the right content rating to the game on Google Play, for example.
Now, usually these things fix themselves over time because the store realizes that the content rating is wrong, sends you an email telling you that you need to fix it unless your app is gonna get rejected or removed from the store. But in the meantime, days are passing and those campaigns are delivering impressions. And the networks, even though they try their best to avoid these impressions to show up in your games, they might come through. So you really need to have control over the content of your ads and you need to take this extremely seriously.
At TutoTOONS, we started with the manual work on Day 1 once we found a process that works for us. Then we started to use the SDK networks and we had, I remember in the beginning, we called it the big red button, which was a button in our config, in our backend, that once we would see that the network is not respecting our request for blacklisting apps, we would press the big red button and the network is gone.
So, at that moment, basically, because we can’t allow anything dangerous to pass through, we can’t ruin the experience for our users and put us in a very dangerous place as a brand.
John Koetsier: I think I would like a big red button for my life… remove anything I don’t like or don’t want. But I guess that’s not gonna happen. That’s cool.
Now, briefly, because we don’t want to take too long for this whole session. Talk about in-app purchases and subscriptions, actual monetization via taking money. How does that work? Is there an allowance? Is there a wallet? Briefly, what are your thoughts there?
Stefano Accossato: Yeah, that’s often from a game development perspective quite a difficult question to answer. Well, as I said before, it depends on the value you’re giving, but we could say that there are like two kinds of in-app purchases. It’s unofficial, of course, but you could see that there are two of them.
One is for the parents and one is for the kids.
So the one for the kids are usually related to content—to new pets, new characters, new things in the mini games, I don’t know, access to a certain part of the game which wasn’t allowed if not buying a certain purchase. Just making random examples here, but as with our games at least, if you’re going to download them and play them, you will see there are a lot of collectibles, there’s a lot of hatchables, you know, and this is really driving engagement with the kids. They always want more, so you can actually build a strategy around this aspect, for example. And of course, still, even though it’s the kid that is asking for it, the parent has to agree with that.
So, in this case, the new element you’re adding after the in-app purchase needs to add to the game for real. It shouldn’t be just there as… without sounding too judgmental, but, you know, just a skin but then your game stays absolutely the same. That new character is actually bringing a new dynamic into the game. It’s maybe opening up for new possibilities that before weren’t there, so that the kid has actually the possibility to engage with this character rather than just buying it and having it there on the shelf, so to say. So that’s also when you can deliver a message to the parent as well that the money is well spent, because the kid gets the ability to interact with more elements, with more environments.
And we actually see that, for example, the difference between gaming and just watching videos, right? Video by itself is quite passive. We all know about this. But the game, as such, gives the kid the ability to actually try to do something. So, this is actually a very important point because we tend to spend a lot of our time watching videos.
I remember myself, of course, it was a different generation back then. We didn’t really have much of a choice at the point, but this moving from being a passive observer into being an observer but also participant of the experience, this brings more dynamicity into the kid behavior overall.
And so, of course, as part of your brand statement, you want these things to be safe, to make sense in real life. You don’t want to teach a kid to, I don’t know, break stuff at home in a game. But you can teach things that are really related to daily life. And this connected to the in-app purchase can really add value.
And the last piece is, of course, as I mentioned before, the subscription. It’s a very important in-app purchase, we could say, because it gives constant support.
Because if we are doing this, it’s because those games are being supported constantly. New content is being added and the people that have the subscription get this, well, first before everyone else, you know. So this is, for the kid is important, of course, but for the parent to know that this ensured a hundred percent that the content is always top level, it’s always updated with all the new things we add to the game, that the ads are removed from the show, and there is no interruption in the gameplay. So this is definitely more oriented toward the family as a whole, rather than just the kid, right?
John Koetsier: Makes a ton of sense. And thank you for that about monetization via both ads and in-app purchases, subscriptions.
Okay, we’re coming near the end. We’re going to talk about some examples of when it works. What happens when everything goes right? We’re going to bring Celeste on first for that. Then we’re going to talk about when things go bad. What can happen there?
Then we’re going to go to your number one takeaway, from each panelist, for marketers who are entering the kids app space. And if they can only remember one thing from this show, what should it be? And finally, if we have some time for questions, we will ask you to supply your questions if you’re listening, watching, that’d be great. Have some questions ready. That would be wonderful.
Okay, Celeste. We’re going to start with you. Let’s talk about when this all works, when this goes right, give some examples of things done right.
Celeste Rollason: Well, I mean, I think this is probably the third time I’m saying it, but things done right are: having those relationships, excellent communication, collaboration between the compliance side, the regulatory side, the first-party developers, the actual people who touch the users and the processes that they need, the people are going to collect information on their behalf, like Singular, who are going to help support the developers. I think that is when it’s working right.
When you have a company that, like TutoTOONS, has a specific business need and objective. They—PRIVO, we’ve worked with them before—they know what questions we’re going to be coming in and asking. Going to companies like Singular, asking up front, Do you have COPPA solutions? Are you compliant? Do you have kids apps? etc. And then seeing that flow of just from one aspect to another and watching that relationship grow.
John Koetsier: Do you have some examples of some apps that have done that right and had success as a result?
Celeste Rollason: Well, I mean, obviously, sitting right here, like TutoTOONS can speak to their success as an app… and I’d like to say that, and I think we all agree that compliance is a huge part of it. The apps are engaging in themselves. The kids love playing with them. They have such a simplified but challenging element to them that has that level that you were speaking to, Stefano, and then… but with that privacy consideration in mind, and speaking to kids as the primary audience is one way that that can be done right.
So, and then on the same side in the background, Singular.
Up front, we want to do something. We want to be able to meet the needs of developers for kids apps because kids are a huge market, and we’re going to create this solution, and… this is privacy done right. This is something that has gone right—this relationship between us, our three companies, and we have similar relationships with other services in the same way, whether it’s with their legal team, whether it’s with their development team, etc. But it’s all sort of based on that same principle of that relationship, and that’s what builds success.
John Koetsier: Cool. Mike, any examples of things done right?
Mike Gadd: Yeah, I think to build on Celeste’s point, the biggest thing as well with that relationship is mapping out all your processes. So, if you have an age gate, where’s the age gate going? What does that mean? If you haven’t got an age gate, okay, what does that process look like? And what networks are you going on? Which operating systems are you using? All of these different things.
If you’ve mapped it all out, then it’s very easy to work with people from PRIVO and Singular to be able to go through each and every single one, make sure it’s compliant, know exactly what you’re going to see and what you’re not going to see, and then know how you’re going to optimize. So that would be like my biggest sort of plus point in terms of how you make that relationship as effective as possible.
John Koetsier: Wonderful. And let’s turn to… you know, since Celeste talked about TutoTOONS already for things going right, let’s turn to when things go bad, examples of things done wrong. And guess what? Stefano, we’re going to start with you. You know, you don’t have to give huge, huge apologies, but have you ever screwed up?
Stefano Accossato: Of course. I mean, you learn from mistakes, right? At least that’s my way to go. But you still want to test stuff. There is not really anywhere to go. If you are not ready for testing and sometimes taking some risks, you should be able to evaluate how big is the risk you’re going to take, of course, with something. But it does happen, you know, that, oh well, we did our best, but somehow we published the game and that SDK version was not listed in the compliant one, so we got the rejection, Oh, there’s something about it.
Or everything seems fine. We did all we can to control that the ads are safe, the SDK is fine, it’s certified and what’s so on, whatever about it. And then somehow you get a rejection from the store that says your ad was shown in a wrong place, it interrupts the gameplay; is it a config issue, is it somehow an app issue, or there is something wrong with the SDK itself? So you’re gonna go check it for the homework, fix it, and update the app on your store.
So, also one thing I learned is that, I mean, it’s obvious to say you don’t want to get the stores to reject your game, but a rejection is not a removal. A rejection is not a suspension. Those things get there, the situation can get there when you don’t take care of your mistakes. But there is no rule that, oh, you can’t make any mistake, like you can make mistakes. It’s normal to make mistakes and some of them you will not notice that you made them.
That’s why there is the rejection process in place and you can speak with the store. They are going to tell you what is wrong. Yes, sometimes you might have to wait a little bit for the answer and sometimes it might be quite an enigmatic answer overall, so you still need to do the checks on your end, but these things happen.
And also another aspect is, how clear is the experience for the user inside the app? Because it’s very easy to make the mistake of thinking that the user thinks as you do as a developer. So you need to learn from the data you can get from the gameplay—how the user is interacting with, for example, the in-app purchase offering or the ads. See where there are drop-offs, see where there is no follow-up in the user journey that you’re not really able to track precisely because you don’t have identifiers as such, but you can totally see where the user was last time and then suddenly their users are dropping out, right?
So you need to think as the user. You need to try, of course, otherwise you’re not gonna know. And you need to be very clear with your messaging. Like, the same as with ads, or you can be very creative with that. But if the ad is not easily distinguishable from the content of the game, you can get a rejection, you can get complaints, you can get a bad rating.
So these things happen and it’s up to you to step in and do something about it. Don’t ignore it. That’s the thing, like you should never ignore these issues in any game, of course, but in this space, you know, it’s important to keep a good word about your games, about your brand.
John Koetsier: Yeah, I love those messages back that your app is not compliant with section blah, subsection blah, blah. And you’re going like, How? Where? Please, more.
Okay. We’re almost at the end of our time. We probably won’t have time for questions. If there’s one or two, I might show them real briefly, but let’s go to our top takeaway from each panelist for marketers around marketing kids apps.
Mike, I think we’ll start with you. If there’s one thing that somebody should remember from this session on marketing to kids apps and doing so in a compliant way but also an effective way, what would it be?
Mike Gadd: So, I mean, we’ve already talked about the relationships and proper mapping processes, etc. So actually, in terms of a key takeaway, start simple. So, don’t try and go into this being like, We’re going to do absolutely everything and it’s all suddenly going to be very compliant—because that’s incredibly hard to do. Like, we’ve worked with TutoToonS over a number of years and they’ve built up the complexity of their setup, and we’ve done it slowly. We’ve done it together. We’ve been checking it along the way. Whereas, yeah, if you try and do everything at once, you’re going to give yourself a mess.
John Koetsier: Good advice. Celeste, your top takeaway.
Celeste Rollason: Sure. So, outside of compliance as an enabler, I think considering your audience is a key takeaway when it comes to marketing and when it comes to, you know, being effective. Don’t underestimate children.
There’s a misconception that parents are going to be involved in this process. Kids are alone. This is a generation of kids that’s born with a smartphone in their hand, and so doing the bare minimum won’t—in terms of privacy in today’s climate—will not bring you very far. Everybody’s looking for it.
And companies who try to skirt around regulations, who try to skirt around compliance, will ultimately not be successful in the long run. It will catch up with you. It’s better to start from the beginning and build around it. And it’s just as important as the user experience, and it’s just as important as how you’re going to make money. Privacy is that third piece.
John Koetsier: Babies are born with a smartphone in their hand. I’m almost tempted to use that as a prompt in Midjourney or something like that, but I will resist the temptation.
And Stefano, you have the last word. What is your top takeaway for marketers in this space?
Stefano Accossato: Well, in one sentence or so, I would say that—repeating the words I said before—so, compliance is your number one concern when it comes to monetization publishing and UA. So make sure to start looking into it at the beginning of your journey. That’s, I think that’s the most important thing to do when you want to start in this field.
John Koetsier: Wonderful. Thank you so much. I’m going to just, if you have questions, put them in the comments and we’ll answer them there as we get time. I really appreciate that. We’re over an hour right now and I have to release these people. Some of them are in Europe and it’s late for them.
Stefano, thank you so much for taking this time and sharing your knowledge and your hard-won knowledge over years of work in this space. Your mistakes and your challenges as you’ve grown and learned in this are helping others. Really do appreciate that.
Celeste, thank you so much for sharing your expertise as well. Much appreciated. Thank you so much. And Mike, thanks for taking some time out of your evening and sharing what you’ve learned also.
Thank you all.
Stefano Accossato: Thank you.
Celeste Rollason: Thanks very much.