iOS 14.5 by the numbers: adoption, ATT permission, ad spend trends, install volume impact on Android vs iOS
About 10 days ago, we shared data on IDFA opt-in, ATT visibility and acceptance ratios, and iOS 14.5 adoption rates.
On May 21:
- iOS 14.5 adoption was just under 20% globally
- ATT restricted devices that will never see an App Tracking Transparency prompt were at 19%
- ATT see-and-opt-in devices were at 19.4%
- iOS ad-spend was down almost 25%
As we mentioned then, our goal was to regularly share data about this massive change so mobile marketers can get an industry-wide context for the app and company-specific numbers they are seeing.
Of course, as of May 27, there are some new wrinkles.
Apple has already released iOS 14.6, so we’re measuring both of those operating system versions, and we’ll add more as they come. In addition, we’re starting to see the emerging impact of SKAdNetwork’s inability to always correctly distinguish between organic and paid traffic. Also, we’ve added Brazil and Mexico to the data to get a better understanding of the LATAM impact of iOS 14.5.
Let’s jump into the data …
iOS 14.5 adoption rates: historically slow
iOS 14.5 and 14.6 adoption is historically slow for Apple mobile operating system releases. As of the end of May, only 21.6% of the devices that are installing apps in our key countries have upgraded. (That number is 24.3% globally, including data from other countries.)
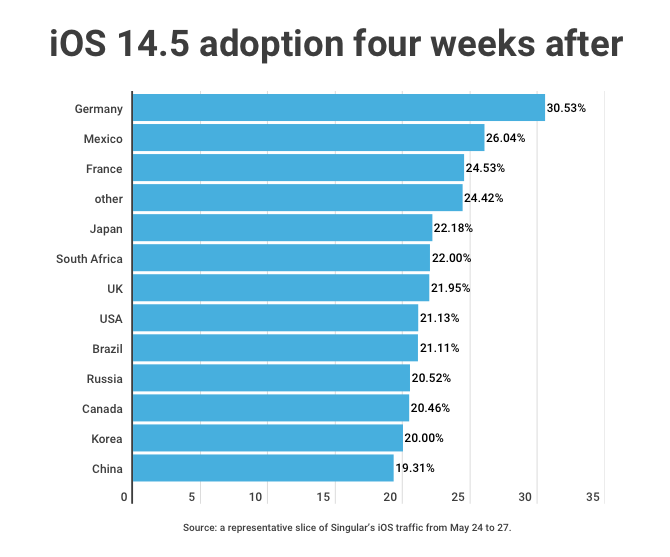
On average, each country or region is up two to four percentage points over an additional two weeks of iOS 14.5 (and 14.6) being in the wild, on a 15-20% increase. The one difference: China went from very low adoption (under 8%) to near global average, for nearly 150% growth.
Big picture, however: this is incredibly slow adoption.
At this same point in time since release, iOS 14.4.2 was at nearly 70% adoption. 14.4 was over 70%, and 14.4.1 was on a nearly vertical curve to the same range when replaced by the next available version.
Why?
One theory is that Apple knows the ecosystem changes are going to be massive, and it’s slow-rolling the release to dampen the effect and spread it out over time so the industry has time to react, change, and adapt.
Maybe.
But Apple has had other mobile OS versions as well that it has released extremely slowly: 14.2 and 14.2.1. The speed at which Apple suggests a system upgrade to iPhone owners could potentially be impacted by an internal perceived stability of the OS, or Apple wanting more time to refine certain features. Which could make sense, given that 14.6 is already available (and live on my phone).
App Tracking Transparency visibility
As mobile marketers know, ATT isn’t even available to call for a certain percentage of devices: those with the global ad privacy setting off, or devices set up for children. That number matters, because it’s automatically outside the universe of possibility for advertising measurability via IDFA.
The four possibilities for App Tracking Transparency status are:
- Restricted (marketers can’t ask for tracking permission)
- Denied (marketers can ask and did, and users rejected permission)
- Accepted (marketers can ask and did, and users said OK)
- Not asked (marketers can ask but have not yet)
Except where otherwise noted, all of the data below is based on the first three categories: where marketers at least attempted to ask for ATT authorization.
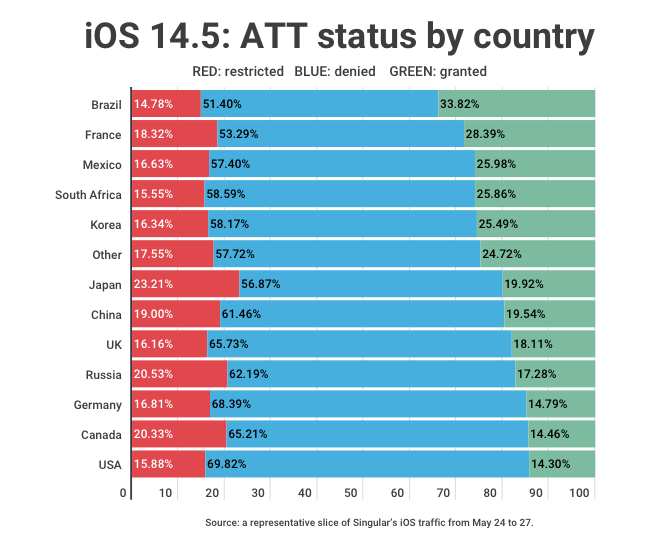
Brazil and South Africa may be among the world’s least privacy-sensitive populations, given they’re both near 85% ATT potential visibility. Japan, Russia, and Canada are most privacy-conscious, with Japan the lowest of all.
The global average is 82.6%.
On the face of it, that’s actually pretty high. More than four out of five people globally who use iOS and have already upgraded to 14.5 or 14.6 can be asked for tracking permission. Importantly however, the only direction that number is likely to move is down: migration is likely to be to more privacy, not less, and something that feels important enough to dig around in your phone’s settings is probably going to be an urge to lock down rather than one to open up.
ATT denied and authorized percentages
Global restricted rates — those who will never see an App Tracking Transparency prompt — are 17.44%. That’s down slightly from the 19% of devices in the previous dataset, which might mean that early adopters are more likely to be privacy conscious. (Or more technical and aware of where the global setting to turn ATT off is.) But it’s too early to be definitive on that.
As of late May, ATT see-and-allow rates are very slightly up to a global average of 19.7% from 19.4%. Here’s the restricted, denied, and granted data in one table:
Ad spend on Android versus iOS: lower but stabilizing
Two weeks ago we noted that ad spend on iOS was down almost 25% while Android ad spend was up. That trend has basically solidified, at least for the current period, with iOS spend still down to 32.3% of total from February’s 39.6%.
It’s down just a hair more from the previous period, which was at 32.7%, but that’s very minor, and might now be representing a floor from which iOS ad spend will rebound, or at least stabilize.
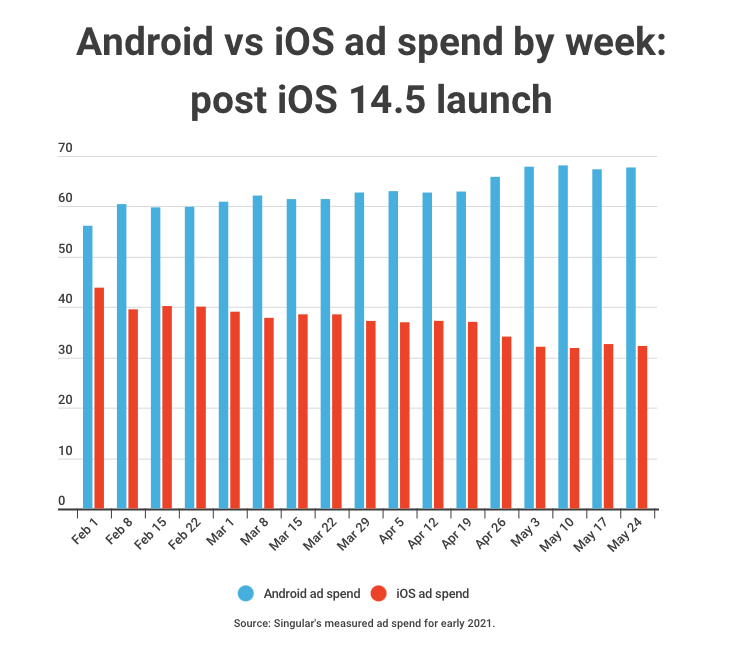
It’s incredibly important to note, however, that we’re very early on in the transition to the new era of privacy on iOS. 75% of devices have yet to upgrade. If the slow-down in iOS spend is due to degraded measurability, it could get worse. If it’s due rather to slow adoption by all industry ecosystem players, it could rebound.
There are a few options to consider, including:
- Ad spend is dropping out of iOS to nowhere
- Ad spend is migrating from iOS to Android
- Ad spend is migrating out of traditional app-to-app mobile marketing channels
If we look at total ad spend in our sample size for a clue, we see that in the last month total ad spend is down about 7% from February levels, and about 5% from immediately previous weeks. That’s interesting, but not definitive as there have always been seasonal shifts in ad spend — high in the end of year/beginning of year holiday season, lower in summer — and we don’t have enough data yet to prove a pattern.
(Also because there was some run-up in the pre-iOS 14.5 months as marketers got their last kicks at the IDFA can.)
Ultimately, it’s something that will bear attention in future data analyses.
Percentage of installs on iOS versus Android since iOS 14.5
One thing we did not check last time was whether the percentage of overall installs might be shifting from iOS to Android since iOS 14.5 dropped. After all, more ad spend should indicate more activity on Android, presumably.
Ultimately, we see a slight but sustained increase in Android installs versus iOS as a percentage of all installs. And, of course, a concurrent, sustained decrease in iOS installs.
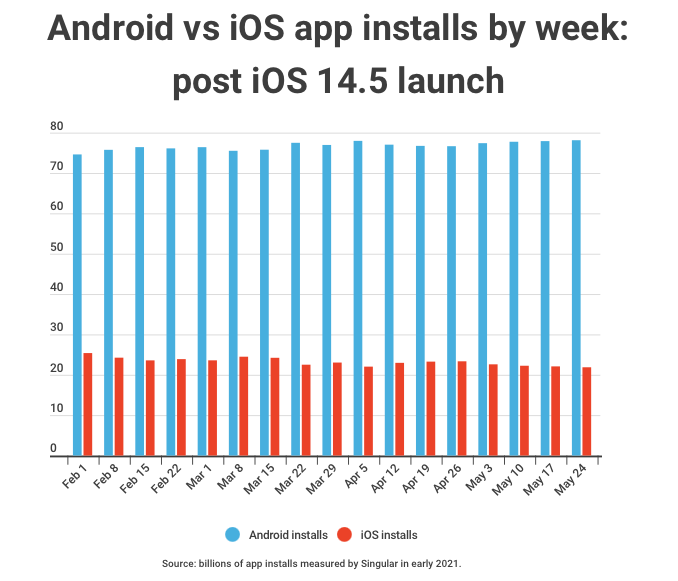
In February of 2021, iOS installs were 23-25% of all app installs Singular measured (prior data was a representative sample: this data is on all installs). Allowing for a slight reversion to near those numbers in early March, that percentage has slowly decreased to 21.9%.
Android’s concurrent rise, of course, has been from 74.6% to 78.1%.
It’s not a huge change, but it’s definitely significant. And it’s on a measured volume of installs in the billions, across the entire planet, so it’s unlikely to be a purely local phenomenon or glitch in the data. If this stabilizes or continues, it has impacts on where marketers focus their efforts, at least in traditional app install channels. As mentioned previously, with traditional digital user acquisition channels losing some degree of measurability, marketers may be looking to older (or newer) channels for at least some of their iOS growth.
Summing up: what we think we know, and what’s still challenging
We’re clearly seeing decreases in iOS ad spend and app install activity. What we don’t know is if those will continue, ameliorate, or get worse as the vast majority of iPhone and iPad owners upgrade over the next weeks and months.
Adoption is still very slow, and 14.5 is an unusual point release for Apple: not many are accompanied by global ad campaigns.
We also know and are starting to see that measuring organic versus paid installs is going to be more interesting. (By interesting, read: challenging.) Depending on privacy thresholds, actual conversions, as opposed to measured conversions (think: action taken in three days while your postback fires after one day, or purchases made five weeks later), web to app, flows that SKAdNetwork doesn’t know exist, and other shortcomings in SKAN, attribution on iOS is getting more difficult, and some things are getting missed.
Including separating out obviously organic from obviously paid acquisition.
There are solutions for this, and ways to work around it, but the reality remains.
Finally: help us help you
If you’re looking for help to keep the mobile growth ball rolling in privacy-safe environments including SKAdNetwork on iOS — and Android starting later this year, which is losing the GAID if people opt out of interest-based advertising or ads personalization.

Stay up to date on the latest happenings in digital marketing

