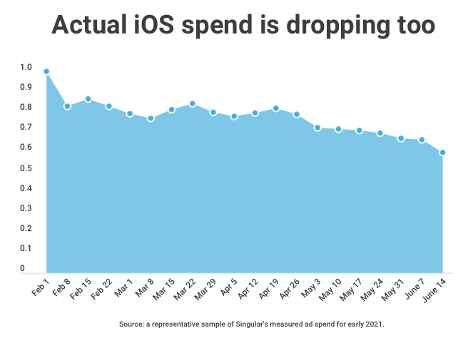
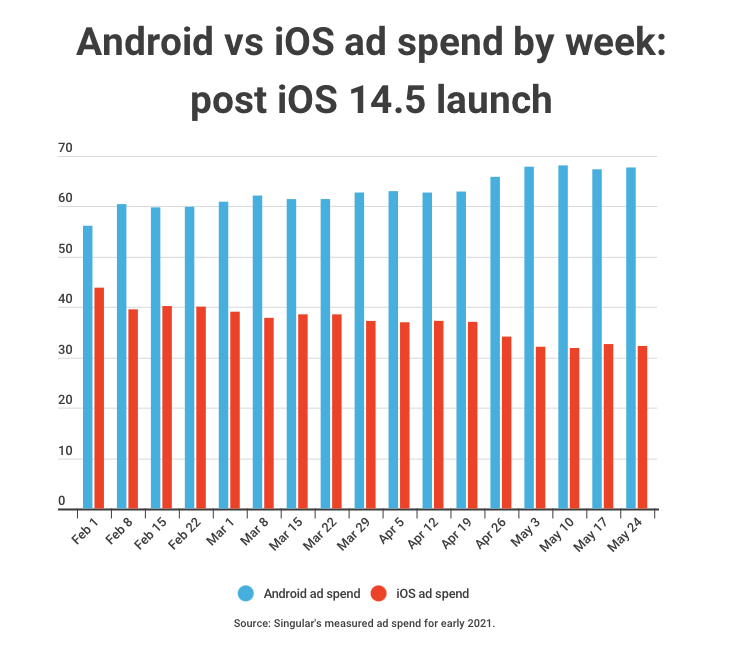
iOS ad spend is now down 32% from its peak in 2021.
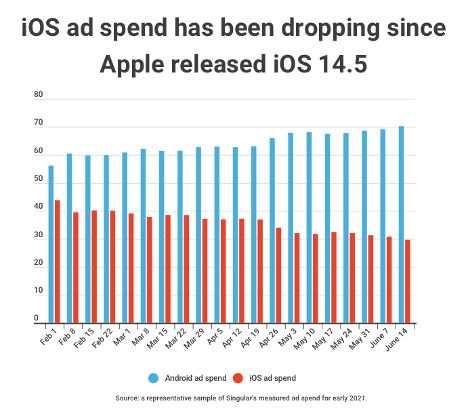
In early February, mobile advertisers that have both an Android and iOS app split their buying almost evenly between Android and iOS. Between February 2 to 7, marketers spent 56.16% of their budgets on Android app install campaigns and 43.84% on iOS.
But last week, from June 14 to June 20, the split was 70.29% to 29.71%.
That’s a massive difference in just four months.
Digging into the data: iOS vs Android ad spend since iOS 14.5
There are some explanations to make and a few caveats to mention here.
The chart above is a representative sample of Singular’s global ad spend data totalling more than $1.5 billion from February to June 20. All of the sample spend is from customers who have both an Android and iOS app.
Is this all due to iOS 14.5?
Probably.
But is the iOS ad spend situation as bad as the numbers look?
Probably not quite, no.
But it is significant. We haven’t seen this kind of Android vs iOS shift in recent years, so this appears to be a real event that’s actually reflecting a shift by mobile app install ad buyers globally. However, it’s very important to note that part of this apparently massive iOS to Android shift is likely due to artificially inflated iOS spend in the weeks and months before Apple released iOS 14.5. As we know, iOS 14.5 took away a guaranteed advertising identifier while making marketing measurement harder and user data more scarce. So part of the big numbers in iOS ad spend in February and March was likely pre-buying: purchasing ad inventory in the last days of the free IDFA before Apple’s iOS 14.5 came and made the identifier for advertisers an advertiser ask and a user opt-in.
So some of this massive decrease is likely illusory.
But not all of it.
Case in point: the mobile ad spend numbers after April 26 tell a similar story.
April 26, of course, is when Apple released iOS 14.5. In almost every week since then, the percentage of total ad spend that advertisers directed to iOS has dropped, while Android keeps rising. The week before iOS 14.5 dropped, iOS ad spend was 37% of total spend on Android and iOS combined. The week after, it was 32%, and except for a minor bump in the week of May 17, the downward trajectory has continued until last week, ending (for now) on June 20 at 29.71%.
It’s not just the percentage of iOS ad spend as a proportion of all mobile app install ad spend that’s dropping.
It’s also the actual spend totals.
If we normalize February 1-7’s ad spend as 100%, June 14 is 59.8% of that. If we agree that the early February data is an outlier and prefer to look at February 15, the June 14-20 data is still 26 percentage points lower: 86% of early February’s spend to basically 60%.
Correlation isn’t causation, right?
But … there’s something else that has been happening at the same time.
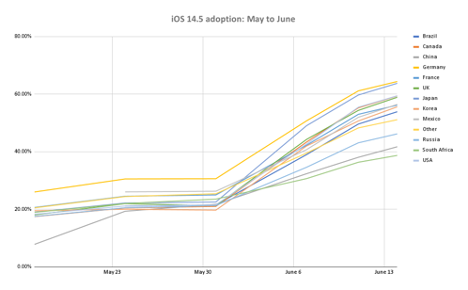
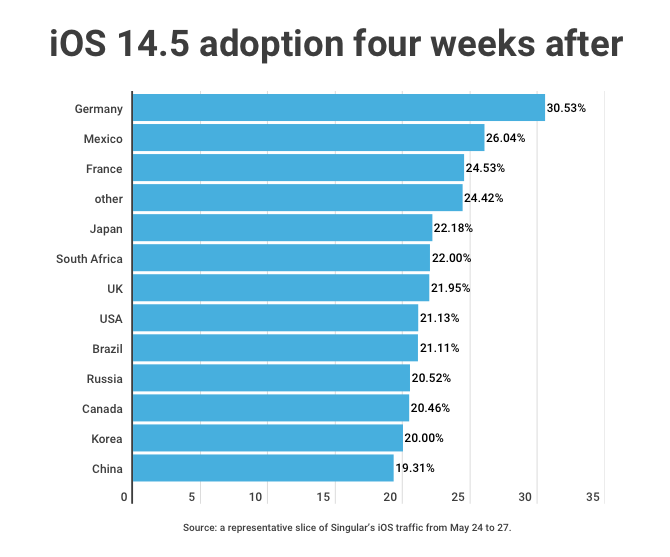
iOS 14.5 adoption hit the turbo button
Right after May 30, Apple flipped a switch and started informing iOS users that there was an upgrade available. Adoption rates, which had been slow, immediately picked up. By June 17, the latest data I have, 52% of global iPhone owners have updated their devices to iOS 14.5.
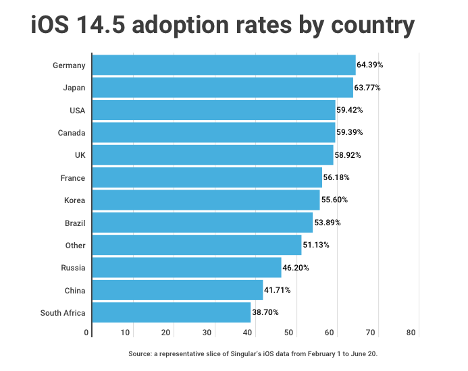
Germany leads the pack with almost two thirds having updated their devices, while South Africa is just shy of two fifths. After a slow start, Chinese users have rapidly accelerated their updates.
If there’s a causal relationship between availability of ad identifiers and ad spend focus, the ad spend percentage between Android and iOS is likely to continue to change in Android’s favor. If this is a temporary phenomenon until advertisers rejig their growth stacks for SKAdNetwork and non-fingerprinting probabilistic measures of advertising effectiveness, the iOS ad spend percentage could rebound.
Time, as they say, will tell.
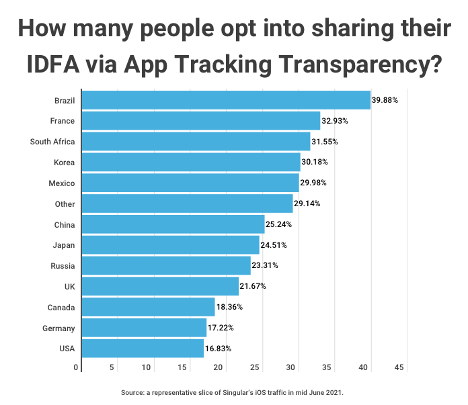
And … App Tracking Transparency opt-in rates?
ATT rates haven’t really changed through the iOS 14.5 adoption curve.
On May 21, when iOS 14.5 adoption was under 20% globally, ATT-restricted devices were at 19% and opt-in rates were at 19.4%. On June 4, that was only up to 24.3% globally, and opt-in rates were up a hair to 19.7%.
As of last week, we’re at 23.64%. Note: that means 23.64% of the time when iOS apps requested App Tracking Transparency authorization, they get it. More than three quarters of the time, however, they do not. As many others have written about, thanks to the dual-opt-in necessity of marketing measurement in iOS 14.5 (advertised app and ad-displaying app) these numbers mean that unless your app is an extreme outlier, the IDFA is essentially useless for what it once was: the definitive provider of attribution truth.
(One caveat here: even if your dual opt-in rate is only 10% or so, if you find that your ATT opt-in users are representative of your ATT opt-out users, you might be able to cautiously make some optimization inferences.)
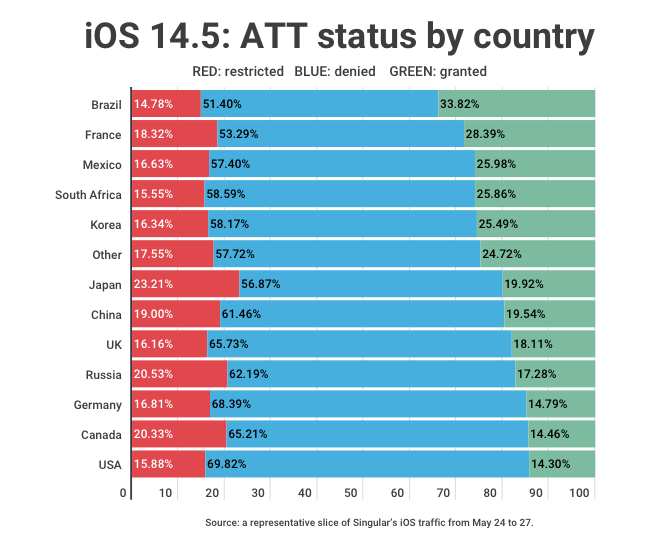
Interestingly, some countries are significant outliers here:
While the global rate is edging up as late adopters start to update their iPhones and iPads, regional differences are much more significant. In Brazil, almost 40% of people opt-in to tracking; in the USA, where Apple has advertised heavily about its privacy enhancements, the rate is significantly lower: 16.8%.
Subscribe for insights by mail
We’ll be updating these numbers soon, and adding more insights on different aspects of SKAdNetwork. If you don’t want to miss any, you may want to sign up for Singular’s content email newsletter.
Scroll down on the blog home page to find the “Stay up to date” sign-up spot. Then, when you get the first email, drag it into your priority mailbox to tell Gmail or whatever email app you use that it’s important.
We don’t spam. We do aim to provide a significant amount of insight and value. And we’re honored to be one of your sources of vital marketing ecosystem information.
Fintech is hot. Glowing, burning, incandescently hot.
In the first quarter of 2021, fintech startups raised $22.8 billion, 50% more than all of 2020. The sector is growing 20% annually, according to ResearchAndMarkets. And no wonder: the use of cash has dropped more than 42% in the U.S. since 2019, and COVID shutdowns and lockdowns have 80% of us thinking we can bank without a building.
A massive 72% increase in fintech app use means more startups are piling in. As of February 2021, there are more than 26,000 fintech startups, says iTechArt. That’s double the number in 2019 with most of the funding going to top sectors like mobile wallets, payments, insurance, and digital banking.
And it might continue to grow, because the fintech investment market size is expected to grow at an annual average of 53% until 2027, according to Orion Market Reports.
In other words, this is a category worth paying attention to.
In this special fintech report by Singular, we’re going to:
overview the mobile fintech ecosystem
list some of the top players
identify the major categories
highlight what’s driving most customer and user penetration right now on mobile
list the top 50 fintech apps on both iOS and Android
shine a light on what big tech — Apple, Google, Microsoft, Amazon, and Facebook — are doing in fintech.
Origins of fintech (it’s older than you think)
Believe it or not, fintech is … kind of old. In fact, if we define financial technology as digital or electronic means of dealing with money, fintech has its roots over a hundred years ago.
In 1918, the U.S. Federal Reserve built the Fedwire Funds Service, which still exists today. Using Morse code on public telegraph circuits, the Fed ensured that the U.S. dollar was worth the same amount in Pittsburgh as in Poughkeepsie, in Seattle as in San Antonio, and that interbank transfers could happen without time-consuming and risky transfers of cash or gold.
In 1995, Wells Fargo — yes, the same company that operated the Pony Express in 1861 — made the first online checking account available.
And on May 22, 2010, a day that will forever be remembered as Bitcoin Pizza Day, Laszlo Hanyecz became the first person to spend cryptocurrency to purchase a physical item: Papa John’s pizza. Hanyecz spent 10,000 bitcoin for the pizza, worth approximately $350 million today. (I hope it tasted great.)
When we think of fintech today, however, we think of new tech that manages, sends, invests, stores, and maximizes our money.
Categories and sub-verticals within fintech
There are likely as many different categorizations of fintech as people thinking about the category, but here’s an overview that simplifies the diversity in fintech as much as possible.
Note:
The banking category is mostly reserved for traditional banks who are rapidly expanding into all areas of fintech. While I could have merged the neobanks category with banking, I kept it separate to highlight the fact that you have a dichotomy between traditional banks with massive brands and new banking startups that may not do everything a traditional bank does, but were generally born online or even born mobile.
Fintech categories
Examples & top players
Banking
Bank of America, Chase, Wells Fargo, Credit One, Navy Federal, US Bancorp, Citigroup
Budgeting
Mint, PocketGuard, Goodbudget, Honeydue, Personal Capital, YNAB, Everydollar, Intuit, Apple Pay
Buy now, pay later (BNPL)
Afterpay, Perpay, PayPal Pay in 4, Klarna, Affirm, Sezzle
B2B services
Stripe, Kabbage, Clearco (was Clearbanc), Lending Club, Square, Zelle, Novo
Credit history & monitoring
Credit Karma, Experian, Credit Sesame, MyFICO,
Cryptocurrency, decentralized finance (DeFi)
Coinbase, Binance, Crypto.com, Trust, Voyager, River, eToro, Webull, Gemini, BlockFi
Education
World of Money, Zogo, Investmate, Penny, Bankaroo, FamZoo, iAllowance, NerdWallet
Insurance
Geico, Progressive, Lemonade, Allstate, State Farm, Jerry.ai, Esurance, Metromile
Western Union, WorldRemit, Azimo, Venmo, PayPal, TransferWise, MoneyGram, Cash App, Apple Pay, Google Pay, Xoom, Facebook Messenger, Walmart Pay
The top 100 fintech apps on the App Store & Google Play
To get a good sense of what’s winning in mobile fintech I looked at the apps that are winning right now on the App Store and Google Play.: the top 50 on both iOS and Android, based on number of downloads/installs over the past 90 days.
The most interesting findings?
Out of the 100 total apps on both the Android and iOS top apps list, 78 are duplicates, meaning that 39 out of the 50 iOS apps are also top 50 apps on Android, and vice versa
Payments is the single biggest mobile fintech category in terms of app install activity:
iOS: 4 out of 5 of the top iOS fintech apps are payments apps
Android: 5 out of the top 6 apps on Android are payments apps
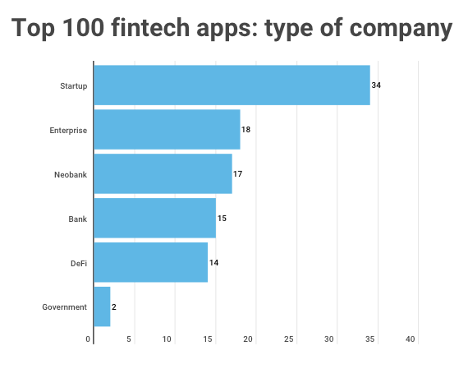
65% of the companies that have top-100 fintech apps are startups: young disruptive companies
Just 15% of the brands that have top-100 fintech apps are traditional banks
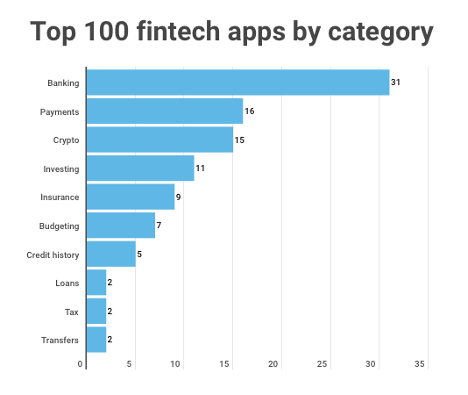
Just 4 categories make up 73% of the fintech app ecosystem top 100 apps
Banking
Payments
Crypto
Investing
There is only 1 government app in the fintech top 100: Fresh EBT, which is a food stamps app
Android has almost twice as many neobanks as iOS, possibly because Android has a large number of inexpensive devices in addition to higher-end devices, and unbanked people who are more likely to use a neobank’s services are also more likely to own a relatively cheap phone
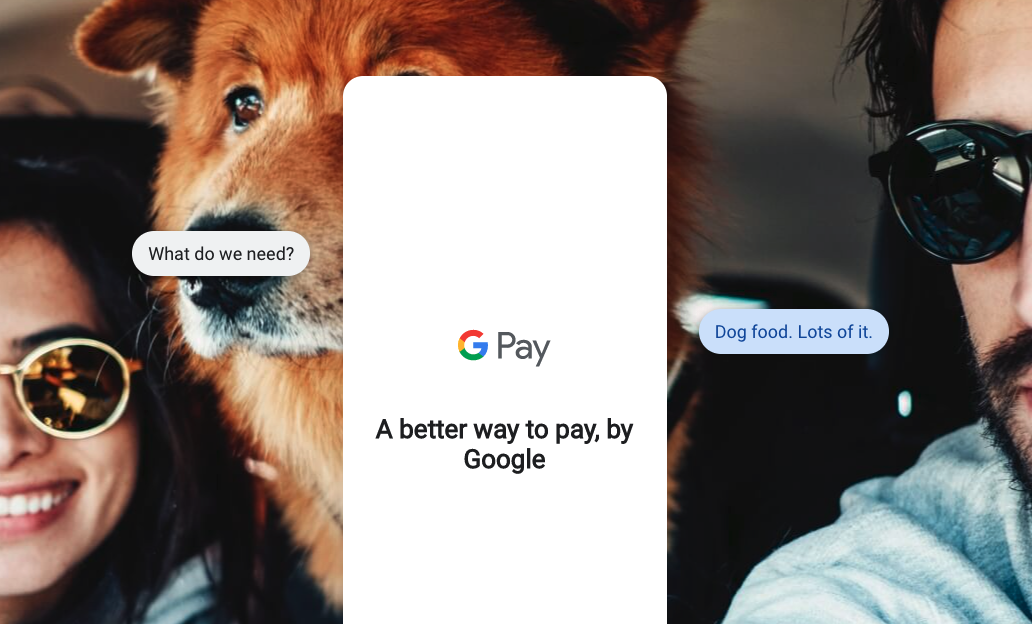
One of the most interesting payment services, Apple Pay, doesn’t even show up on the list because it’s a default in iOS … not a separate app (more on Apple Pay later)
Here are the top 50 apps on each platform by downloads over the past three months, according to App Annie. (Note: data pulled June 18, 2021.)
If we look at them by category, we get a better sense of what’s happening in the mobile fintech ecosystem.
Banking is by far the biggest sector by number of apps, whether by neobank or traditional bank. And while payments is the largest sub-vertical in the very upper echelon of fintech apps — the ones with the most installs — it’s second in the top 100. Crypto is high, as is investing, but afterwards the categories begin to thin out a little.
Payment apps are interesting for a lot of different reasons. First, they’re daily use or at least potentially daily use apps. As such, they’re the perfect app to make a tiny fraction of each transaction and still be able to bring in a lot of revenue. In addition, simple because they are daily use apps, they can be used as a thin edge of a wedge to add on additional features over time, or launch complementary services thanks to your brand being top of mind for users/customers when it comes to money.
It’s a very powerful position to be in fintech, and that’s why Google and Apple are competing fiercely in the space.
From 2020 to 2024, Worldpay estimates that credit card share of e-commerce sales in North America will drop from 23% to 21%, while digital wallets and payment apps will increase from 45% to 52%.
Of course, there is a thin line between payment apps and transfer apps. When apps have a name like WorldRemit, it’s pretty clear what the main function of the app is. But it’s just as possible to use Venmo or Google Pay to send money, depending on where you want to send it and how much cost and hassle you’re willing to put up with.
Here’s the data, so you can see how it breaks down by category:
Top 100 fintech apps by category
iOS
Android
Banking
15
16
Budgeting
4
3
Credit history
2
3
Crypto
8
7
Insurance
4
5
Investing
6
5
Loans
1
1
Payments
8
8
Tax
1
1
Transfers
1
1
It’s also interesting to look at the top 100 fintech apps by type of company that publishes them: startups, enterprises, governments, or other.
Again, please note that there’s some license here in how I categorized them. PayPal is hardly a startup anymore in any real sense, but I categorized PayPal as a startup because, while rather aged for that status, it’s clearly not the same as a Bank of America or Citigroup. Also, I separated neobanks and banks because they’re just different types of entities … even though they are likely converging more and more together and I combined them above in the banking sector.
Again, here’s the raw data by iOS and Android so you can drill down. Clearly, neobanks are more common on Android than iOS, but everything else is fairly close between the platforms … as you’d expect when 78 of the top 100 fintech apps on iOS and Android are duplicates.
Top 100 fintech apps by type of company
iOS
Android
Bank
9
6
DeFi
8
6
Enterprise
10
8
Government
1
1
Neobank
6
11
Startup
16
18
Big Tech and fintech: Apple, Google, Amazon, Microsoft, and Facebook
I mentioned earlier that Apple Pay didn’t even show up on the list of the top 50 payments apps on either platform because it’s a default in iOS. In fact, my new iPad Pro tells me every day that device set-up is incomplete because I haven’t set up Apple Pay yet by loading in my credit cards.
What’s interesting about Apple Pay is that it is deep integrated into both Apple’s mobile operating system and desktop. Plus, Apple has the innovative Apple Card — which is still U.S.-only — but offers no fees, ground-breaking family budgeting features, cash back, and useful data on spending patterns.
In addition, Apple Pay has simply huge existing reach and even more massive growth potential:
48% of iPhone users reportedly have used Apple Pay
18.3% say they’ll use it exclusively when possible
Apple Pay could make up 10% of credit card payments by 2025
According to eMarketer, Apple Pay is three times the size of Google Pay. The last time Apple CEO Tim Cook provided numbers on Apple Pay, he said that Apple had all-time record revenues from payment services, with over three billion transactions in Q4 2019. You can bet it’s far more than that now. Cook also said Apple Pay has more transactions than PayPal and was growing four times faster.
“Apple Pay … has become one of the top three most widely used mobile payment services in Canada, Ireland, Italy, Russia, Saudi Arabia, Spain, UK, and the US.”
But the other big tech companies aren’t laying down and conceding the market.
Google Pay (or, as Google is styling it recently: G Pay) is tops on the Android side and also has a significant presence on iOS, ranking 24th there. In addition, Google has a much larger global userbase to convert to its financial apps. It is true that on Android Google has a more challenging time than Apple to integrate Google Pay into the operating system because partners can adjust Android as they wish, but Google can likely do more here as well.
Google is also working with retail partners like Albertsons to integrate their operations with Google Pay. And there are enough Google fans on iOS who choose Google’s payment service over Apple’s that Google Pay is a top-25 app in the fintech category of the App Store.
In addition, Google has significant capabilities, installed base, and advantages in voice-based commerce on Google Home and in the Google app on both Android and iOS, suggesting that as customers get more and more used to asking Alexa, Siri, or Google to order more toilet paper or rent a movie, Google will do well here.
The rest of big tech is busy in fintech as well.
Facebook is working closely with Shopify, and while Facebook’s digital currency Libra (now Diem) has lost some of its luster, there’s still opportunity to achieve something interesting there because Facebook owns access to literally billions of the most desirable consumers on the planet. With massive investment flooding into cryptocurrency and digital assets right now as well, we can’t count Libra/Diem out just because its stablecoin aspirations seem stymied or delayed at the moment. In fact, we’ll probably see a limited launch of Diem this year, and it might not only be for purchasing on-platform digital goods.
As you’d expect, Microsoft is working more on the business side of fintech, while Amazon has offered Amazon Pay since 2007 and has acquired fintech companies enabling both online and offline purchases. And, of course, Amazon is one of the biggest e-commerce companies outside of China.
The fintech 2021 challenge: keep, grow, compete
COVID normalized digital banking, and the result was massive growth in fintech app usage, especially in the payments and banking categories.
The challenge for 2021 is to keep those new users while continuing to expand both customer base and solution set. In some sense there’s a race to the middle between banks and neobanks. Traditional banks need to continue to get more digital and mobile. Neobanks in many cases need to offer more services and capabilities to amortize the cost of customer acquisition over more revenue-generating events … and to avoid losing customers to one-stop-and-you’re-done fintech competitors.
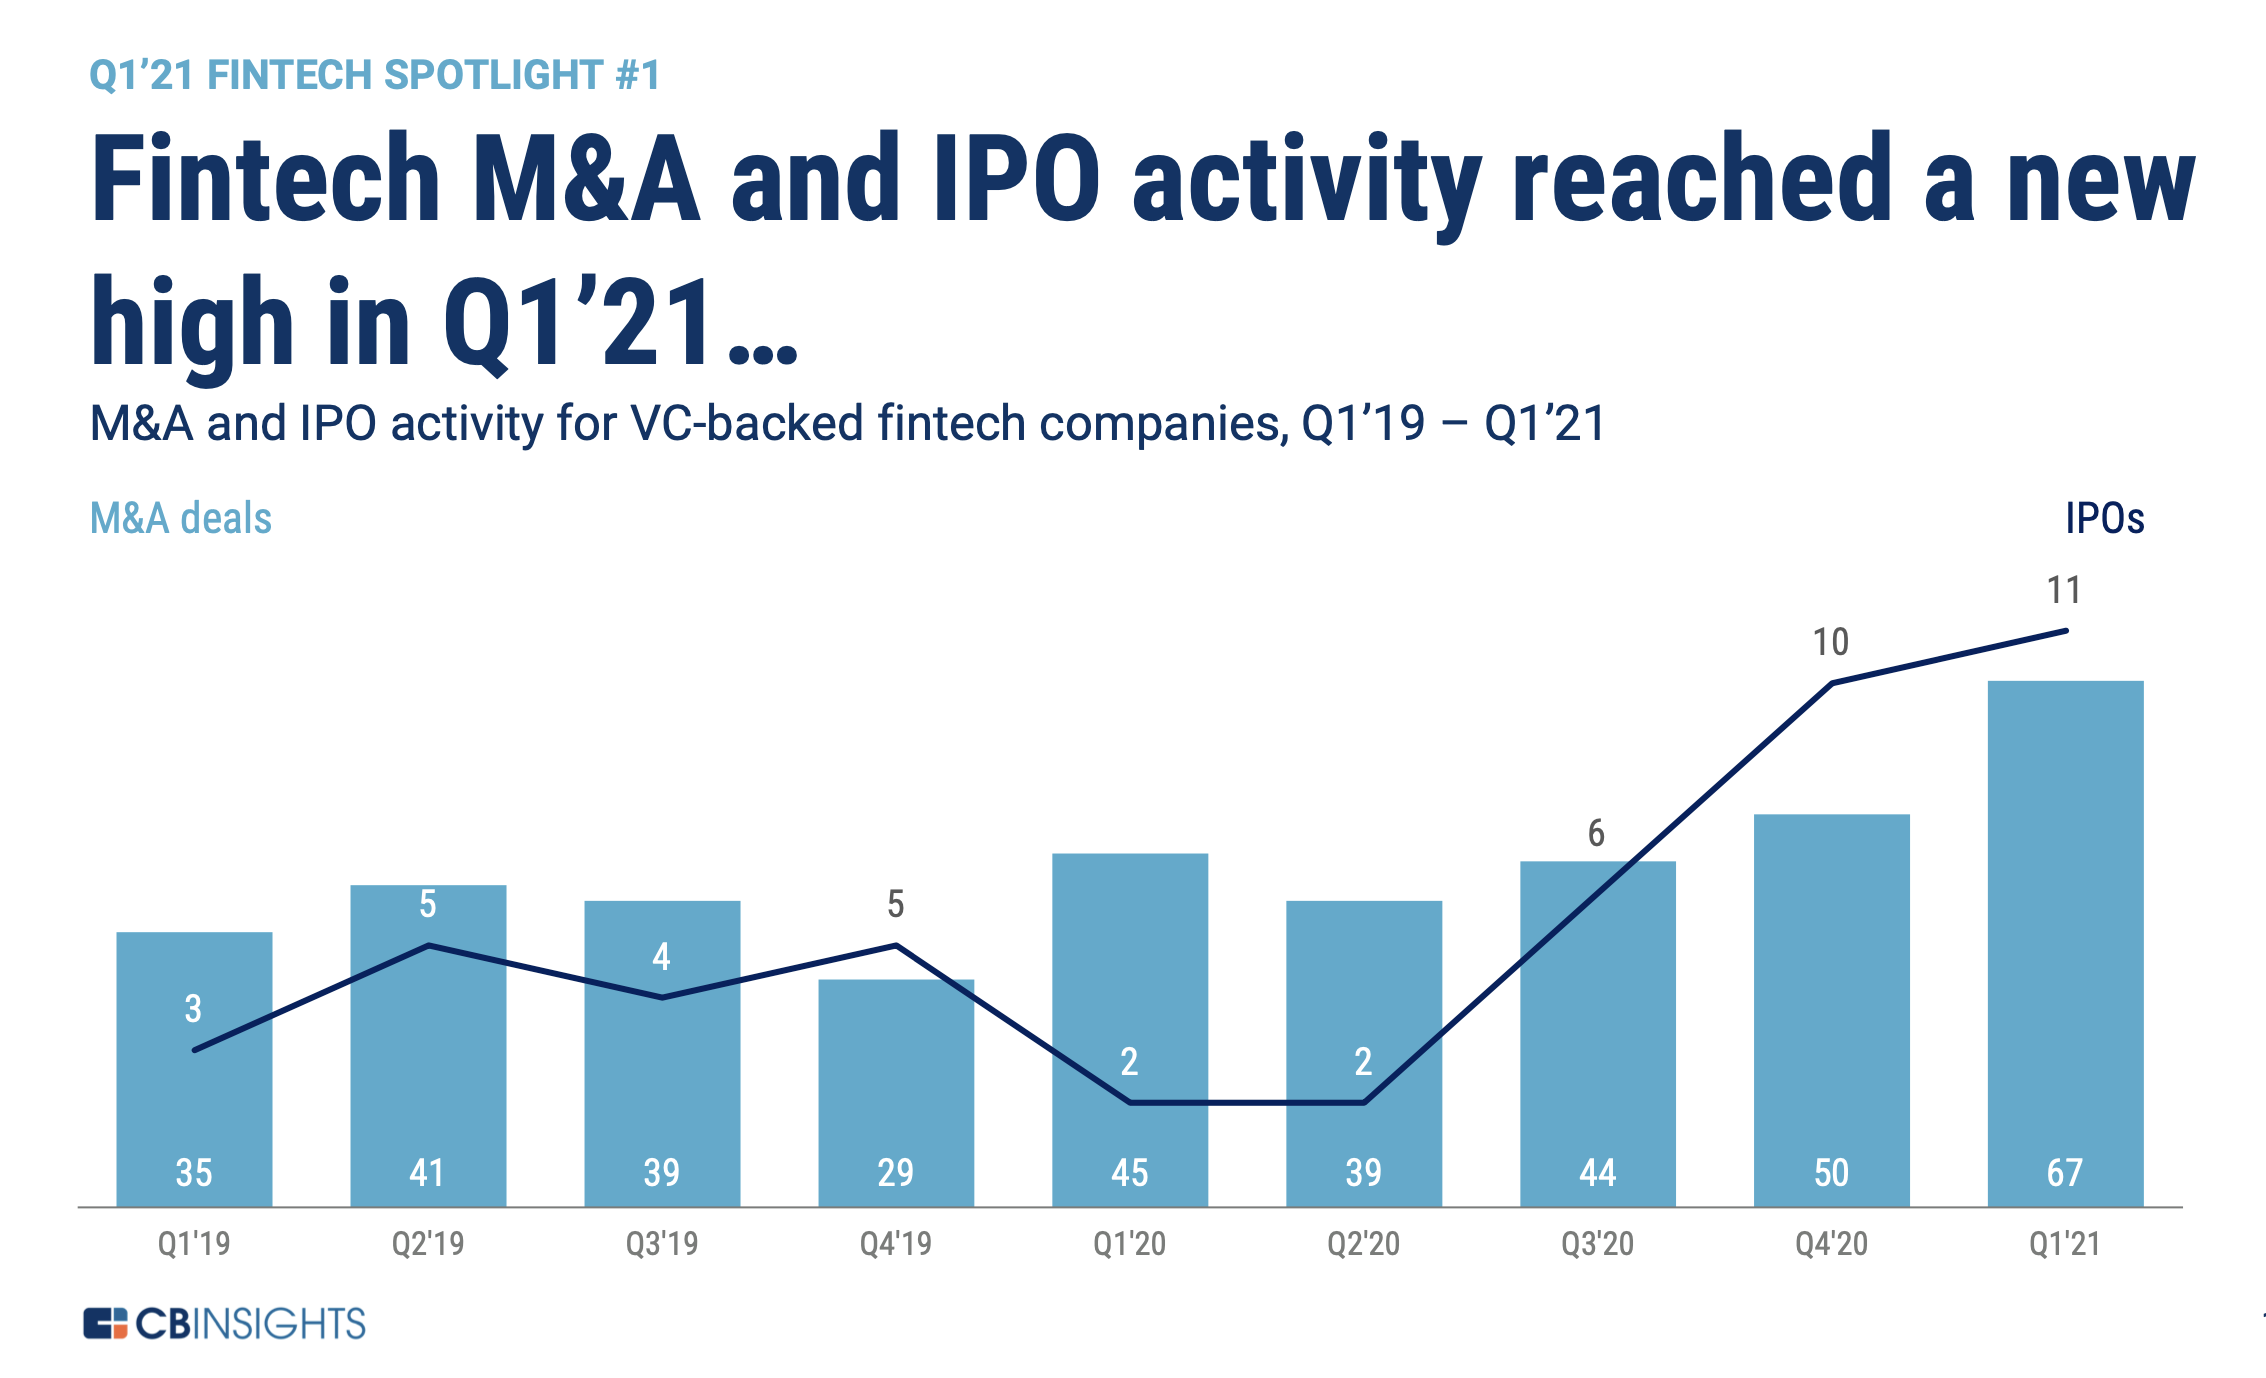
Which is why, according to CB Insights, fintech mergers and acquisitions (and IPOs) reached an all-time high in the first quarter of 2021:
American Express, for example, bought Kabbage, a B2B fintech startup, last year, and this year is integrating it into short-term credit products for businesses. SPACs are the new IPOs, in some sense, and MoneyLion, eToro, SoFi, and Bakkt all signed agreements to go public via special purpose acquisition vehicles in the first quarter of 2021. And startups like Robinhood, Klarna, Paradigm, and Stripe all raised hundreds of millions, with Robinhood taking in a staggering $2.4 billion of new investment.
LATAM has significant activity here, with Brazil-based Loft and Nubank both raising mega-rounds as well.
The challenge for fintechs today is to continue to grow in this hyper-competitive market that has been flooded with new cash. Finding the most optimal means of customer acquisition will be a huge competitive advantage, as well-funded rivals are almost guaranteed to be spraying money around like it’s the dot-com boom all over again. And with 26,000 fintech startups globally, this is not going to be an easy sector to win in.
Growth marketers and fintech
Growth marketers have a significant challenge in fintech. Your rivals literally have billions of dollars in new investment. Most of your top competitors have grown significantly through lockdown and quarantine periods.
What’s the best path forward?
Making sure every dollar of spend provides ROI. Optimizing ROAS across new, innovative channels and platforms. Killing poorly-performing partners quickly. Getting the best and the quickest insight into growth opportunities.
It won’t be easy.
Singular can help
If you’re a fintech startup and are looking for marketing intelligence that can drive growth, and marketing measurement that provides the best insights for ROI optimization, book some time with Singular.
Grab a slot here, and let’s chat. We’ll listen more than we talk, understand your business and your needs, and share what we can do to help.
You’ve heard that Google’s making a big step towards mobile privacy by zeroing out the GAID, or Android advertising ID, for people who opt-out of ad personalization on Android. What you haven’t heard is how utterly minuscule the percentage of people that this impacts actually is.
So we checked.
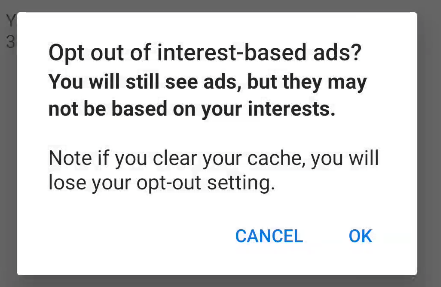
And based on a recent sample of Singular data consisting of more than 176 million Android smartphones globally, only 2.08% of Android users have tunneled down into Settings -> Privacy -> Advanced -> Ads and actually turned Ads Personalization off. Most countries are in the 1-2% range, but one country is a massive outlier.
Keep reading to see the data for 12 major nations …
Google Advertising ID: what it is and what it’s used for
The Google advertising ID or Android advertising ID identifies an Android device for advertisers. Ad networks can do rate limiting based on the GAID. They can do retargeting. Marketing measurement companies like Singular can do attribution, which helps advertisers understand how successful campaigns and partners are. And advertisers can track how valuable new users or customers that they’ve acquired from various campaigns, creatives, or sources are, giving them important information for future marketing optimization.
But when you can follow an IDFA on an iOS device or a GAID on an Android device around the world by seeing where it pops up in mobile ad auctions, you can also do some shady things.
In the past, Google has essentially relied on the honor system: if an Android owner opts out of ads personalization, the advertising identifier was still available if an adtech vendor asked for it.
There’s a reason for what, on the surface, seems like an odd decision: the GAID is also used for analytics, fraud detection, and attribution. In other words, non-advertising situations. But it’s a little odd to use an advertising identifier for non-advertising purposes … and it’s even more Boy Scout to think that there are no bad actors out there who will use what’s available regardless of the guidelines and rules.
So now Google is doing what Apple has did on iOS versions pre 14.5 when people turned Limit Ad Tracking on: zeroing out the Android advertising identifier if people turn Ads Personalization off. (Note how those actions move in opposing directions but essentially do the exact same thing.)
But, very few people opt out of Ads Personalization on Android
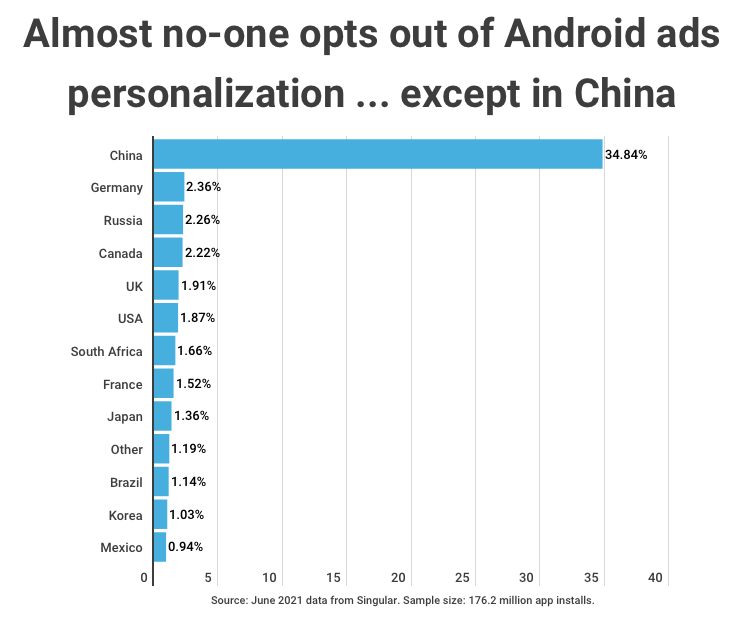
While zeroing out the Google advertising ID is a nice gesture from Google and will increase privacy for those who care, the reality is that almost no one opts out of Android ads personalization. Literally, 98% of people globally have kept the default Android setting to personalize ads.
A couple caveats on the below data: it does not include server-to-server traffic, where Singular doesn’t see the GAID, and there are some devices where the Ads Personalization on-off setting isn’t available. Also, this particular sampling of data doesn’t include a lot of China-based data, so the massively higher opt-out rate in China isn’t impacting the global percentage very much.
Clearly, the Ads Personalization setting in Android is almost irrelevant, except in China.
Why China is such a massive outlier here I cannot say with certainty (ping me if you can) but I assume is likely due to some version(s) of Android from one or more Chinese manufacturers that ship with different defaults. Anyone can get Android source code from the Android Open Source Project and then fork it for their unique take or skin on Android, which is why Xiaomi has MIUI, Vivo has Funtouch OS, and Oppo has ColorOS.
Essentially, opting out from ads personalization on Android is a rounding error.
But it wasn’t always this way.
‘Limit Ad Tracking’ on Android used to be higher
I first studied Limit Ad Tracking on iOS and ads personalization on Android in 2016 as the Mobile Economist for TUNE, a former mobile measurement partner. (A lifetime ago!) Ad Age’s Kate Kaye picked up the story.
At that time, LAT was already falling. Across all mobile devices from both major platforms, limit ad tracking was down about 5% in a year:
Use of the limit-ad-tracking setting fell to 16.7% of devices in February from 22% in August 2015, according to Tune, which observed 1.3 billion mobile app installs by about 150 million people over seven months, from August 2015 to February 2016.
This is the first example of data measuring the use of the limit-ad-tracking feature, said Jules Polonetsky, CEO of the Future of Privacy Forum. Limit ad tracking, he continued, “despite being this central privacy control, really doesn’t get a lot of debate or discussion.”
That year, the number of Android users who had turned ads personalization off was more than double the number of iOS users who had turned Limit Ad Tracking on. (Yes, I know the opposite direction here is confusing; both actions essentially do the same thing.)
[In 2016] 11.4% of iOS users had turned LAT on, limiting the data that they provided to advertisers. On Android, 25.3% of Americans had switched off ads personalization, which accomplishes the same purpose.
But in 2020, we’re seeing significant changes in opposite directions. Now, ads personalization on Android is down to just 2.3% and Limit Ad Tracking on iOS is up to 31.5% — a massive swing in opposite directions on both major mobile platforms.
Here’s the data from early 2o20 in a chart:
Apple starting banging the privacy drum
Between 2016 and 2020, Apple started banging the privacy drum. Which of course is even louder now with iOS 14.5, SKAdNetwork, privacy-safe marketing measurement, a completely opt-in approach to ad measurement and tracking, a new App Privacy report in iOS 15, and Infinity War style TV ads with nosy people popping out of existence.
(Check back on the Singular blog next week, by the way: we’ll be updating that report.)
The upshot for Android
The upshot for Android is pretty simple: Google’s change won’t impact much. It’s the right call, and some would argue overdue, and it signals a new Google approach to privacy along with FloC and other initiatives.
But for now: Android-focused growth marketers are essentially going to be doing business as usual.
Also, there’s good news: Google will be replacing the GAID with an alternative solution for use cases that are not ad personalization related. And it’s coming soon:
In July, we will provide an alternate solution to support essential use cases such as analytics and fraud prevention.
That’s good news for marketers, and it’s something that Apple might want to take a look at and consider. There are places that SKAdNetwork simply doesn’t work or offer a solution, and the industry needs privacy-safe replacements for what has been taken away.
Need to chat? We have a sofa
If you’re looking for experts to chat about next-generation marketing measurement in a confusing and ever-changing era of increased privacy and shifting technologies, we’re here to help. We’ll listen, learn, maybe offer a few condolences, and then share how Singular can help you with your unique challenges and requirements.
For everyone else in mobile marketing, the end of mobile advertising as we knew it happened just weeks ago when Apple finally released iOS 14.5. But kids-focused mobile app publishers had their privacy apocalypse way before: almost 18 months ago. Growth, measurement, and monetization in the kids category changed massively in early 2020, when Apple restricted access to the IDFA and other device and personal data in kids categories.
And back then, there was no SKAdNetwork to take the place of the IDFA.
Losing the IDFA in the iOS 14 privacy apocalypse and adapting to regular SKAdNetwork changes and updates has most mobile marketers living in a constantly changing Inception-style world.
But not publishers of kids’ apps.
SKAdNetwork: huge for kids’ apps
Because for kids apps makers, iOS 14.5 is a wonderful thing. These days are happy days. And the marketing measurement data they’re now getting — that every other marketer thinks is barely a trickle — seems like a flood to data-starved kids advertisers. And that could unleash a whole new round of investment and innovation in the children’s sections of the App Store.
Watch the interview with Kidoz co-CEO Eldad Ben Tora:
User acquisition for kids apps slowed dramatically in January 2020 as publishers were left blind, says the co-CEO of Kidoz, the world’s largest kid-focused mobile ad network. Targeting moved to contextual, measurement meant that you got an install from somewhere by someone, but not much more. And post-install engagement and conversion data was totally nonexistent.
Now that’s all changing.
“IDFA was taken and they were … left blind,” says Eldad Ben Tora, co-CEO of Kidoz. “Many app publishers that wanted to do user acquisition stopped for about a period of a year … now [SKAdNetwork] lets publishers in an aggregated way, in a way that doesn’t harm or risk kids’ privacy, to understand the value of each source and to attribute revenue to this source.”
The result, Ben Tora says?
Smart user acquisition in the kid space is actually growing for the first time in 18 months. Publishers badly need growth … and now it’s possible in a safe and optimizable manner.
Safe attribution for kids with Singular
Which means it’s good time for Singular’s privacy-compliant child-safe attribution product, which abides by the strictest COPPA (Child Online Privacy Protection Rule) and GDPR guidelines, and is a member of the PRIVO Kids Privacy Assured Program.
“Singular specifically looked at the kids market and they understood that the need for kid-friendly attribution exists, and kid-friendly attribution wasn’t really addressed by the other players,” says Ben Tora. “No-one said: ‘we provide safe attribution for kids,’ and I’m very happy that Singular said so.”
The result, Ben Tora says, is good, usable marketing measurement: impressions, clicks, installs, and revenue … all while maintaining full user and device privacy.
Today that’s more important than ever because advertisers are losing their access to kids. Kids make up more than 30% of all internet users and 40% of all new users (unsurprisingly), so they’re a critical demographic … maybe even the biggest market out there, Ben Tora says.
But how they access media is changing.
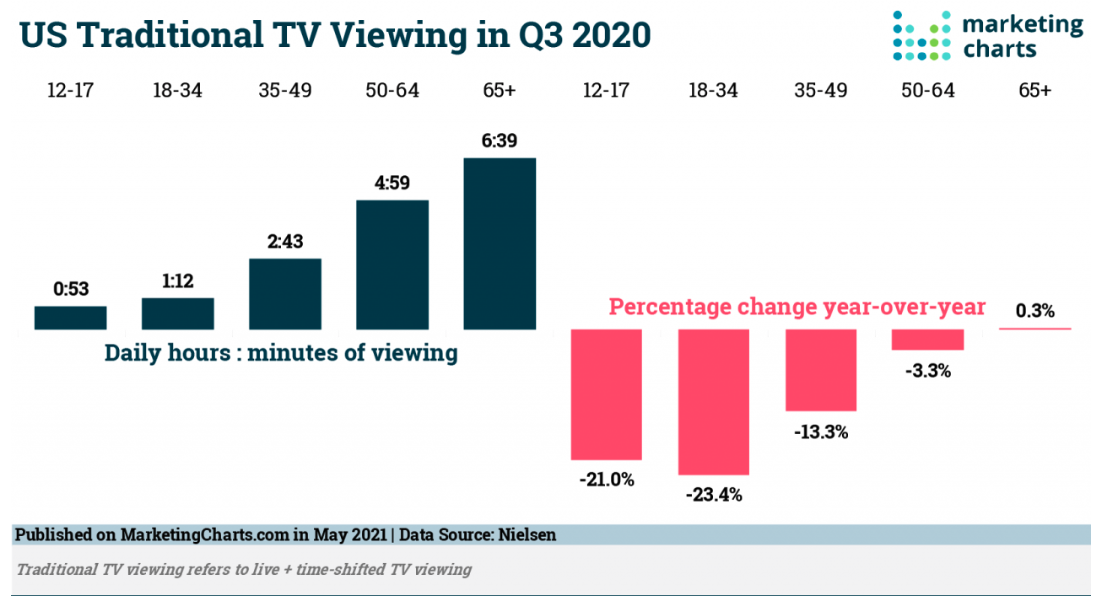
TV viewership is down, according to Nielsen and Marketing Charts
“[Advertisers] pretty much lost their number one channel, which used to be TV,” he told me. “If they do watch TV, they watch Netflix and other streaming services.”
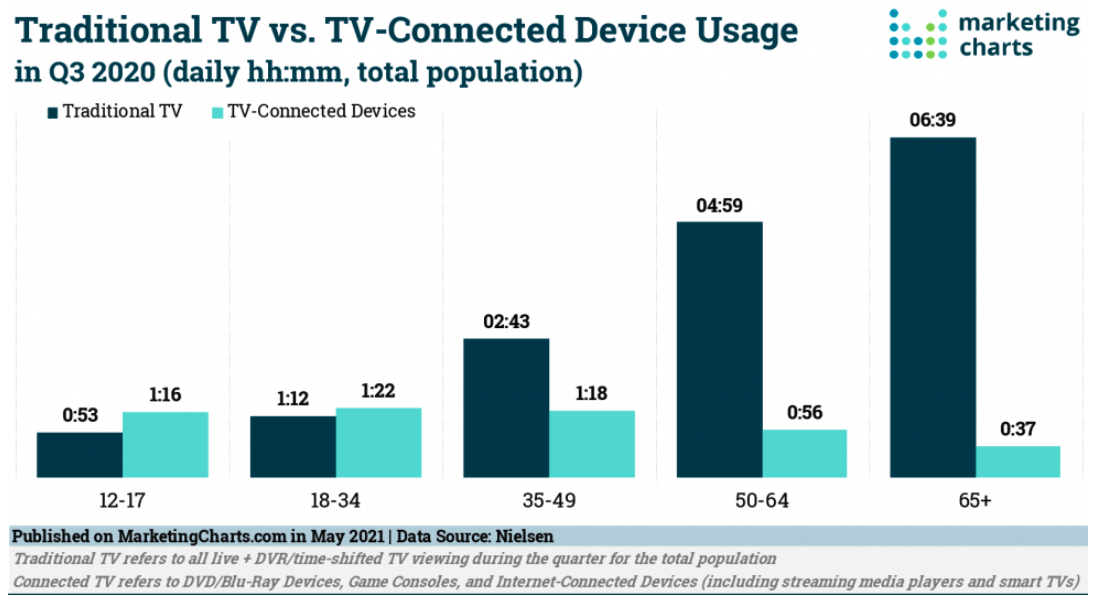
In fact, connected streaming media is now a majority of TV time for kids and young people, according to MarketingCharts and Nielsen:
Traditional TV vs streaming video: kids usage has changed, according to Nielsen and MarketingCharts.
Better monetization for kids apps now
So there’s been a disconnect in the market: kids have switched from big devices on walls to small ones in hands, and advertisers have not been able to reach them effectively on those small devices. Meanwhile, kids app publishers had a different but related problem.
“We saw the frustration from advertisers on one side,” says Ben Tora. “They say ‘I want to reach kids, but I can’t really understand how,’ and we saw the publishers on the other side saying, ‘well, we have tons of kids using us, but we can’t really monetize.’ And we said okay, let’s just match those two together.”
Now with iOS 14.5 and SKAdNetwork, measuring monetization is possible. There isn’t the wealth of information that IDFA traditionally provided, no … but there’s also not a total gap. Publishers can see the revenue attached to new user acquisition, at least in the first few days, and that helps them make optimization decisions.
“So I think monetization is easier today,” says Ben Tora. “And the good side is that the budgets that are coming in from … the Lego’s and the Disney’s of the world are finally coming to mobile.”
Privacy regulations and measurement challenges actually kept significant kids’ brand budgets on TV, he adds, suggesting that they are now making the switch to where their audience is primarily moving.
“I’m a big believer in safe ads for kids and monetizing [your app with ads] and allowing your content to be free,” he says. “Because if you put up a paywall, then you’re actually saying to 90-95% of your user base: you can only enjoy a fraction of my app. And by opening it up through ads, you’re actually making it more accessible.”
Which is actually a good thing on the Android side as well, because Google sees that your engagement and retention is higher, and it gives app publishers higher Google Play store rankings.
Parents or kids: who makes the app install calls?
I had to ask Ben Tora one key question: who makes install decisions for kids? Is it the kids themselves, or the parents?
“I think the advertisers tend to understand that eventually kids decide,” he said. “The kids, they know what they want. They tell us what they want … if the parent is the one that decides on downloading the app, the usage will decrease immediately because he didn’t take the kid into account. So I think that now kid-focused advertising is becoming the norm.”
Bad news for parents? We’re not in charge anymore.
Good news for advertisers? They can safely reach the true decision makers in the family.
Learn more about kid-safe marketing measurement
Interested in learning more about Singular’s kid-safe marketing measurement and mobile attribution? Book some time with one of our experts. We’d love to chat about what you’re doing, what you need, and how we might be able to help.
And, subscribe to Growth Masterminds on your platform of choice:
Apple has announced significant new privacy and attribution features in a massive update of developer news at WWDC.
One that’s critical for app developers, publishers, and marketers: App Privacy Reports in iOS 15. Others that are extremely interesting is a new way of aggregating postbacks in SKAdNetwork, plus new privacy updates in Safari and Mail, Apple’s native Mac apps for browsing and emailing.
But perhaps the most significant is SKAdNetwork postback aggregation, which has the ability to dramatically impact how SANs (self-attributing networks) operate.
SKAdNetwork postback aggregation in iOS 15
One thing that always seemed odd to me about SKAdNetwork: postbacks were only sent to ad networks, which would then have to find a way to get it to advertisers. Most are reputable, and many use 307 temporary redirects to get the postbacks immediately to Singular as independent third-party verification and aggregation … but it still seemed weird.
Why not send postbacks to advertisers, who can then check their media sources’ homework?
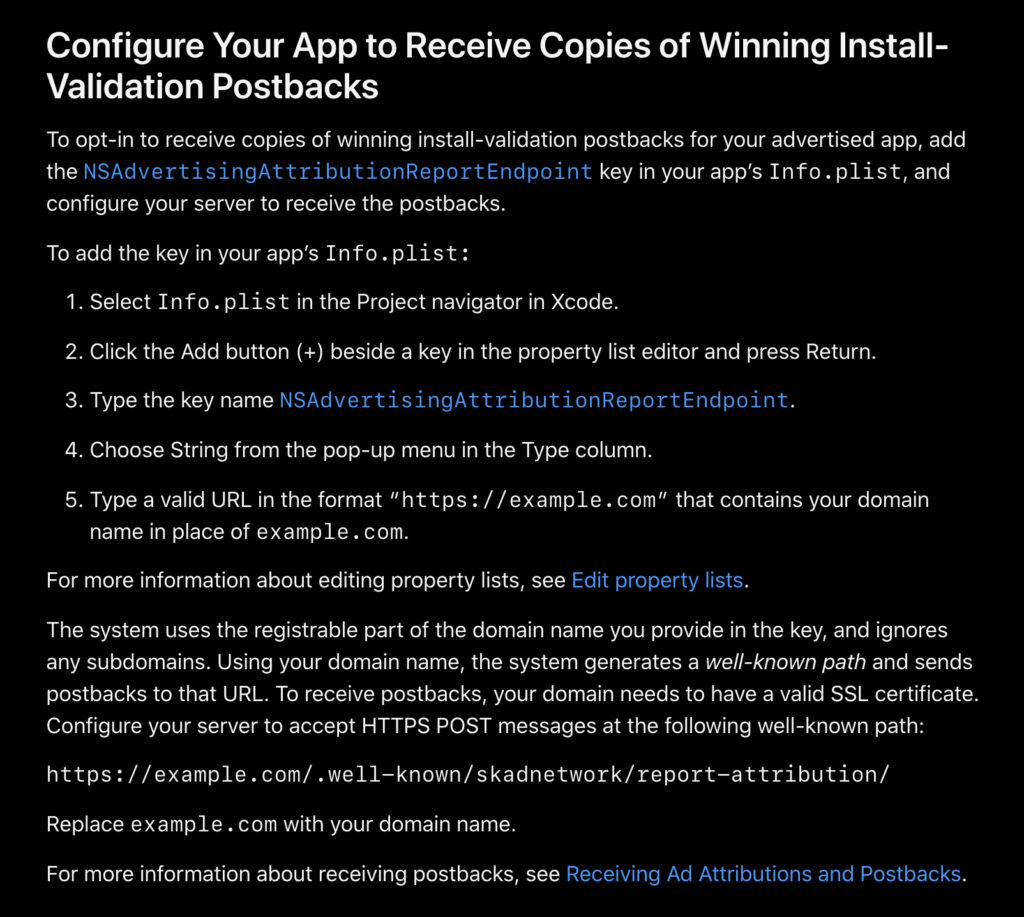
Starting in iOS 15, that’s exactly what Apple’s doing.
“Starting in iOS 15, devices can send a copy of the winning install-validation postback to the developer of the advertised app,” Apple says. “Developers opt-in to receive the postback by specifying a server endpoint in their app’s Info.plist.”
App publishers and marketers can now configure a single catch-all collection point to receive “a copy” of all SKAdNetwork postbacks for your app. In other words, your ad network is still getting a postback, but you’re getting one too. Superficially, that’s great: you can check your ad networks’ and media partners’ numbers. Singular, for instance, can be the aggregation point, interpret your conversion models, aggregate all your postbacks from all your partners and all your apps, and you can see everything all in one place.
But there’s something even more significant happening here.
Getting postback copies directly from Apple allows marketers to get more direct data than ever before on the results that SANs generate.
Self-attributing networks, of course, have always held tightly to their data, and rightly so. They have deep reservoirs of data about who does what with regards to ads on their platforms, and there are significant privacy implications for sharing that data. Now, while still anonymous, advertisers can directly check SANs’ homework for the very first time. SKAdNetwork is anonymized data, but it is also deterministic data. Once privacy thresholds are met, you’ll be able to see what happened from which partner for which app, regardless of who the partner was: small indie mobile ad network, or Facebook, or Google.
One important note: advertisers will get raw SKAdNetwork postbacks in iOS 15.
That means the conversion payload still needs to be decoded and enriched with data from the relevant ad networks and then displayed effectively so that marketers know both what they achieved and what to optimize in future campaigns.
(Singular, of course, does this already, and will continue to do it in iOS 15.)
App Privacy Reports
Apple has long had a privacy report in its Safari browser on desktop Macs that tells you what trackers are trying to follow you around websites, and how many trackers each site has. Tom’s Guide, by the way, has no less than 81 — at least how Apple defines trackers — while The Wall Street Journal has 76, and Bloomberg has 65.
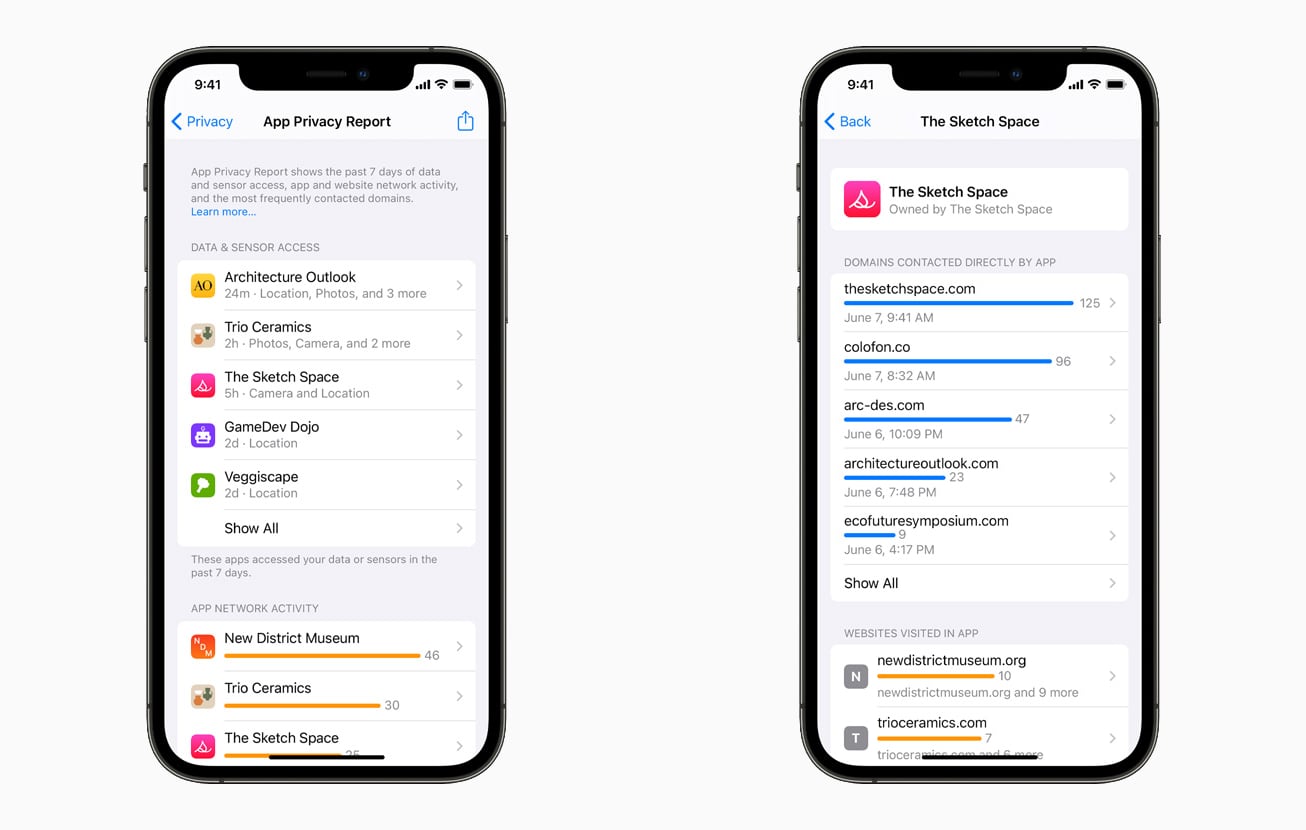
But soon iOS 15 will bring this kind of transparency to apps in an App Privacy Report:
“With App Privacy Report, users can see how often each app has used the permission they’ve previously granted to access their location, photos, camera, microphone, and contacts during the past seven days,” Apple says. “Users can also find out with whom their data may be shared by seeing all the third-party domains an app is contacting.”
In other words: there’s no more room to hide.
In iOS 14, app publishers had to provide a “nutrition label” privacy report when updating their apps. In iOS 15, people are going to get the opportunity to see for themselves if the nutrition label is accurate.
While most people may never dig down into their phone’s settings to check their App Privacy Reports, I guarantee you that some will. And if they don’t like what they see, uninstalls will follow. In addition, journalists will be trolling these reports for anything that looks fishy.
And more on privacy in Apple’s ecosystem
Apple’s Mail app on iOS 15 and Mac OS Monterey will block tracking pixels, stopping companies and people from knowing if the recipient of their emails opened it, and masking their locations. Safari’s ITP, Intelligent Tracking Prevention is growing new muscles and will be blocking IP addresses from trackers, making fingerprinting harder if not impossible.
In addition, Siri will be processing data on-device, and iCloud+ will come with a built-in VPN — as long as people use Safari and Mail — meaning that web traffic and email will essentially be invisible to marketers.
(Singular’s privacy-safe web-to-app measurement functionality will continue to work regularly given it is leveraging URL parameters, which Singular is using to tell marketers where an install came from and what campaign it’s part of. We don’t use any invisible pixels or other email tracking. Plus, of course, it’s all first-party data, not shared with anyone else.)
Change is the new normal
For mobile marketers who are just settling into SKAdNetwork now: yes, more change is coming. This is the industry we’re in, and change is not just the new normal, it’s our normal.
For now, however, take a deep breath.
iOS 15 was just announced. It won’t launch until the fall, probably in September. We have time to prepare, and we’ll use it. If you’d like to have a quick chat with a Singular expert about SKAdNetwork, privacy-safe attribution, and maybe even iOS 15, book some time here.
We’ve had a month with iOS 14.5. Time enough for at least some initial insights from mobile marketers and growth leaders about how it’s going, what’s working, and what’s still a complete minefield. (One of our recent guests used a slightly different term.)
We asked some of the best for their early reviews:
Jayne Peressini, Senior director, marketing & growth, EA
Paulo Esteves, Director of UA, Gameloft
Eran Friedman, CTO and co-founder, Singular
Phil Crosby, CPO and co-founder, Liftoff
Jayne and Paulo oversee millions in user acquisition and growth spend for global leading games and brands. Check out their thoughts, plans, and strategies in the full on-demand webinar here.
But we also had some questions during the live webinar that we could not answer in the time allocated. Here are those questions, along with answers.
iOS 14.5 aftermath: your questions answered
1. Can you explain more on “SKAN and MMP”?
SKAN is SKAdNetwork, Apple’s framework for privacy-safe deterministic attribution. MMP is an acronym for Mobile Measurement Partners, companies like Singular that have special access to major platforms like Facebook, Snap, Pinterest, Twitter, TikTok, and more to provide third-party measurement services.
2. Can you talk about the percentage of users who even allow apps to ask for consent?
We actually just published some data on that last week. A global average of 83% of people allow individual apps to ask for tracking permission.
We’re updating this at least every couple of weeks. Re-check the Singular blog regularly for new information.
3. Any feedback on PCM (private click measurement)? What kind of data is sent and when?
Private Click Measurement reports the kind of engagement (for example, a click), the source site and source ID, an “attribution” value for the website that wants to attribute incoming clicks, and some trigger data: a four-bit value that encodes up to 16 triggering events. PC also supports an eight-bit Campaign ID (values of 0-255).
Similarly to SKAdNetwork, the website postback/pixel is sent after a random timer of 24 to 48 hours.
This is currently app to web, not web to app. The Webkit team behind PCM says it’s interested in web to app, but hasn’t found a solution yet.
4. 19.4% of all iOS users have both seen and allowed tracking permission … what do you think users factor when giving consent?
In our latest data that’s now very slightly up to 19.7%. We’ll continue to monitor this over the next weeks and months.
Younger and older people are less likely; middle-aged most likely
Knowing and trusting the company asking for tracking permission is the most critical component of the decision
Also, however, education is key. People simply do not know what “tracking” for marketing measurement means, with many equating it to marketers knowing everything that they do online.
5. What does SKAdNetwork traffic look like? Have costs been impacted?
We’re between 60-80% SKAN-ready in terms of traffic, depending on who you talk to. We’re seeing a lot of fluctuation in CPMs as networks adjust to new methods of targeting, but there’s definitely been some spiking here and there.
6. We’re a B2C subscription app using app install campaigns. We currently measure our CAC:LTV ratio, with CAC being cost per paid subscriber. This will be pretty impossible for us as our 7-day free trial means we can’t set ‘trial convert’ as a conversion value. Has anyone navigated conversion events too far down the funnel for tracking via conversions? If so, what have you tried … what’s your strategy for alternative CPAs?
This is a really tough one.
Given that Apple is not going to change SKAdNetwork for this use case anytime soon, there are a number of options:
Shorten your trial period (which, of course, has implications for people who test your subscription plan and for conversion rates while using it. Some of those implications could be positive, though.
Choose channels that allow longer than 24-hour conversion periods so you’re not limited to one day of free trial.
Find good proxies for conversion to paid. The best time to test this was 12 months ago; the next best time is now. But … go back to your data over the past year(s) and look for indicators that correlate with successful conversion to paid. Then test marketing optimization based on those indicators.
Abandon deterministic measurement entirely and move to an incrementality model that takes in all your aggregated campaign and marketing output data and correlates it with trial launches and trial-to-paid conversions.
Not all of those options are easy or pleasant. My personal suggestion: find something in and around option three while working on long-term solutions in option four.
7. Can you speak to the percentage of inventory you’re seeing that is Do Not Track on iOS?
Our latest data on that is about 17.5%. See more details, including by country, here.
8. What is the privacy threshold right now?
No one outside of Apple knows the exact privacy thresholds. What we can say with confidence is that in late May, Apple significantly changed privacy thresholds so more data is available.
Short version: if you have campaigns with low numbers of installs — around 20-30 — you went from seeing maybe 10% of postbacks with conversion values to 80-90%.
9. Between SKAN data vs IDFA opt-in, which one is more accurate/reliable?
Tough question. This is dynamic and likely to change as time passes since on the one hand SKAN supports all iOS users regardless of their consent, but on the other hand not all publishers are SKAN-ready yet, and most of them don’t support view-through yet since it was just added in iOS14.5.
But as time goes by, SKAN is likely to become the more accurate source of truth as the number of Opt-In IDFA users decreases and SKAN’s coverage increases.
It’s important to note that SKAN postbacks go to ad networks, which then redirect them to MMPs like Singular. Singular aggregates all that data from all your partners in one place, checking it for accuracy and fraud.
Realistically, we know that SKAdNetwork underreports data, particularly for organic installs. Conversions may take longer than a week and never get reported. Web to app flows aren’t supported. Privacy thresholds will block some conversion data. Other limitations in SKAdNetwork may allow more installs to never become visible.
Ultimately, what you need from your mobile measurement partner is what Singular is doing: bringing together SKAdNetwork data, IDFA data from earlier iOS versions, and IDFA data from 14.5+ versions where people agree to tracking, and all your data from marketing campaigns … and build a comprehensive picture of inputs and outputs, paid and organic efforts as well as results, and provide an intelligent framework for optimization and allocation decisions.
10. How are you checking install amounts and conversion values reported by SKAdNetwork? Basically, what do you compare against what?
The key is to collect conversion postbacks from all the networks you are working with. The collection process is done differently for each network. Some networks share the raw postbacks, while other networks, like Facebook, only share them in aggregate via an API.
That’s why an SKAdNetwork aggregation solution like Singular is needed. Singular collects all the postbacks and then decodes conversion values back to meaningful events or revenue metrics, which enables performance analytics, comparing performance across channels and campaigns, and of course optimization.
11. Why not just assign one creative to one campaign in order to isolate the creative you’re looking to test? It’s probably more work but might replicate what you used to do.
That’s totally an option, and it’s one that some people are using.
But it comes with a significant downside: killing the ability of the network to run creative selection based on creative performance metrics like engagement and CVR. This means you as a marketer will run significantly longer cycles and do more work to figure out which creative works best. And of course, it’s harder on networks like Facebook, which only allow you to use nine of SKAdNetwork’s available campaigns.
(One of the reasons Facebook wants so many is to do creative optimization.)
Note:
Using tools like Singular’s Creative Analytics you will still be able to analyze the upper funnel performance per creative, like impressions and CVR, but you won’t be able to utilize SKAN for ROAS. For analyzing creative ROAS, you would need to run campaigns with a single creative or rely on cases where user-level data is provided like Android and iOS users who provide double ATT consent (on both the publisher and advertiser app).
12. Do we see any data on which apps/categories/developers see the higher opt-in rates?
Option rates generally seem to be in the 15-25% range, with the most common rate around 20%. We’re seeing some variation in verticals, but much of it is likely due to different rates of asking for ATT between verticals.
We’ll see more data on this over time.
13. For conversion values, is it better to track fewer/earlier funnel conversion events (so you can get SKAN back faster) versus deeper events that may take longer to get back?
Pretty much all of the data I’m seeing from top marketers suggests absolutely yes. Rovio is working on a three-day conversion cycle, and many others are defaulting to D1, thanks to how some of the major platforms require it.
14. How accurately are you receiving purchase conversions?
We haven’t run the data on this yet, but plan to. Two sources of leakage are privacy thresholds and conversions that occur after the SKAdNetwork postback.
Ultimately, to find that leakage, you’ll have to isolate campaigns, check the data you’re getting, compare it to actual results in your app from measured cohorts over time, and assign a multiplier.
15. How do you know which conversion settings are better?
16. How will these updates affect buying traffic based on CPA on iOS?
Put simply: they make it harder. There’s less data, delivered slower and at a lower granularity. They don’t make it impossible, but you’re going to have to work with SKAdNetwork and Singular to get the most out of the data you do get.
17. What is the future of Apple Ads as a channel?
That’s more for Apple to say than Singular. What we can say is that it’s been an extremely high-quality source for app installs in the past, and that is only likely to be more true in an SKAdNetwork reality.
Apple Search Ads, of course, does not use SKAN. Apple views data it collects on iPhone and iPad owners as first-party data, and therefore not something that is shared across companies and apps, and needing to be obfuscated via SKAdNetwork.
That gives Apple very precise targeting capabilities … and makes ASA-sourced installs generally very high quality.
18. Question for Jayne: What type of influencers are you looking at to push your titles? And how do you measure performance with influencers?
From Jayne Peressini: We look at influencers as an ecosystem. Top influencers are handled by our partnership and competitive gaming teams while mid and long-tail influencers are something we manage. It’s performance based just like the other channels we buy on. And similar to other channels, we look at trying to reduce overlap of influencers and their communities so we get as much reach and scale as possible. We measure on unique reach + ROAS.
Looking for more insight on iOS 14.5 and SKAdNetwork?
Singular was the first marketing measurement company to support SKAdNetwork, and we have the most comprehensive solution for growth professionals looking to boost their apps. Book some time with us today, and we’ll learn what your goals are, and outline how Singular can help you achieve them.
As we mentioned then, our goal was to regularly share data about this massive change so mobile marketers can get an industry-wide context for the app and company-specific numbers they are seeing.
Of course, as of May 27, there are some new wrinkles.
Apple has already released iOS 14.6, so we’re measuring both of those operating system versions, and we’ll add more as they come. In addition, we’re starting to see the emerging impact of SKAdNetwork’s inability to always correctly distinguish between organic and paid traffic. Also, we’ve added Brazil and Mexico to the data to get a better understanding of the LATAM impact of iOS 14.5.
Let’s jump into the data …
iOS 14.5 adoption rates: historically slow
iOS 14.5 and 14.6 adoption is historically slow for Apple mobile operating system releases. As of the end of May, only 21.6% of the devices that are installing apps in our key countries have upgraded. (That number is 24.3% globally, including data from other countries.)
On average, each country or region is up two to four percentage points over an additional two weeks of iOS 14.5 (and 14.6) being in the wild, on a 15-20% increase. The one difference: China went from very low adoption (under 8%) to near global average, for nearly 150% growth.
Big picture, however: this is incredibly slow adoption.
At this same point in time since release, iOS 14.4.2 was at nearly 70% adoption. 14.4 was over 70%, and 14.4.1 was on a nearly vertical curve to the same range when replaced by the next available version.
Why?
One theory is that Apple knows the ecosystem changes are going to be massive, and it’s slow-rolling the release to dampen the effect and spread it out over time so the industry has time to react, change, and adapt.
Maybe.
But Apple has had other mobile OS versions as well that it has released extremely slowly: 14.2 and 14.2.1. The speed at which Apple suggests a system upgrade to iPhone owners could potentially be impacted by an internal perceived stability of the OS, or Apple wanting more time to refine certain features. Which could make sense, given that 14.6 is already available (and live on my phone).
App Tracking Transparency visibility
As mobile marketers know, ATT isn’t even available to call for a certain percentage of devices: those with the global ad privacy setting off, or devices set up for children. That number matters, because it’s automatically outside the universe of possibility for advertising measurability via IDFA.
The four possibilities for App Tracking Transparency status are:
Restricted (marketers can’t ask for tracking permission)
Denied (marketers can ask and did, and users rejected permission)
Accepted (marketers can ask and did, and users said OK)
Not asked (marketers can ask but have not yet)
Except where otherwise noted, all of the data below is based on the first three categories: where marketers at least attempted to ask for ATT authorization.
Brazil and South Africa may be among the world’s least privacy-sensitive populations, given they’re both near 85% ATT potential visibility. Japan, Russia, and Canada are most privacy-conscious, with Japan the lowest of all.
The global average is 82.6%.
On the face of it, that’s actually pretty high. More than four out of five people globally who use iOS and have already upgraded to 14.5 or 14.6 can be asked for tracking permission. Importantly however, the only direction that number is likely to move is down: migration is likely to be to more privacy, not less, and something that feels important enough to dig around in your phone’s settings is probably going to be an urge to lock down rather than one to open up.
ATT denied and authorized percentages
Global restricted rates — those who will never see an App Tracking Transparency prompt — are 17.44%. That’s down slightly from the 19% of devices in the previous dataset, which might mean that early adopters are more likely to be privacy conscious. (Or more technical and aware of where the global setting to turn ATT off is.) But it’s too early to be definitive on that.
As of late May, ATT see-and-allow rates are very slightly up to a global average of 19.7% from 19.4%. Here’s the restricted, denied, and granted data in one table:
Ad spend on Android versus iOS: lower but stabilizing
Two weeks ago we noted that ad spend on iOS was down almost 25% while Android ad spend was up. That trend has basically solidified, at least for the current period, with iOS spend still down to 32.3% of total from February’s 39.6%.
It’s down just a hair more from the previous period, which was at 32.7%, but that’s very minor, and might now be representing a floor from which iOS ad spend will rebound, or at least stabilize.
It’s incredibly important to note, however, that we’re very early on in the transition to the new era of privacy on iOS. 75% of devices have yet to upgrade. If the slow-down in iOS spend is due to degraded measurability, it could get worse. If it’s due rather to slow adoption by all industry ecosystem players, it could rebound.
There are a few options to consider, including:
Ad spend is dropping out of iOS to nowhere
Ad spend is migrating from iOS to Android
Ad spend is migrating out of traditional app-to-app mobile marketing channels
If we look at total ad spend in our sample size for a clue, we see that in the last month total ad spend is down about 7% from February levels, and about 5% from immediately previous weeks. That’s interesting, but not definitive as there have always been seasonal shifts in ad spend — high in the end of year/beginning of year holiday season, lower in summer — and we don’t have enough data yet to prove a pattern.
(Also because there was some run-up in the pre-iOS 14.5 months as marketers got their last kicks at the IDFA can.)
Ultimately, it’s something that will bear attention in future data analyses.
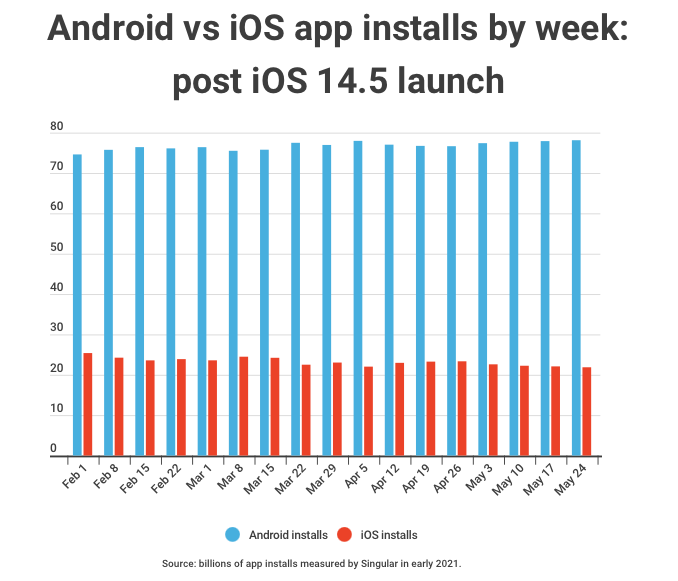
Percentage of installs on iOS versus Android since iOS 14.5
One thing we did not check last time was whether the percentage of overall installs might be shifting from iOS to Android since iOS 14.5 dropped. After all, more ad spend should indicate more activity on Android, presumably.
Ultimately, we see a slight but sustained increase in Android installs versus iOS as a percentage of all installs. And, of course, a concurrent, sustained decrease in iOS installs.
In February of 2021, iOS installs were 23-25% of all app installs Singular measured (prior data was a representative sample: this data is on all installs). Allowing for a slight reversion to near those numbers in early March, that percentage has slowly decreased to 21.9%.
Android’s concurrent rise, of course, has been from 74.6% to 78.1%.
It’s not a huge change, but it’s definitely significant. And it’s on a measured volume of installs in the billions, across the entire planet, so it’s unlikely to be a purely local phenomenon or glitch in the data. If this stabilizes or continues, it has impacts on where marketers focus their efforts, at least in traditional app install channels. As mentioned previously, with traditional digital user acquisition channels losing some degree of measurability, marketers may be looking to older (or newer) channels for at least some of their iOS growth.
Summing up: what we think we know, and what’s still challenging
We’re clearly seeing decreases in iOS ad spend and app install activity. What we don’t know is if those will continue, ameliorate, or get worse as the vast majority of iPhone and iPad owners upgrade over the next weeks and months.
Adoption is still very slow, and 14.5 is an unusual point release for Apple: not many are accompanied by global ad campaigns.
We also know and are starting to see that measuring organic versus paid installs is going to be more interesting. (By interesting, read: challenging.) Depending on privacy thresholds, actual conversions, as opposed to measured conversions (think: action taken in three days while your postback fires after one day, or purchases made five weeks later), web to app, flows that SKAdNetwork doesn’t know exist, and other shortcomings in SKAN, attribution on iOS is getting more difficult, and some things are getting missed.
Including separating out obviously organic from obviously paid acquisition.
There are solutions for this, and ways to work around it, but the reality remains.
Finally: help us help you
If you’re looking for help to keep the mobile growth ball rolling in privacy-safe environments including SKAdNetwork on iOS — and Android starting later this year, which is losing the GAID if people opt out of interest-based advertising or ads personalization.
That’s it. Nothing else to do. No long circuitous route from app to ad to app marketplace to your mobile device home screen to finding an icon somewhere on your app screens to tapping it and finally playing a game.
(And no Apple or Google rules about what you can or can’t do.)
Now.gg is a new cloud gaming startup launched by the team behind Bluestacks, which has 500 million gamers and is a Singular ROI Index honoree. Bluestacks is a mobile-games-on-the-web service, providing a place to play Android games on desktop computers. But Now.gg will allow any game developer to publish games for instant access on the cloud wherever they wish … and market them with a simple link.
No download required. And a million-plus Android games work on the platform with a few minor tweaks.
If cloud gaming is the future, Now.gg might be the platform that ungates mobile games from the iOS App Store and Android’s Google Play. Then again, Google Play and the App Store are fantastic places for many gaming publishers to monetize, and Now.gg can seamlessly transition cloud players to mobile app installers and long-term dedicated game players.
There is no shortage of companies rushing to cash in on cloud gaming. Google Stadia, Facebook Gaming, Amazon Luna, and Microsoft xCloud are just some of the big tech companies that are attacking the space and competing with PlayStation, GeForce, NVIDIA, Steam, and literally dozens of cloud gaming startups.
The promise is spectacular: play now, play anywhere, play on any device.
Where that promise has yet to be fully proven is great game-play, every time, without hiccups. Naturally, it’s getting better as bandwidth improves, 5G continues to roll out, and platforms get better. Some players, like Facebook, started with simple games that don’t require wide internet pipes for satisfying gaming.
Now.gg, however, sees cloud gaming as a different kind of opportunity: the ability to level the playing field on how powerful a mobile device you need to play a certain game.
“When we all started out as teenagers, maybe we didn’t have the best phones because that’s what mom and dad’s allowance got us,” says Ben Armstrong, a vice president at Now.gg. “But then as we find more and more games that we like to play and our phone quality increases … now we’ve got all this storage that is taken up with pictures and videos … so then we’re faced with, okay, do I delete all my pictures or do I play this game?”
In fact 40% of today’s mobile phones can’t handle the highest-end games and a full 60%, Now.gg says, are either low or mid-range phones that lack sufficient compute, storage, or both for performance-intensive games.
Cloud eliminates those challenges, of course. Load when needed, click away when finished. And, all the intensive compute operations happen on cloud-based servers, leaving the phone to simply display the action and receive gamers’ inputs.
Which brings up the biggest issue with cloud gaming, of course: latency.
“We have a global network of servers that enable you if you’re in South Korea to have a server that’s close to you in South Korea,” Armstrong says. “If you’re in Brazil, there’s a server close to you in Brazil. And that really helps out the latency.”
Listen to this story on Singular’s Growth Masterminds podcast
Cloud gaming changes mobile user acquisition for marketers
If the technology works as advertised, opening up cloud gaming for virtually every mobile game that matters is a game-changer for mobile marketers. And it has the potential to revolutionize how game publishers pursue user acquisition.
By now, mobile games user acquisition for iOS and Android is pretty much a known quantity. Where to buy ads, how to measure results, and what to do to optimize performance are not mysteries: while nothing about it is precisely easy, there are clear paths that winners have blazed to success. (Of course, there are always changes, and Apple’s iOS 14 and SKAdNetwork on iOS have changed the paradigm for iPhone and iPad games to a certain extent.)
But buying ads on mobile apps and directing traffic to Google Play and the App Store are significantly different propositions than marketing a web-based asset. In fact, marketing a web-based asset opens up a lot of opportunity for games marketers.
There are at least eight major game-changers when moving from mobile user acquisition to marketing a cloud-based game: some positive, and some negative.
1) No attention tax
Cloud games start instantly. That’s a major change to traditional mobile games, which require a certain amount of delayed gratification skills from users. As I mentioned off the top, downloading and installing a mobile game on either platform takes time, multiple steps, and multiple changes of context.
There’s a reason D1 retention for mobile games isn’t 100%: some apps never get opened.
Important note:
Of course, you could have similar issues with cloud gaming. If you have a huge game that requires significant local resources, that exacts a different kind of attention tax.
2) Cheaper traffic from a wider variety of sources
Installs are costly. It’s not easy to get people to take the step of installing software packages on their devices. Far harder, in fact, than getting them to visit a website (see #3 below). Therefore, costs are high: especially when there’s a lot of change on the iOS side of the ecosystem.
Web traffic is a lot cheaper, and there’s tens of millions of places that you can get it from.
3) Lower psychological cost
Related to that: clicking a link has low psychological cost than installing software. A web browser that is built for accessing multiple locations feels safer than apps, which are known to have a certain degree of malware, adware, and spyware.
That means getting someone to try your game can be easier. Click a link, play for a few seconds, and then you can make a decision about whether you like a game and want to play it frequently.
4) Increased viewability and measurability
Web advertising measurability has its own challenges, but also has well-known and established methods of measurement (that Singular supports), which help marketers make marketing optimization decisions.
5) Cross-platform applicability
Cloud gaming is incredibly versatile. While not all platforms work this way, cloud gaming should make devices almost irrelevant. In testing Now.gg games, for instance, I played a game on an iPhone 11 Pro, a ZTE Axon Android phone, and Mac Os.
Phone … desktop … everything just works. That’s greater market addressability and more flexibility for where your users/customers can play.
Important note:
If play anywhere matters to you, consider your user interface: how will it work on each of the major platforms and devices?
6) Influencer marketing becomes more actionable and trackable
Watch, click, play … and maybe even play along.
Influencer marketing for mobile user acquisition has been getting more measurable, but it’s always suffered from context displacement: leaving the environment where the influencer is … influencing … and getting the app. Now the app is a click away in a different tab or window. Instant gratification for the user, and embedded parameters making it measurable for the marketer.
7) Retention is even harder
Easy come, easy go is already one of the key rules of engagement for mobile app marketing. But when you can simply “uninstall” a game that has never actually been installed by just navigating away, retention becomes even more of a challenge.
Which is why …
8) Early gameplay and first impressions are huge
In the cloud, your game is a click away from being played. It’s also a click away from being forgotten. So a great first impression and fun, successful early gameplay are essential to set the hook and draw a first-time player into your game.
Tough gameplay, a long storyline, significant amounts of configuration, design of a ship, selection of weapons, or preparation to play are probably not great entry points for most players.
Pick the right game to be successful
Not every game that works on mobile will be successful on cloud gaming platforms.
There’s a huge amount of potential in cloud gaming, but that doesn’t guarantee success to anyone. Nor does it mean you should approach this opportunity by just relegating it to being a fine-we’ll-throw-our-games-there-just-to-see-what-happens opportunity. Throwing a game at a cloud gaming service just because it’s there is probably not a great option. You run the risk of wasting time and money. You also run brand risk: the risk that people see your logo and your game icon and associate it with something that’s less than awesome.
My guess?
Cloud games that succeed will be reasonably quick to load. They’ll also be simple to play on different devices and platforms. They’ll start with a bang — maybe with a dedicated cloud gaming entry point — and they’ll be super-smart about only loading what’s needed for gameplay when it’s needed.
And they’ll probably also be aligned to the strengths and weaknesses of the cloud gaming platform itself: degree of latency, ease of access, barriers to transitioning to other platforms, and so on.
The simple way to kick the tires on cloud gaming is to throw a title at it. The smart way is to pick one very carefully and thoughtfully, and consider spending a few dollars and a bit of time to make it a great native cloud experience … even if you ultimately want players to install your games at some point.
Reasons to try cloud gaming
The question, of course, for busy mobile publishers is obvious: Why should I dip my toes into cloud gaming? We’re busy doing what we’re doing, and we don’t have a ton of resources to jump on additional initiatives.
That’s likely true for most.
Putting aside the fact that Now.gg specifically is designed to take your Android APK with a very minimal amount of customization, dipping your toe in cloud gaming future proofs your company against changes in future platforms. That means changes on each major publishing platform, and it means change in general in the gaming industry away from native games on each platform and towards always-available, playable anywhere, instant-on gaming experiences.
That might be nebulous and futuristic for busy developers and marketers.
But there’s also a hard and tangible near-term benefit, at least in the way that Now.gg is set up: easy conversion of cloud gaming tire-kickers to mobile app installs. That’s potentially a very inexpensive means of user acquisition even in traditional mobile channels. Even better for marketers, advertisers will be able to attribute mobile app installs back to the original web source where the user clicked on the ad.
That’s huge, and gives you measurability all the way through the user journey. The result: you can optimize, tweak, and improve conversion rates.
And Singular’s deeply integrated with both Bluestacks and Now.gg to make all your user acquisition and growth tactics in those spaces measurable and optimizable.
The mobile marketing industry is just starting to try to get settled with the changes that iOS 14.5 brings to measurement. But we’re already seeing at least one significant undocumented change in SKAdNetwork in iOS 14.6, just out this week. And, concurrently, additional changes in how Apple is dealing with privacy thresholds.
I spent 15 minutes with Singular CTO Eran Friedman to get all the details …
iOS 14.6: IP addresses out of SKAdNetwork
The first change is an undocumented change in how SKAdNetwork functions with regard to IP addresses.
Here’s the original and still-documented flow: postbacks are sent to ad networks (and Singular, with 307 redirects) right from users’ devices (see bottom right).
But in iOS 14.6, that flow has a slight change. Instead of postbacks coming from the device, they first go to an Apple proxy server, which then forwards them to ad networks.
What’s the impact?
“First of all, it means you won’t be getting the device IP address in the SKAN postbacks, which essentially protects user privacy,” says Friedman. “Because previously you could think about how to do fingerprinting based on SKAN postbacks. So now that won’t be possible if anyone was even thinking about that approach.”
The effect goes deeper, however.
IP addresses also enabled geolocation, which gave advertisers a rough idea of what country, at least, an install was in. That won’t be possible anymore: advertisers who want it will need to encode it in their campaign IDs.
One benefit, however: fraud will be harder to accomplish with this new method. Apple still isn’t cryptographically signing the conversion values, but it is taking a more involved approach with the install postback, making fraud tougher.
SKAdNetwork: privacy thresholds relaxed
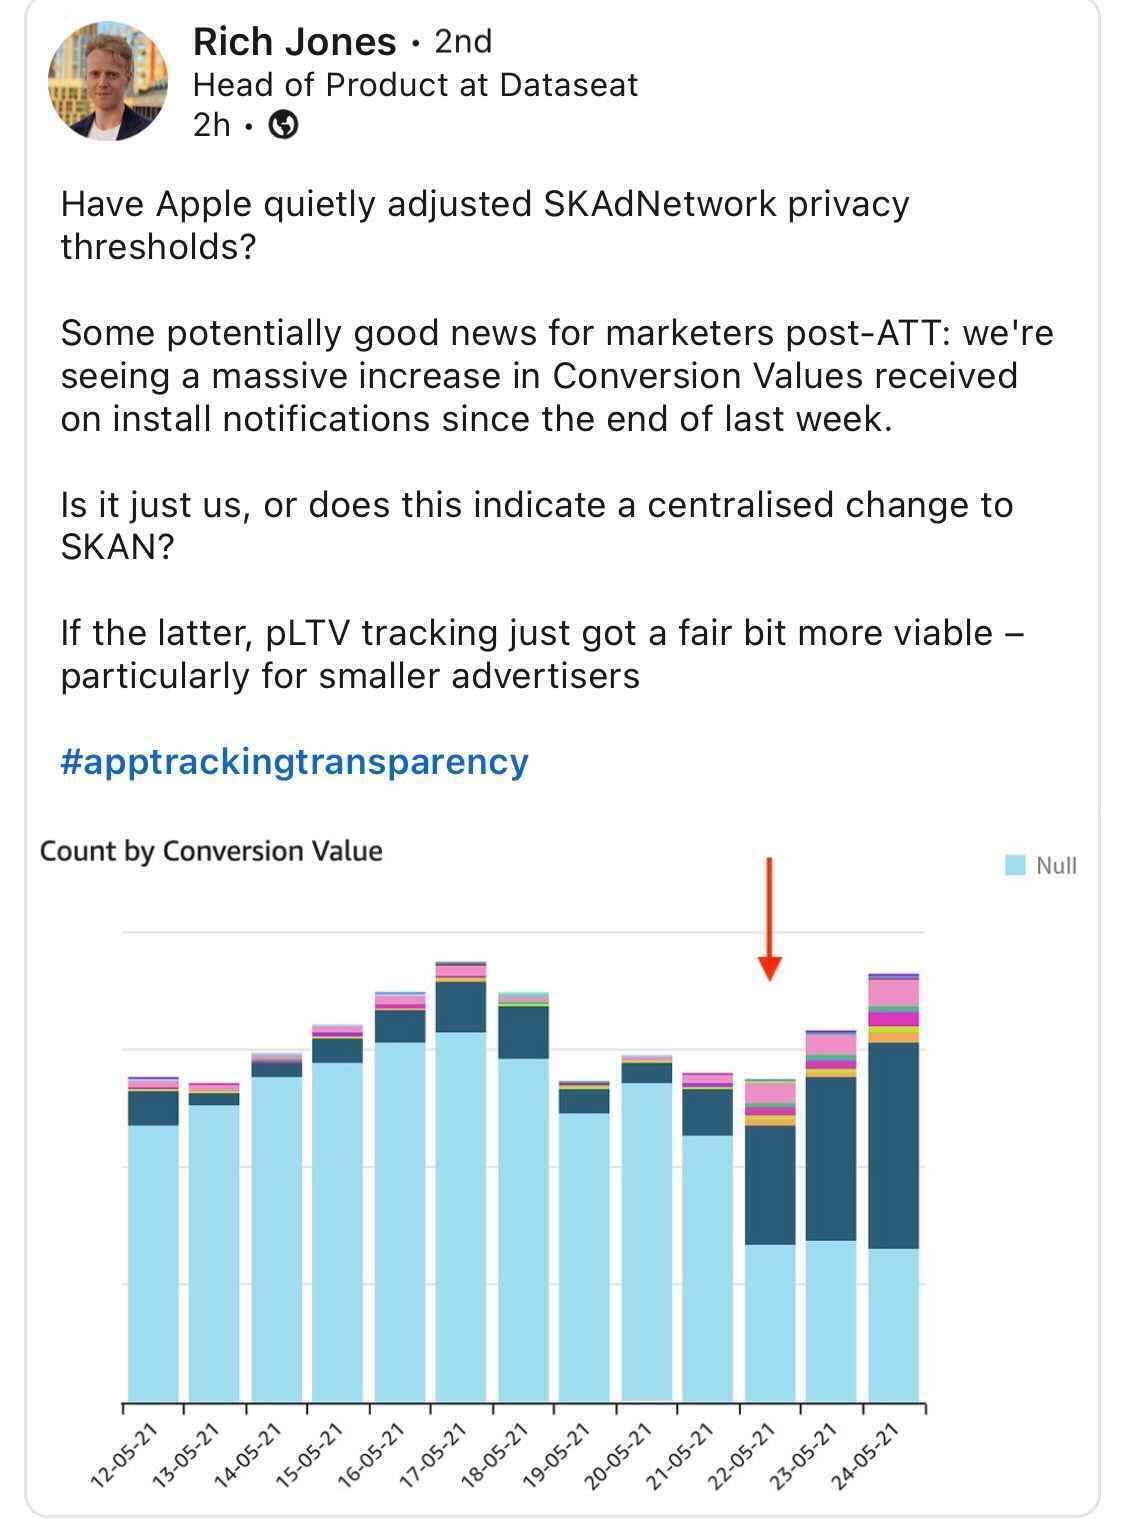
On May 21 Apple made another significant change to SKAdNetwork. This one is entirely backend and unrelated to the point version update of iOS.
As multiple people notice, more SKAdNetwork postbacks are coming with conversion value payloads.
“In short, it seems like they decreased those thresholds or fixed something in the thresholds, causing the advertisers to get many more conversion values than what we’ve been seeing before,” Friedman says. “And we see it across ad networks across advertisers … definitely a pretty significant phenomenon that started just a few days ago.”
The challenge had been primarily with app advertisers who had fairly low install volume per campaign: something like 20 or 30 installs a day. Friedman dug pretty deeply into the data, and those advertisers are now seeing much more post-install conversion data.
“If you have higher than let’s say 20-30 sales per day … then we see that the change is pretty significant,” Friedman says. “We saw that some campaigns changed from getting 20% conversion values — very low numbers — to 80 or 90% conversion values. So pretty dramatic.”
That’s a big deal, because if you’re subdividing app installs into multiple campaigns to use the full available power (if I can use that term) of SKAdNetwork to encode creative data, geodata, campaign data, or other optimization insights, you’ve been losing the ability to get conversion data.
Now that’s changed, and you’re able to get full conversion information even from relatively low-volume campaigns.
WWDC: What’s next from Apple in SKAdNetwork?
Apple’s Worldwide Developer Conference is coming very soon, on June 7. If there are additional changes to the SKAdNetwork framework, that’s likely where we’ll hear about them.
If Apple does add anything, web to app flows would be nice, Friedman says.
“I think web to app is a big one,” he says. “A lot of the web networks can’t get SKAN postbacks at the moment and I think that if they would announce that something like that, that will be huge.”
Also on the wish list?
Creative granularity.
SKAdNetwork help
If you’re looking for help to implement or optimize SKAdNetwork, chat with a Singular rep. We’ve worked with the best, including Rovio, to help companies maximize advertising optimization capability on iOS 14 and beyond.
Mastercard is a global enterprise with a market cap of over $350 billion, tens of millions of merchants, and $6.5 trillion in annual payment volume. This is a very significant company. You would expect the chief marketing officer to be similarly impressive.
And you would not be disappointed.
Raja Rajamannar is an MBA with a history of executive leadership at Citi, Diners Club, Humana, and WellPoint, and a bucketful of directorships. He’s been the chief marketing and communications officer for Mastercard for eight years, and is also the president of Mastercard’s health care business unit.
He’s also what I call a “push play” podcast guest. In other words, push play, and out flows relevant, structured, and digestible awesomeness. (There have been literally five or six guests like this in my podcasting career.)
Here are six things I learned from Mastercard’s CMO:
1) Forecast for the unthinkable
Can you imagine being prepared for the first global pandemic since 1918?
“Three and a half years back, I put in place what they call a risk management function within marketing,” Rajamannar told me. “And they look at all the risks that marketing faces from cyber threats to data security risks, to privacy risks, to brand disintermediation risk, financial risk, everything across the board, and then put plans in place to either avoid those risks from materializing or if the risks do materialize, to do something very quickly about it. And one of those risks we forecast at the time three and a half years back was probably there’ll be some natural calamity or a manmade disaster, because of which people will not be able to go outside their homes. So that was a fortuitous forecast I would say, though unfortunately, it has materialized, and so we actually had our contingency plans and the building blocks in place. So when COVID hit us … we could actually quickly cut over to our contingency plans without missing a beat.”
Now, granted, Mastercard has a lot of resources at its disposal, and can probably prepare for things that perhaps your 7-person marketing team can’t. And maybe you can’t prepare for the zombie apocalypse, or global collapse due to impending gigantic meteorite impact.
But just maybe, the principle holds, and there are micro “pandemics” that could hit your app’s niche, or the platform you target most, or your specific userbase … and having even a draft contingency plan in place would help when the unexpected but not impossible happens.
2) Diversify your advertising
As mobile performance marketers learned painfully over the past year and are experiencing live at this very moment, things change. The way that worked before is not guaranteed to be the way that will work in the future, and the advertising identifier that sits at the center of your data-driven growth machine is not certain to remain.
In fact, you could argue that the history of technology and marketing over the past few decades declares precisely the opposite: things are guaranteed to change.
“About seven years back, we started moving a lot of our budget away from traditional advertising into experiential marketing and into influencer marketing,” Rajamannar says. “Advertising has become extremely crowded and people hate advertisements. They’re [using] ad blockers at scale … and are going in droves to ad-free environments like Netflix and Amazon Prime … so where there are lots of hours consumed, our people are spending tons and tons of hours in front of those, in those channels where we cannot put advertisements. So it’s a narrower inventory of attention, humongous amount of clutter, and reduced span of attention of people … so we have moved a lot of money away from traditional advertising into experiential marketing, where you are not telling stories, but you are helping consumers make stories by giving them experiences that money cannot buy.”
The reality is that we are moving into the age of privacy-first marketing. Kicking and screaming, perhaps. And not without established players making moves to preach privacy while instituting targeting methodologies that privilege their existing positions, sure.
But privacy first, nevertheless.
That’s a good opportunity to reconsider channels and partners. To look at advertising and marketing methods you wouldn’t necessarily have picked pre-iOS 14.5, and re-examine what might work. Low tech doesn’t necessarily mean low effectiveness, as Mixtiles has discovered, and everything is measurable given the right technology.
3) Hire for IQ + EQ + DQ
We want smart people when we hire. We also want people who can effectively work with others: listening, understanding, communicating, and activating.
That’s IQ + EQ, or emotional intelligence.
Rajamannar suggests that marketing leaders also hire for DQ: decency quotient. The need for this has become painfully obvious in the past year as we’ve seen executive after executive felled by untimely comments, unkind words, or imperfectly hidden prejudices.
“We keep talking about when you are selecting candidates that they should be very intelligent, that they should have learning agility,” Rajamannar says. “They should have the right attitude, and they should have the cultural fit and they should have interpersonal relationships and all those kinds of things … essentially IQ as intelligence quotient and emotional quotient as in EQ. So these are the two we keep talking about, but when you talk of culture and if you want to create a culture, which is based on people being real, people being decent … we don’t want people to stand on other people’s dead bodies and then sort of keep rising and play politics. That kind of a thing is not really a place where you attract the best of the talent and you keep the best talent out there.
When Covid hit, Mastercard’s CEO told the company that he didn’t know what was going to happen, but that no-one would lose their jobs. That settled everyone’s nerves and gave them the quiet confidence to work through the storm of 2020 and the ongoing trials of 2021.
That’s DQ: decency quotient.
And that’s something that becomes visible outside the company to customers and prospects as well. For those worried about the costs … imagine the costs of becoming internationally known as a company that does not have values and standards. It can literally break a brand.
4) Build da Vinci marketing teams
The marketing of the future is one of those rare disciplines that will call for extreme right-brain creativity and innovation at the same time as high-end left-brain analysis and computation.
In other words: melding the left brain and right brain together.
“If you look at the traditional marketers, they have come from the qualitative side of the house, which means they’re very creative, they’re intuitive,” Rajamannar says. “Their appreciation and sensibilities around aesthetics is fantastic. Right? And that’s how they come up with beautiful ads and beautiful communication and wonderful packaging … now, on the other hand, when you look at the new ways of doing marketing, it is heavily technology driven. It is data driven. It is analysis driven and that kind of approach, or need is through the left brain. The left brain actually is the part which processes these kind of things, the data, the numbers, the analytics, and so on and so forth.”
You simply can’t market at scale without technology today, he adds. That’s true of both traditionally performance marketing and traditionally brand marketing.
Leonardo da Vinci was known for both being an artist and a scientist. He painted probably the most famous painting in history, the Mona Lisa, and was the first to formulate the laws of friction, as well as invent the concept of the helicopter, the parachute (presumably to be used when the helicopter failed) and numerous other machines. (And he was also, few remember, at one time employed as an engineer.)
Da Vinci marketers can at once create and analyze. Invent and refine.
“To survive and thrive, you need left-brain thinking,” Rajamannar says. “And in future, in addition to left-brain thinking, you also have to be immensely right brained.”
The challenge, of course, is finding both in the same individual. That’s rare, something that Rajamannar acknowledges. The solution is to build in aggregate what you cannot find in isolation, and grow a team of marketers that collectively embody both mindsets.
5) Build trust into every customer experience
Rajamannar has said that the concept of “brand” needs rebranding.
Interestingly, when you come right down to it, the difference between a brand that wins and a brand that loses is generally trust: do you trust that the brand you’re selecting will deliver on its promise? Will offer the service or functionality that you’re seeking? Will provide an experience or product that meets expectations?
Marketers have some make-up work to do here.
“Trust is very critical,” Rajamannar says. “Marketers have been consistently breaking that trust, unfortunately, and that’s what has landed us in this place … when all the products will look similar in functionality and capabilities, with the impending technological transformation and tsunami that is going to happen … the one big differentiator from brand to brand will be trust: is this brand trustworthy? Are they doing good by society? Are they doing good by me as a consumer? Are they respecting my privacy? Are they deceiving me or are they being transparent? Even if they’re at a disadvantage, are they being transparent?”
People remember when trust is broken, and every time that happens, trust dies just a little bit more. In our modern social-media-is-the-ultimate-water-cooler world, it’s not just one person you have to worry about. How you treat the one is how the many might see you.
My son recently had a 4-month old tire blow up on the freeway, and when I posted about it on Facebook, a friend said he would never buy that brand again.
That’s for as potentially major items as tire safety and vehicular accidents to as seemingly minor details as the packaging for your snack is 3X bigger than it needs to be, essentially tricking customers into thinking they’re getting more than they actually are.
Or when your app marketing promises a particular functionality, only for installers to find that they need to buy a subscription to make it usable.
“You have to shift your focus to more long term as opposed to how can I maximize my sales for today, for this month, for this quarter,” Rajamannar says.
Serving and selling are not mutually exclusive, he adds. And here’s where the more performance-minded marketers need to listen to the more brand-focused marketers and built middle ground.
6) Redefine “customer” loyalty
Marketing communities spend hundreds of billions of dollars annually on loyalty programs, Rajamannar says. But in an age when more than half of people in long-term committed relationships admit to cheating on their partners … what does loyalty mean?
Perhaps we have it backwards when we talk about customer loyalty.
“We as brands rate so low in people’s hierarchy of needs and hierarchy of things that matter. Why would they be loyal to us?” Rajamannar says. “It is the brand which should be loyal to the consumers, not the other way around. And if you ask consumers, that’s exactly what they’ll say. So I think we got loyalty wrong … we expect that we are running loyalty programs to enable consumers to be loyal to us, but loyalty cannot be bought.”
Now there’s a thought grenade.
Customer loyalty is a brand being loyal to its customers by doing what it says it will. By privileging their experience over an extra dime or two. By making decisions that benefit customers, not just your app, your subscription service, or the metrics your boss will review in the morning.
The future of marketing
The future of marketing contains a lot of technology. It isn’t technology itself. At heart is a very old mindset that puts customers or “users” first, focuses on brand, delivers on implicit and explicit promises, and combines qualitative and quantitative thinking.
Sure, maybe that’s easier to do when you have billions in revenue and massive market share. But just maybe that’s how some of the biggest companies of our time became that way in the first place.