In 2025, creative fatigue is still one of the biggest threats to campaign performance.
No matter how compelling your ad creative is, audiences will tune it out at some point. And today’s sophisticated ad platforms, whether it’s Meta, Google, or TikTok, aren’t waiting for your CTR to drop before moving your creative to the sidelines. Their algorithms are designed to sense stagnation, and they’ll respond before you even realize there’s an issue.
That’s why many of the teams we work with are treating creative performance as a key growth lever versus a downstream design function. They build processes and tech around creative ideation, testing, tagging, analysis, and refresh.
These marketers and develoeprs use platforms like Singular to do it faster, smarter, and at scale.
Creative is your edge – if you can keep it fresh
The smartest mobile marketers don’t just track creatives; they engineer pipelines around them. In-house design teams collaborate with UA and lifecycle marketers, sharing metrics in regular sprint reviews.
Together, they evaluate performance across platforms and regions, identify winning concepts, and kill underperformers fast. More mature organizations tend to group creative assets by concept, format, or theme, using naming conventions and metadata to analyze at scale.
With thousands of variations across channels, this level of creative tagging and clustering is essential. It’s also built into Singular’s creative optimization suite.
So, how often should you refresh ad creatives?
Ask 10 marketers, get 10 answers. Some refresh weekly, some monthly. Others can only add new creatives when their design team can squeeze it in.
The truth is that there’s no one-size-fits-all answer.
The optimal creative refresh rate depends on factors like:
Creative type (videos vs. statics vs. playables)
Channel algorithm behavior (e.g., Meta vs. TikTok vs. Unity)
Campaign budget and bid strategy
Audience saturation speed
Geo and cultural relevance
Still, there is a practical framework you can follow to assess creative fatigue and optimize your refresh cadence.
A quick way to analyze creative fatigue
We’ve seen our partners use this simple and lightweight method to monitor performance trends and spot signs of creative fatigue before it’s too late.
Cadence
Weekly or bi-weekly
Data input
Creative asset performance from all channels (Singular does that out of the box: check out our API)
Campaign targeting option data, particularly around the major self-attributing networks, to identify targeting methodology (value optimization, bid optimization, etc. …)
Channel, country, region, plus any other breakdowns that makes sense to you
Four weeks of data
Period A: first 2 weeks of data
Period B: second 2 weeks of data
Two simple data outputs
Check the trend of currently running creatives to detect big drops that might suggest these creatives should be cycled.
The drops could be in clicks, installs, eCPM, or any other metrics that make sense
For customers using Singular’s attribution, we enable ROI granularity all the way down to the creative level, so you can check for a drop in your main KPI (which is often what the ad engines optimize against)
Isolate the creatives that did not exist in Period A, but existed in Period B, and identify how they are trending. Learn from new concepts that are succeeding well, and some that are failing to ramp up.
One example:
Creative
Period A
Period B
CTR
Conversions
eCPM
CTR
Conversions
eCPM
Creative 1
3%
7,500
$9.50
1.5%
3,300
$11.75
Creative 2
n/a
n/a
n/a
3.5%
15,000
$11
Creative 3
n/a
n/a
n/a
1.5%
3,400
$9
Creative 4
1%
2,200
$3.40
2.3%
4,300
$4.23
What is creative fatigue and what does the behavior really look like?
Contrary to popular belief, creative fatigue is evidenced by more than just a steady decline in CTR over time.
That’s not always how it works, especially on platforms with smart delivery algorithms like Meta. These systems throttle impressions before performance visibly declines, reducing exposure to ads that may have hit saturation.
That means your CTR might look fine when, in fact, your ad impressions are quietly plummeting.
In other cases, algorithms might raise your bids in order to force delivery of your higher-performing creatives, resulting in higher CPMs and lower ROAS without obvious creative underperformance. The result is that what looks like a stable creative may actually be a liability.
Other signs of creative fatigue (and why they matter)
You might also see these signals:
CTRs are flat, yet CPMs are rising? This is a symptom of a platform working harder to show your ad.
Impression is spiking, but engagement is starting to drop off? A bid or budget change may have unlocked more inventory, but not necessarily better audiences.
Audience overlap has increased? If you’re hitting the same users too often, conversion rates may plummet.
These problems aren’t the result of targeting issues or channel quality. They are the less obvious symptoms of creative fatigue.
Diagnosing creative fatigue is hard. Singular makes it easier.
Singular has always offered you the ability to analyze campaign performance. But our newest solution, Creative IQ, makes it easy to analyze performance at the creative level.
With Creative IQ, you can:
See ROI and ROAS by creative asset across all channels
Visualize trends and drops across time
Identify saturation and fatigue patterns before they impact performance
Use insights to brief design on new variations that align with top-performing concepts
Ultimately, the takeaway here is that creative fatigue is real, but with the right tools and processes, it doesn’t have to kill your campaign performance. With a keen eye and solid preparation, you may just be able to stay ahead of it – and keep ahead of your KPIs.
Want to see how Singular can help your team get ahead of fatigue?
Tighter privacy rules and disappearing device IDs have already rewritten mobile measurement. Google’s Integrated Conversion Measurement (ICM) pushes that transformation into overdrive. At Singular, we see Integrated Conversion Measurement as both evidence and catalyst of a broader reality: ID‑level attribution is giving way to privacy‑first, modeled measurement. Marketers who adapt now will compound learning and growth while everyone else plays catch‑up.
What is Google’s Integrated Conversion Measurement?
Integrated Conversion Measurement provides more real-time, comprehensive, and accurate attribution for your Google App campaigns in your third-party App Attribution Partner interfaces. It incorporates innovative technologies, such as on-device conversion measurement using event data, to improve measurement accuracy, all without compromising user privacy. The result is event‑level insight even when user‑level identifiers are missing.
It covers:
iOS 14.5+ users who declined App Tracking Transparency (ATT).
Android users in the European Economic Area (EEA).
Because Integrated Conversion Measurement feeds data through Google Ads directly into Mobile Measurement Partners (MMPs), you can surface richer conversion details without ripping up your stack.
Why Integrated Conversion Measurement deserves your attention
Wider Device Coverage
Integrated Conversion Measurement injects fresh event‑level signals from both Android and iOS where data used to be dark.
Privacy‑First On-Device-Measurement
Signals stay on‑device until aggregated, so you gain accuracy while upholding platform and regulatory standards.
Fast Enablement
If you’re already integrated with an Integrated Conversion Measurement‑ready MMP (that’s us), turning it on takes minutes…not months.
Singular and Integrated Conversion Measurement
Integrated Conversion Measurement will be available directly in your Singular dashboard.
Our advanced data analytics and optimization will feed Integrated Conversion Measurement signals into probabilistic and cross-device attribution, giving you even more granular insight and reporting; letting marketing teams act while competitors still refresh dashboards.
In June 2025, Integrated Conversion Measurement will be available directly in your Singular dashboard on iOS and Android.
To enable on iOS:
Implement on-device conversion measurement using event data, available June 2025 via the Google Analytics for Firebase iOS SDK v11.14.0+, or GoogleAdsOnDeviceConversion SDK (available via CocoaPods or Swift Package Manager).
Update to Singular iOS SDK version 12.7.0 or later.
Ensure the “Include Integrated Conversion Measurement Attributions” option is enabled in the Singular partner configuration for Google Ads (available June 2025).
To enable on Android:
Ensure the “Include Integrated Conversion Measurement Attributions” option is enabled in the Singular partner configuration for Google Ads (available June 2025).
Closing thoughts
Perfect data is a myth, but responsive, privacy‑aligned insight is a competitive moat. Google’s Integrated Conversion Measurement proves that attribution isn’t disappearing, it’s evolving.
With Singular, you can harness every new signal, optimize faster, and keep winning as the measurement chapter turns. Get in touch with a Singular representative to learn more about Integrated Conversion Measurement, and how Singular can deliver you smarter insights and faster growth.
Pebbles on a rocky beach are granular. The white sugar that we all hate to love is granular. The stars of the Milky Way that smudge together into a glorious sheet of light are, under closer inspection by a powerful telescope, also granular.
And so is the very best of digital and mobile marketing.
Why?
“Granularity sustains profitable scale,” says Singular’s Vice President of Customer Strategy Victor Savath. “Without granularity, you can scale… but it’s hard to monitor quality.”
Granularity is important both cross-channel and within channels, Savath said recently at UNIFY conference, where he interviewed experts from Yelp, Kabam, Postmates, Nexon, and N3twork on the topic. It’s important for creative. Granularity is also important for bids and CPIs. It’s critical to evaluating publishers and sub-publishers. And it’s something that impacts your daily budgets.
But exactly what is granularity?
And what does it achieve for digital marketers?
And … how has the concept of granularity changed with iOS 14.5 and SKAdNetwork?
Granularity in digital marketing can be defined as the ability to dissect big blocky chunks of marketing activity and ad buys to see the smaller building blocks. For example:
If your ad campaign is spread over 15 different agencies, you can view each one individually
If each agency uses multiple ad networks, you can see how each is performing
If each ad network employs different publishers and sub-publishers in your campaign, you can dive into sub-publisher metrics
If you’re using varying creatives and forms of targeting, you can see how each performs
As users or customers engage, you can see their journey and react personally to their preferences and needs
As you can see in the video from UNIFY, experts from top mobile companies had a lot to say about the concept of granularity. Here are eight things they highlighted:
1. Granularity tells you how to maximize channels
Clearly, seeing which ad network or publisher is providing the best results is a good thing. But it’s sometimes even more important to really understand what’s working within a network or publisher.
“Obviously Facebook is the biggest social channel, but Pinterest, which is often overlooked, is an interesting play,” says Yelp’s Head of Performance, Eyal Grundstein.
The key to unlocking performance for Yelp on Pinterest was experimentation… and granularity.
Initial generic campaigns produced generic results, but when Yelp started targeting “odd things” like nail salons, click-through rates jumped 5X. Another finding: tattoos are huge on Pinterest, because people search for tattoos that they’ll consider. Targeting on tattoos and showing tattoos in the ads boosting conversions 10X.
“You can be granular not only in the targeting but also in the copy,” Grundstein says.
2. Granularity tells you which publishers are performing
Most ad networks fulfill impressions and conversions for their clients by purchasing inventory from publishers or sub-publishers. When this happens, sometimes advertisers lose the ability to optimize for maximum performance because they either lack the capability or are not looking below the top line campaign numbers to the sub-publisher results.
Hint: some will be rock stars; some will be duds.
“We have a two to three times per week process of pruning out the low performers,” says Eric Seufert, Platform at N3twork. “We kill them at the line-item level if they’re not performing.”
That process does vary from week to week, Seufert says, as publishers change. There’s some natural variance between good, acceptable, and bad, so some level of discretion is warranted. Still, the overall learning remains: advertisers need to be able to probe down to sub-publisher levels to really fine-tune performance.
3. Granularity helps you avoid ad fraud
Granularity is table stakes for avoiding fraud, says Grundstein. Impression-level data, for instance, is an absolute must.
It’s also a way to tie the technicalities of adtech to the ground-truth realities of customers, users, and your product. And there’s no better way, says Warren Woodward, Nexon’s Executive Director of User Acquisition, to really see what’s going on.
“Show me this ad in the wild,” Woodward will often ask his ad partners. “It’s amazing how many sources break down when you ask them… where is your traffic? Can you show it to me?”
And, just as source-level data allows you to pinpoint top performers, it also allows you to isolate potential fraud. Especially when you explicitly state your goalposts in the ad insertion order:
“This game that usually has a 90% tutorial completion… if we see a source as over ‘x’ number of installs and [it] deviates from that norm by over 50%… we’re going to consider that incentivized or some other type of fraud,” says Woodward.
4. Granularity helps you avoid bidding against yourself for adspace
Granularity on the publisher level helps us to “strategize and understand where not to overbid or bid against yourself,” says Yelp’s Head of Performance, Eyal Grundstein. “For example, if you’re buying on two different DSPs and they’re both buying on Mopub… they will bid up against each other potentially, especially on a particular placement if there is enough volume or if it is relevant enough.”
In other words, the ad space is complex and busy. And if you’re a significant advertiser, you’re probably using anywhere from ten to over a hundred advertising partners, which means you could potentially have campaign collisions.
There’s only one thing less cool than ad fraud, and that’s bidding against yourself.
5. Granularity helps you customize to different geographies
Country and regional level data is critical when marketing, says Kabam’s Director of User Acquisition, Andy Park.
“How people consume media across geos is different,” Park says, noting that people in China like to like and comment on ads, particularly on Tiktok, the country’s top video platform. “[One] ad got 37,000 likes and 600 comments in two days.”
Creatives come in many different sizes, shapes, and user experiences, Park says. The key is being able to present different creatives to different audiences, and react appropriately depending on which ones work.
This also enables regional targeting, says Postmates’ Director of User Acquisition Patrick Witham.
“We operate city-level targeting,” Witham says, while noting that there are some limitations with ad network data for geotargeting.
Separating campaigns for different geographies can also make overall campaign analytics more challenging, he added, and does put some limits on scale. However, tighter targeting almost always leads to better results, and “specificity drives conversions.”
6. Granularity allows you to “try wild things” and still be successful
Some of the best things you’ll do in marketing are crazy.
At least, at first glance.
“Our approach has been to build tools that allow us to be radically experimental,” says N3twork’s Seufert. “We’re building about 50 videos a week… we deploy them to test and then deploy more universally.”
Some of those videos are going to be incredible. Some are going to be horrible. But by building the engine to enable creativity at scale and fast failure, N3twork is opening itself up to those rare oddball explosions of lightning in a bottle that drive mass conversions.
Nexon’s Woodward agrees.
“Try wild things,” he says. “You want something that’s going to stand out… when you have a completely different experience, it’ll be the biggest winner or a complete loser.”
One example for Nexon was an ad that featured almost no gameplay — an extreme rarity in the mobile game ad world. Instead, it simply showed fans talking about the game. Essentially, it broke every rule… and it was the company’s biggest winner.
“It carried about a quarter of our user acquisition,” says Woodward.
7. Granularity helps you avoid poorly performing genres of publishers
Sometimes you want to avoid one publisher in particular. Sometimes, though, you want to avoid an entire genre of publishers.
That’s exactly the scenario that Kabam’s Park found himself in (watch the video for full details… including precisely what he was trying to avoid.
Some things just don’t work for your company, your brand, your product, or your app. And granularity enables you to avoid them.
8. Granularity helps you test creative versus creative
Every marketer wants to know which ad units are performing. That’s table stakes… and yet also an example of granularity.
Smart marketers also want to know their conversions from different creative types: banner, text, interstitial, video… and playable ad. You just might be surprised at what you find.
For example, playable ads doubled Nexon’s app installs from one particular source, says Executive Director of User Acquisition Warren Woodward.
“Now we’re making as many playables as possible,” Woodward says. “If you’re not games, think about other ways you can make interactive ad units. The rest of us are… you won’t be in the game if you’re not.”
But what about iOS 14.5 and SKAdNetwork?
Old-school mobile marketing relied on granular device-level data to get detailed data on impressions, clicks, installs, and post-install activity, and on iOS that is no longer all relevant. (For now Android is business as usual.) On devices running iOS 14.5 and later (which is now almost all devices) you can only get that level of data if people opt in to tracking … which you can only know after they install your app.
For that reason — and the fact that 75-85% of people are not allowing tracking via the App Tracking Transparency pop-up — your best source of data arrives via Apple’s SKAdNetwork data.
The good news for mobile marketers: it’s deterministic.
The bad news: it’s incomplete by design, it arrives at variable times, it’s adopted with different practices and policies across different ad networks, and it’s explicitly not device level in order to be privacy-safe.
This doesn’t mean marketing optimization on iOS is over. It does mean that mobile growth marketers need to use new ways of measuring advertising and marketing success and learn to be comfortable with a certain missing layer of granularity. However, using Singular SKAN, marketers can still get good, usable, reliable data on which to base marketing optimization tactics.
Summing up
Granularity isn’t just a nice-to-have. It’s an incredibly useful attribute for marketers who want to scale profitably.
The good thing: it’s easy to get on Android.
The challenge: you have to work for it — and earn it — on iOS, and in some cases, you simply can’t get it.
Mobile is now the default way we consume information. We’re spending an average of 4.3 hours a day on our smartphones, and that means we’re installing apps to access the information, services, messaging, products, and tools we need. That also means even now, a full 12 years after the launch of the first modern mobile app store, thousands of new apps are launched every single day on Google Play and the iOS App Store, joining the more than five million apps already published.
That means new games. New stores. New travel services (yes, someday we’ll be traveling again!). New on-demand services. And much, much more.
It also means a lot of competition. And that means publishers of mobile apps need what we used to call mobile app tracking, and now call mobile attribution, to understand and optimize the results of their mobile marketing campaigns.
The first thing you’ll want to know is that mobile attribution, or mobile app tracking, is very different than web-based marketing attribution. Because web marketers are adding mobile marketing skills to their toolsets, there are always smart, strategic marketers who need an introduction to mobile measurement. One of the key differences: while web attribution relies on cookies and pixel tags, mobile app attribution for Android and iOS apps works very differently.
This post is designed to help you if you’re new to mobile attribution and mobile app marketing to understand how mobile app attribution works, and how it differs from other forms of digital attribution.
Sophisticated data-centric app marketers use third-party mobile device app attribution systems for mobile app tracking, or mobile attribution. They are looking to track and attribute installs and remarketing events like re-engagements, just like web-based marketers might use an ad server like DoubleClick to track and attribute display ad campaigns on the desktop web.
Because Singular focuses on Android and iPhone app tracking or attribution for enterprise marketers, I’ll confine this explanation for how large app publishers get the breadth and depth of information necessary for attribution and campaign optimization at scale.
Web-Based Tracking Versus Mobile App Tracking
If you’ve been active in digital marketing for at least a few years, you’re familiar with both third-party cookies and pixel tags, and how they are used for marketing attribution. Third-party cookies are used by ad servers to anonymously identify users across a variety of touchpoints.
When a user’s browser requests a web page that will contain an advertiser’s promotional creative, the server places a cookie on their device and assigns it a unique user ID. When the user’s browser requests other pages containing ads from the advertiser, the cookie on the device delivers the unique ID to the server, so that the various ad views can be associated to the same user. And, when a purchase or sign-up or other conversion event happens, you can attribute the result to the ad campaign.
In this way, a third-party cookie is designed to associate all of a user’s exposure and actions in that browser to one ID. When a user converts, the completion action is tied back to specific marketing activity through the cookie ID.
Cookies are the go-to technology for most web tracking, but they have serious shortcomings because:
Many consumers clear their cookies or set their browsers to block them
Most cookies expire — often 28 or 30 days after they are initially placed
In addition, many people use multiple browser instances, like one on a home and another on a work PC (plus their mobile phone too)
A cookie ID by itself can only track a user’s activity within one browser instance
Modern web browsers already deny third-party cookies (Safari, Firefox) or will soon do so (Chrome)
Mobile app attribution (or mobile app tracking)
Many web marketers who transition to the app industry assume that cookies and pixel tags will also play a central role in these mobile analytics use cases. But cookies are problematic in mobile: they don’t work in apps.
Both Google and Apple have deliberately designed their respective iOS and Android device app ecosystems to limit tracking with cookies. So if you want accurate information for attribution and optimization, you need an entirely different system.
That includes brand and performance mobile marketing in apps, and it specifically includes mobile marketing designed to increase app installs or downloads.
App downloads, app installs, and attribution
When a user installs a mobile application, they must first download the software. Once downloaded, it is installed on the device automatically. But an install can only be counted — and can only be confirmed and attributed — at the moment of first launch.
Think of all this as a multistep process:
A user clicks an ad
They visit the app’s page in the appropriate app store
They click to download the app in the app store
The app automatically installs on the device
The user then opens the app for the first time
An iOS or Android install can be counted only after step five is completed. Thus, when advertisers refer to installs, what they really mean are apps that are installed AND THEN used once. This might sound like a pedantic nuance, but it’s important to understand this to get the full value from the rest of this post.
This additional step adds further complexity to an already complex and opaque system.
Let’s dig a little deeper into the steps and the way that desirable consumer actions like installs can be attributed to specific marketing activity. To do that, we need to draw some distinctions between the processes for Android and iOS, the two dominant operating systems. For both operating systems, the key task is to connect activity that occurs post-app-store with marketing activity that drove the visit to the app store. But beyond that basic similarity, there are some significant differences.
Google Play versus the iOS App Store
There are some process differences between iOS and Android app tracking that require explanation.
First, there is no measurement standard common across both systems. Google Play has been designed to enable a limited amount of tracking through Google’s sister product, Google Analytics. Google offers an SDK, or software development kit, which enables a referrer url and parameter to be passed to Google Analytics when a user clicks on an ad. If the user installs, the marketing activity can be easily credited. Using the referral parameter, you can track back all post-install activity to the referral source.
WIth Apple, things are a little more complicated. The App Store does not permit activity tracking within its walled garden. To connect specific installs to the marketing activity that drove them, you need a separate measurement solution that can trace the device ID to specific marketing activity.
Enter third-party mobile attribution, or mobile app tracking
Brands, of course, want to trace desirable marketing outcomes to the marketing activity that drove them. Third-party mobile attribution, or app tracking, like that offered as part of the Singular Unified Analytics solution, makes it possible to connect paid installs across Android and iOS back to the marketing programs that drove them.
To overcome the measurement issues discussed above — the multi-state app install process — most third-party mobile app tracking is delivered using a small piece of software called an SDK that is installed within the publisher’s app.
The SDK (Software Development Kit) connects the marketing activity to the desirable action like an install by matching the device advertising ID, which is a semi-permanent device identifier specifically developed to enable advertisers to measure marketing effectiveness.
There are two leading device IDs you will hear about a lot.
IDFA
For iOS (Apple) devices, the ID is called the device identifier for advertisers, or the IDFA. IDFAs help an advertiser identify the specific phone where the ad action takes place. The Apple IDFA doesn’t change unless a user decides to change it in their phone settings. Few consumers feel a need to take this action, so IDFAs can offer a great foundation for a persistent and anonymized consumer profile.
Apple introduced IDFA to offer consumers a choice when it comes to interest-based advertising and tracking. IDFA is the only ID that Apple allows advertisers to use to understand the advertising actions on its phones, replacing the Universal Device ID, or UDID.
The Android or Google equivalent to the IDFA is called a Google Advertising ID or GAID. It was previously referred to as the Android Advertising ID. These IDs share critical characteristics with IDFAs, in that they are persistent unless or until the user decides to change them. Before the Google Advertising ID, advertisers could track actions on Android phones using a device identifier called Android ID (or ANDI.) Users have the option to opt out of Android Advertising ID tracking, or to change their ID periodically.
That said, few consumers feel the need to take such action.
With most mobile app tracking, these advertising IDs are the means through which pre-app-store activity like ad clicks are connected to post-app-store activity like first launches.
Sometimes, though, it is not possible to link ad activity to an install with a device advertising ID.
This can be because the consumer has changed their advertising settings by choosing to Limit Ad Tracking on their device (iOS), or turn off ads personalization (Android). In those situations, a second attribution method called fingerprinting was historically deployed. Fingerprinting uses other signals to match marketing activity to an install. Such signals are collected by using non-personally identifiable information like IP addresses to infer a connection between an ad click and an install. The accuracy of matching through fingerprinting varies based on the signals available and utilized by the attribution provider, but such matching can often approach the level of accuracy available by matching device IDs.
Note that as of iOS 14.5, Apple does not allow the use of fingerprinting.
Attributing credit for an install
Advertisers want to know if their paid marketing programs are driving desirable customer actions like installs. Not every install, after all, is driven by advertising. Some installs will occur naturally, without advertising. Others will occur after a user clicks (or views) an ad. By connecting installs and ad clicks to the same device ID, you can identify which of your installs were driven by marketing activity.
But advertisers want to know more than just whether an install was driven by paid marketing.
They also want to know which programs, partners, and creatives were responsible for the install. When a user clicks only one ad prior to an install, it is very straightforward to connect that install to a specific campaign, media vendor, and execution.
But many installs occur after a user has taken multiple ad actions. For those instances, attribution providers play a critical role in pinpointing which marketing program and partner was ultimately responsible.
To attribute credit, attribution providers usually leverage last-click attribution, which attributes 100% of the credit for an install to the last partner that drove a click. Think of it as an assumption that the last click is the one that got the user to install.
Last-click attribution is the generally accepted model for attribution even though most people in the industry recognize that it has some shortcomings. It’s almost certain, for example, that clicks other than the last click prior to an install deserve some of the credit for that install. That said, last-click is viewed as the best available option given the complex measurement dynamics. And, in iOS 14 with SKAdNetwork, last-click attribution will literally be the only option for most devices.
One key issue is that many of the largest vendors are “self-attributing” ad networks. In fact, self-attributing networks make up 80% or more of ad spend across the industry.
Here’s how a third-party attribution provider can capture necessary information from a self-attributing network.
A self-attributing network must be queried after an install has occurred to determine whether they drove an ad click. By contrast, most partners automatically report all ad clicks immediately after they occur. Here is a simplified version of the steps for querying a self-attributing partner:
The attribution provider captures the device ID when a user first launches a new app
The attribution platform queries all self-attributing partners, asking whether the device ID was influenced by marketing activity on their platforms
Any self-attributing partner responds by telling the attribution provider about the last click that occurred in their networks for a given app’s advertising, and when it occurred
The attribution provider compares the timestamps from those self-attributing networks to the timing of installs recorded by other partners
The most recent click prior to an install is credited with the install
Since self-attributing networks do not report every click — only the most recent one, there would be no way to attribute installs using a method other than last-click
All partners accept last-click attribution as the accepted attribution method.
Third-party attribution tools for mobile app tracking
Without a third-party attribution platform, it would be impossible for marketers to understand which program and partner drove an install. Further, attribution partners ensure that an install is credited only once. This is so that an app publisher doesn’t double-pay or triple-pay multiple vendors for the same install.
To properly credit every paid install to a marketing program, your attribution provider must have visibility into activity across all your media partners. While many media partners will integrate with any attribution provider, some strictly limit such integrations to a small number of partners.
Facebook, for example, limits access to attribution information, including timestamps, to a handful of companies that they have identified as high quality partners that adhere to stringent data and privacy regulations. Since Facebook often represents 20% to 40% of an advertiser’s spend, visibility into this leading platform is a critical component of a robust attribution offering.
Similarly, other self-attributing networks choose a select set of partners for attribution. Singular is very proud to offer its clients universal visibility into all of their app media providers, including Facebook, Google, Apple, Snap, Twitter, Pinterest, and more.
In addition to tracking installs, attribution providers also track post-install events like registrations, purchases, and the like. These can also be tracked back to the last-click media partner.
Re-engagement tracking
Marketers are increasingly investing time and ad spend to drive desirable consumer actions other than installs. For example, many brands now use advertising to drive incremental purchases or to get cart abandoners to return and purchase items that they added to a shopping cart but did not immediately buy.
Mobile app attribution or tracking providers can also be used to track in-app actions like purchases to the media partner that drove them.
Mobile app attribution or tracking without an SDK
Some brands do not want or permit the addition of SDKs into their apps. For these companies, server-to-server-based mobile app tracking offers a viable measurement alternative. In such cases, mobile app attribution tasks are still executed by the attribution provider, but the transmission of information becomes the responsibility of the advertiser.
Server to server integrations are fairly uncommon. For Singular, SDK-based attribution accounts for more than 70% of our client business.
View-through attribution
An increasing number of advertisers are now measuring view-through attribution when no clicks precede an install. View-through identifies the media partner or campaign that displayed an ad to the user, even if there were no clicks. View-through measurement is generally only used when no click precedes the install.
Get in touch with Singular to learn more about our attribution services and our unified mobile analytics platform.
Ad monetization is growing fast. But traditionally, user acquisition teams don’t see ad revenue and can’t account for it when calculating return on ad spend (ROAS). That means they make sub-optimal user acquisition decisions with inadequate information.
How do you fix the problem?
Align your user acquisition and admon teams.
Of course, that’s easy to say, but it leaves plenty of open questions. How do you calculate ad monetization revenue, for instance? How do you know which users are more valuable than others? And how do you merge in-app purchase revenue with ad revenue to obtain a blended real number for total revenue? What is your true ROAS?
The short answer?
We’ve had Singular’s Director of Customer Success, Liz Lauer-Lopez, and Ironsource’s VP of Growth, Yevgeny Peres on the call to work through three steps that will help you align ad monetization and user acquisition. The result: you’ll acquire more users that generate higher ROI and revenue.
Liz and Yevgeny will talk about:
Measuring user revenue behavior for IAPs and ads together
Attributing user revenue across all channels and combining it with cost data
Taking action based on data
Add it all up, and you’ll be able to predict true LTV with all revenue accounted for. And that will help you analyze and optimize your user acquisition marketing much more effectively.
Even if you can’t make it tomorrow, that will ensure that we’ll send you a full version of the webinar later, which you can watch at your leisure. And, if you’re seeing this days or weeks after the webinar occurred, you’ll still get a copy to consume.
How do you do data-driven creative optimization for digital advertising campaigns? Should you do data-driven creative optimization? Should you localize creative? And, should you always follow the data?
It’s not always obvious.
And, just to make it more confusing, top experts at leading mobile brands don’t always agree.
While there are commonalities between how leading mobile experts approach these questions, there’s also considerable diversity. That diversity is often tied to companies’ different strategy and tactics. It’s also a function of short versus long-term goals. It depends on how digital marketers do data-driven marketing in general.
And, this diversity suggests that there is not one true answer for your company and your brand either … but that you’re going to have to make an informed decision for yourself on how to proceed with data-driven creative optimization.
So while top mobile experts don’t always agree, what they say and how they disagree can help you formulate a customized data-driven creative strategy that works for your brand.
Here are the top 10 secrets we learned from marketing strategy experts at Supercell, Earnin, and Vungle at Singular’s big UNIFY mobile marketing conference.
1. Testing matters (a lot) for data-driven creative
It’s probably not a shock to most people that testing matters when you’re trying to do creative optimization.
“Test everything,” says Earnin’s Director of User Acquisition Vanessa Chang. “Not just your in-house creative but your buttons, your copy, everything that can help impact your creative.”
Why do people test? It’s simple, says Supercell’s Emily Tierney:
“The best creative yields the best performance metrics.”
This is especially important when you scale data-driven marketing. (It’s also harder … which is why Singular’s Creative Analytics tool comes in handy for high-volume digital marketers.)
“When you scale and have a ton of volume, it gets more important to iterate quickly and you need to evaluate your results quickly as well,” Chang says. “What Singular has really allowed us to do is it answered questions we weren’t able to answer without the platform.”
2. Creative exhaustion is over-rated (sometimes)
Creative exhaustion is almost an item of faith for modern digital marketers. But sometimes it’s over-rated, as Singular CEO Gadi Eliashiv discovered in a data-driven creative exhaustion study he recently published.
For Supercell, there are higher priorities than optimizing for creative exhaustion or even individual ad performance.
“Optimizing for brand [is] very important for us,” Tierney says. “It’s more important to elevate our company so that people recognize Supercell as a global brand, so that when we create new IP, people immediately associate that it will be high-quality games with high-quality animations.”
As a result, Supercell invested nine months in building one piece of creative … a 60-second long cinematic that is essentially a fully animated world-class 3D movie.
The result, “No Time To Explain,” brought in the lion’s share of new users for Brawl Stars with very low CPI, Tierney says. It had both long view time on both Facebook and Google and active engagement, and is still being used for user acquisition more than six months after launch.
Consumer behavior, clearly, does not always require new creative assets and new creative strategies.
3. And yet … creative exhaustion exists
On the other hand, marketers know that for many brands and campaigns, creative exhaustion is a very real thing. Digital marketing assets don’t last forever. Advertising ages.
“Ad fatigue is real,” says Vungle’s Global Head of Creative Labs Gavin McNicholl.”Our clients want to do testing … it’s expected in the space now.”
That’s something that Earnin sees as well, particularly when scaling spend. And it forces EarnIn to scale creative production as well.
Does this creative exhaust you?
“The more we were spending money, especially in the same channels, the more we needed to keep up the rotation and keep feeding the channels to find new winners,” Chang says. “We needed more message types, more actors.”
Even Supercell, which Tierney calls “lucky” for having some evergreen creative that she can run for a long time, sees decay.
“They do decay over time,” she said about her creative. “It’s not like we can run it for six years.”
The goal, according to Vungle is to keep looking for new evergreen creative while running iterations. The company’s algorithm, therefore, allocates a certain percentage of impressions for new units to try to find that new evergreen material.
4. Data-driven creative: Localization is not ALWAYS required
Localization is religion to marketers burned by stories of brands releasing culturally inappropriate messaging or products in different cultures. Often that even extends to different ad creatives and marketing campaigns by audience segment.
Supercell pays attention to culture, but it doesn’t focus on building geo-focused campaigns or creative.
Instead, Supercell goes for the universal in its creative process:
“We really believe in one true global creative,” says Tierney. “When we launch any new games, we really try to generate creative that resonates with all our communities and all regions, and it’s quite challenging. As you know, western creative sometimes doesn’t translate well to the east. Our games are games that people will play forever, and our creative is creative that people will remember forever.”
That may not work for every brand or every app. Advertising in general should focus on being relevant to its audience.
But Supercell is clearly doing something right … on a global scale.
5. BUT … localization is OFTEN required
As GM and its creative agencies found out when naming a car “Nova,” or “no go” in Spanish, not every name works in every culture. Similarly, not every image works for every culture.
When Vungle was working to localize Sherlock Holmes, the British actor Benedict Cumberbatch and the American actor Robert Downey Jr made perfect sense, although it’s possible they could have found one star to cover both countries.
But Japan … Japan was another story.
Suffice it to say: the creative process was entirely different.
Now that’s localization with an added dose of gender-switching.
But you can go farther and do hyper-localization based on seasonal events, Vungle’s McNichol added.
“Chinese New Year is a very significant revenue period for us, so we’ve looked to scale out specific kinds of end cards that incorporate cultural elements,” he said. “So for Chinese New Year you have the red envelope — obviously, the connotations around that [are that] good things are coming your way. It was no surprise that clickthrough rates went through the roof there.”
6. Data-driven creative: Shockingly, data is incredibly important
It shouldn’t be surprising: data matters.
That’s not just the case on upper funnel. Lower funnel is probably even more important.
“When you scale and have a ton of volume, it gets more important to iterate quickly and you need to evaluate your results quickly as well,” says Earnin’s Chang. “What Singular has really allowed us to do is it answered questions we weren’t able to answer without the platform.”
By leveraging community as well as in-house creatives, Earnin was able to build 5X more creative concepts. Now, 50% of their ad impressions originate from community-sourced ads. And that’s resulted in a 25% funnel step improvement. Data drives actionable insights which can be fed into future creative thinking and marketing efforts.
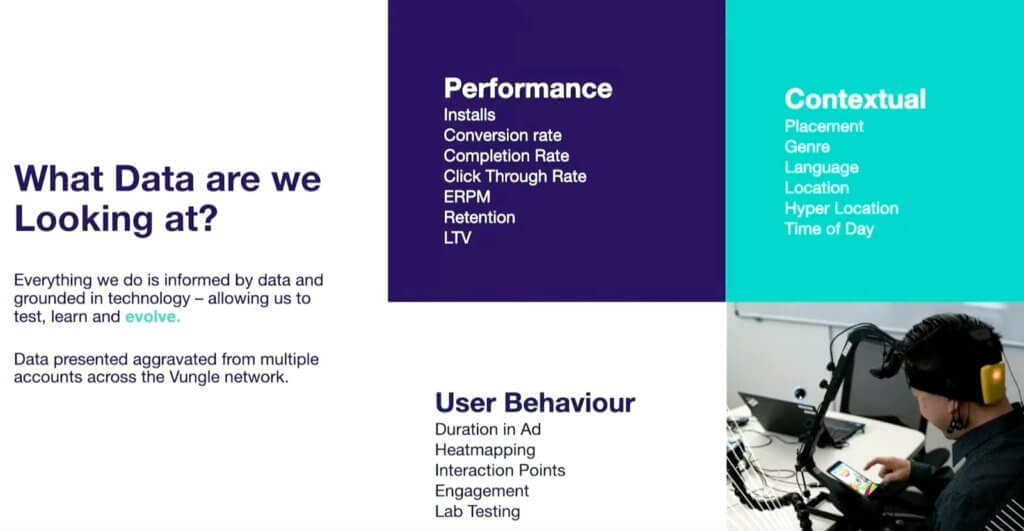
Ultimately, Vungle looks at three kinds of data, says McNichol: performance, contextual, and user data:
How Vungle analyzes data-driven creative performance
Performance data includes installs, conversions, and retention. Contextual data includes geographical location, time, and placement. User behavior is engagement, duration, and interaction points, as measured by heat mapping and lab testing.
Also important: target audience and some understanding of the customer journey.
7. But being purely data-driven could be the wrong approach
It’s not controversial to be data driven, and to be evaluating results for your data-driven creative. It would be controversial, on the other hand, if a digital marketer said that they’re not data driven.
Supercell has an interesting nuance on this.
“This is a philosophy we use a lot in Supercell: to become a data-informed marketing team instead of data-driven,” says Tierney. “It actually means optimizing for the brand, for the IP, for the company.”
That’s worth unpacking.
Supercell cares about data and performance of their ads and campaigns, but not the overall brand matters more than any given ad. And it matters more than individual campaign performance..
That’s why the first second of every Supercell video is alway the Supercell logo. Supercell knows that the first five seconds of every video is the most important, and that they’re sacrificing 20% of that attention-grabbing time.
But they’re betting that positive long-term association with the Supercell brand outweighs individual ad performance. That’s data-informed — and you could argue data-driven on the macro level.
8. Your mobile ads CAN work on TV
You have to build creative assets uniquely for each platform or medium, right? Such as social media ads versus search ads, and mobile ads versus traditional TV ads?
Well … not necessarily, according to data-driven marketing experts. At least in the case of repurposing mobile ads to traditional and streaming TV platforms.
“As we scaled in streaming TV and linear TV, a lot of people were telling us that we should use very branded versions of creatives that were more for TV,” Earnin’s Chang says. “And I would challenge that because I think we have seen a lot of success in using our community-generated ads across many different platforms. It’s not necessarily about the format or the placement, I think it’s really about assessing how you want your message to go in all your different channels.”
That means that you actually can use a “low-quality” portrait creative on TV, she added. You just have to be aware of delivering that in a way that makes sense to the audience.
That’s a role reversal, Vungle’s McNichol says.
When Vungle first started building ads for mobile, they’d get a lot of executive asking them to run TV ads on mobile ad networks … something that doesn’t really work. (Especially back then.)
“What’s very interesting is the idea of the visual language of mobile and web finding its way onto TV,” says McNichol.
9. Your customers can make your ads
We’re not in the dawn of user-generated content any more. But there still aren’t many CMOs who are jumping up and down agitating for their customers to make their ads.
It make a ton of sense, however, if you don’t have enough time to produce a wide enough variety of creative. Just maybe, your community can help.
“We focus a lot of our efforts on using creative generated by our community,” says Chang. “This is really at the core of what we believe is one of our biggest differentiators as a financial tech brand … we have a real community supporting us.”
10. UA and creative need to be In Sync
User acquisition and the creative team need to be completely in sync … and co-location helps.
“We’re very aligned with our creative team,” says Chang. “First, we sit next to them so that makes it easy to share insights. And second, we actually have a weekly creative performance review where we share insights.”
Easy access to the same numbers doesn’t hurt either.
All creative producers at Earnin are well versed in the company’s dashboards — and Singular data — so they can check whenever they want on what’s performing well, what has high click-through rate, conversion rate, and so on.
11. Data-driven creative: Make playables MORE interactive
Playables are the highest-performing creative on the Vungle Ad Network, McNichol said. But by analyzing three million views of one particular playable ad, they learned how to make them better.
One hint: add more interactive elements.
“Always give the user something to interact with,” McNichol says. “They’re engaged … they want to get involved.”
Interaction heat maps show that users are tapping and swiping all over playable ads, including in places where there are no interaction points. Providing more interactive elements is important for engagement: when users are starting to engage, they stay in the experience.
And once they’re engaged, there’s a lot less “X’ing out” of the playable.
12. RPG game? Put characters in the ad
Many games, including RPG games, are character-driven. While it might seem important to demonstrate game-play in your video ads, Vungle has found that focusing on characters is critical.
Why?
People connect with characters, and connection drives engagement.
The result for for one Korean client’s mobile RPG game, King’s Raid, was 5X return on ad spend by day seven.
13. Playables aren’t just for gaming brands
Playables are just for games, right?
The short answer is no.
“We actually started introducing playable to some of our brand clients, including TikTok,” McNichol says. “We actually produced this playable unit where you kind of gamify it.”
Essentially, Vungle made a tapping game: as a cool video plays, you tap on it to make social-media-style love hearts pop up. That unlocks an even cuter video, and repetition unlocks an even cuter yet video. All of which represents what people actually do on Tiktok in a pretty authentic way, and yet is fun and playable for a complete Tiktok newbie.
“It became our highest-performing creative for Tiktok,” McNichol says. “So you can definitely gamify: take elements of the brand and have fun with it.”
And, if you’d like to see how to do data-driven creative on Singular’s platform, schedule a demo. We’d love to show you how top mobile marketers are beating the competition with a little help from our data and insights.
We’re pleased to announce that Singular has won the 2019 Technology Innovation Award for marketing analytics in North America from Frost & Sullivan.
Past recipients of Frost & Sullivan awards include Google, Verizon, Cisco, and IBM. Frost & Sullivan is a global research consultancy. 98% of the Fortune 1000 are clients, and the company creates original research for dozens of industries and sectors.
That research included investigating five key technology attributes including Industry Impact, Product Impact, Scalability, Visionary Innovation, and Application Diversity.
Frost & Sullivan’s study also examined five future business value criteria: Financial Performance, Customer Acquisition, Technology Licensing, Brand Loyalty, and Human Capital.
“Against the backdrop of extensive primary and secondary research across the entire value chain, Frost & Sullivan is quite pleased to recognize Singular as the Technology Innovation Leader in the marketing analytics industry,” David Frigstad, Chairman of Frost & Sullivan, wrote in a letter of congratulations.
“Achieving excellence in technology innovation is never an easy task, and it is made even more difficult considering today’s competitive intensity, customer volatility, and economic uncertainty—not to mention the difficulty of innovating in an environment of escalating challenges to intellectual property,” Frigstad wrote. “In this context, your selection as recipient of this Award signifies an even greater accomplishment.”
It’s important to note that this was an independent study. Singular did not pay for it to be produced; we did not request that this report be created, and we did not apply for a technology innovation award.
And all of which, of course, makes winning that much sweeter.
Global brands have lauded Singular’s marketing intelligence platform as one of the strongest and most irreplaceable tools in their arsenal that has helped them obtain a clearer picture of their marketing effectiveness and maximize their return on investment.
– Frost & Sullivan report
More than anything else, Singular is focused on the success of our customers — the best marketers in the world. That makes this external validation of our recent progress particularly gratifying.
[Singular] has been an integral partner to some of the most innovative companies worldwide that have achieved phenomenal success with their marketing efforts.
– Frost & Sullivan report
That’s precisely what we’re seeing with customers like Ilyon: growing 98% with a little help from Singular. And Postmates: decreasing cost per buyer 80% with unified marketing analytics. And LinkedIn, which established a single source of truth for marketing performance using Singular.
“We’re very excited to get this award from Frost & Sullivan,” says Singular CEO Gadi Eliashiv. “It confirms that the most important thing we’ve been working on over the last year — our customers’ growth and success — is actually happening.”
Over the past decade we’ve seen the rise of the marketing technologist, who has one foot in the marketing department and another in engineering. And we’ve seen the data scientist role jump from almost nonexistent to being one of the fastest-growing jobs in just a decade.
Increasingly, as marketing is changing, technology is central to how marketers perform. Growth is now a key unifying function in brands and enterprise, and we’re also seeing the rise of the Chief Growth Officer.
We’re releasing a report on that in about a month.
But … our CEO Gadi Eliashiv gave a sneak peak at some of the results recently at Mobile Apps Unlocked in Las Vegas.
The rise of chief growth officers
Ultimately, the way chief growth officers lead their organizations is by using data-driven insights. Some of the most successful leaders drive those insights via marketing intelligence platforms like Singular.
The primary function of a marketing intelligence platform?
To provide insights for growth by connecting effort with outcome at granular and aggregate levels.
Ultimately, that’s how CGOs and other growth leaders get the score. Understand if they’re winning or losing. And know at both as high level and as granular as they want: how successful are our marketing, our campaigns, our ads, our creative.
Knowing that — and getting smart insights for optimization — powers breakthrough improvement in conversions and ROI. And that’s exactly what most brands, enterprises, and companies need.
In the simplest possible terms, a chief marketing officer’s role is to implement strategy that ultimately increases sales. A chief growth officer’s role is even simpler and more explicit: grow the company.
But how?
And what tools do they need to achieve those goals?
Singular is privileged to work with growth marketers at companies like Lyft, LinkedIn, Rovio, Wish, AirBnB, DraftKings, StitchFix, plus many more. We’ve seen what the best growth marketers the planet do, and we know what technology they use.
“Marketers are drowning in data,’ says Jo Ann Sanders, a VP at Optimizely.
That’s the problem.
“With the exponential growth of data over the past decade … it’s becoming harder daily to turn information into action,” says SurveyMonkey CMO Leela Srinivasan.
Marketers are drowning in data thanks to the unprecedented data exhaust of our digital lives.
We browse the web, we install apps, we watch four million videos on YouTube every minute, we search on Google 40,000 times a second. The world will soon have almost six billion mobile subscribers, and American adults now spend more than 3.5 hours a day on their phones in branded apps, sponsored media, and ad-supported sites.
At the same time, marketers are dealing with an exponential rise in tech tools, more digital channels than ever before, and more billion-user platforms every year.
Add in global competition, and 76% of CMOs say they can’t measure marketing performance accurately enough to make truly informed decisions.
Marketing intelligence platform
What marketers need most is actionable insights for growth. So CMOs’ (and CGOs’) biggest challenge is simply mining nuggets of gold from all that data. That requires real-time measurement and analysis at scale across potentially hundreds of platforms, partners, and channels.
That’s why Singular built what we call a Marketing Intelligence Platform.
The new marketers are different. They speak data and write code. They form hypotheses and run experiments; then measure results and optimize. These new marketers are marketing scientists, and they need tools of their trade.
With a Marketing Intelligence Platform, marketers achieve three critical things:
Unprecedented visibility at scale
On-demand flexible reporting
Full customer journey insights
That’s seeing not just your data, but your ROI on every activity. It’s slicing and dicing not just by campaign, but getting CAC per creative asset. And it’s measuring not just conversions, but cross-device and cross-platform journeys that led to customer action.
This requires at least nine components, combined into a single platform, grouped in three sections. We’ll take a very brief look at each. For a full in-depth overview, however, check out our complete Marketing Intelligence Platform report.
The three things that CGOs and CMOs need to drive and accelerate growth are …
One: Unified marketing data
You can’t get the golden nuggets of actionable insights without mining your data, and that starts by unifying it.
Unifying marketing data includes:
Data governance
Data ingestion
Data processing
Attribution
Dimensional data combining/synthesis
Data governance ensures clean data from every source, and enables processing, enriching, and combining later on.
Ingestion is getting all your relevant data from every source, and it’s not easy. Processing is essential to standardize and normalize it, at which point you can conversion outputs to marketing inputs. Combining and synthesizing top-funnel and low-funnel data reveals deeper trends and granular results.
Two: Intelligent insights at scale
At a high level, marketers need to know the score: across all their campaigns, are they winning or losing? At more granular levels, they need to know if a specific campaign, partner, publisher, or creative is performing.
Generating intelligence insights includes:
Reporting and visualization
Actionable insights
Reporting and visualization shows marketers what’s happening, and actionable insights provide clues for future profitable growth. Some of those insights are pull, but some need to be push: alerts about out-of-scope campaigns, click-through rate drops, poorly performing ad partners, and so on.
Three: Automation
The volume of data flooding marketers’ dashboards, reports, and spreadsheets cannot be handled manually at scale. Automation is required, and it includes:
Data transport
Alerts, fraud, audiences
And much more
It is not useful to have a system that only ingests data. Marketing data needs to move from systems of deployment to systems of analysis to systems of engagement, and sometimes in multiple directions. So building in the ability to do that via API, exports, or S3 to internal BI systems and hundreds if not thousands of external partner systems is critical.
And while modern scientific marketing is not a set-it-and-forget-it activity, marketers increasingly need to be able to automate actions within set parameters.
That includes automated creation and distribution of audiences for retargeting, look-alike campaigns, or suppression lists. It also includes built-in on-by-default configurable mitigation of fraud, along with both whitelisting and blacklisting of sources and publishers in paid media campaigns.
And at higher levels, it includes automation of bids and buys for ad campaigns at scale.
Results: what a marketing intelligence platform delivers
What does a marketing intelligence platform deliver?
Find out soon in part two of this blog post, coming next week.
Intelligent data that drives insights for growth requires three key ingredients:
Accuracy
Granularity
Actionability
In order to obtain all three ingredients, you need to ensure the reliability of API integrations with each of your marketing platforms. This is where you find the Singular difference. Singular is the only measurement partner to have two separate API integrations with Twitter, along with over 1,000 additional marketing platforms, providing you the most comprehensive solution for ROI down to the creative level.
This is what we call “dual integration.”
WTH is the Dual Integration approach?
Before you can understand the importance of API integrations (and dual integrations) you first should understand the type of data you need to collect in order to have anything meaningful for your campaign optimization efforts. Simply put, there are two key data sets you need to collect from your marketing platform, whether that is from Twitter, Snapchat, Pinterest, Facebook, Google, Vungle, Unity, Amazon: you name it.
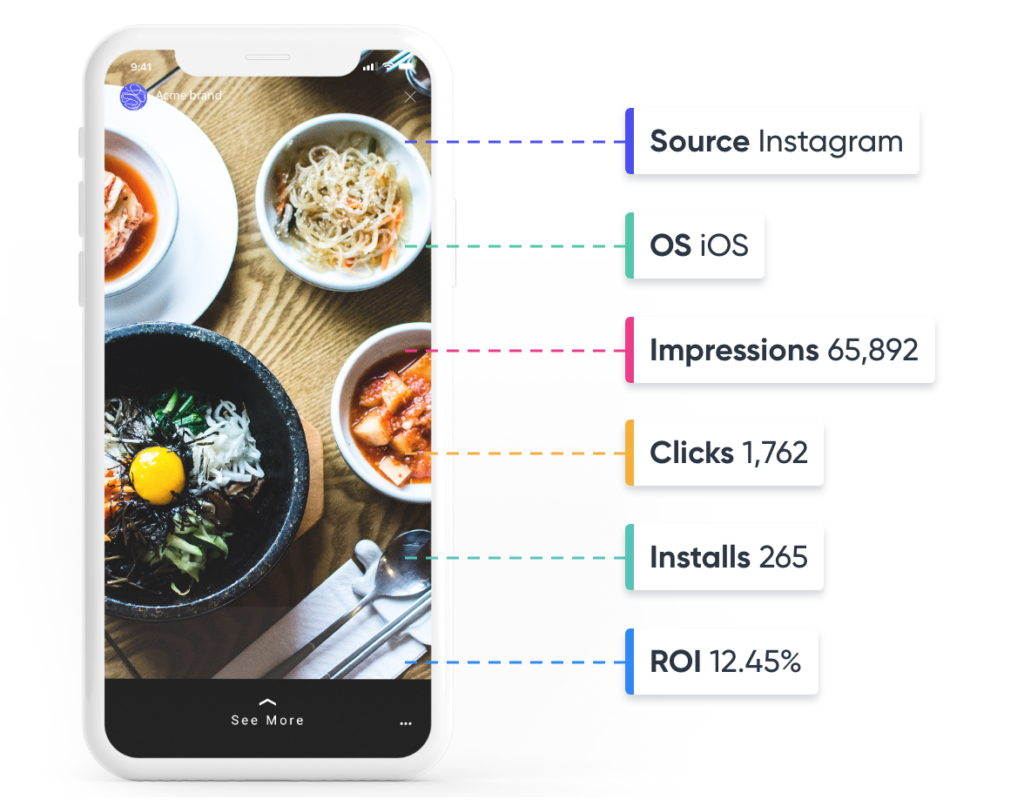
First, you need your campaign analytics data (aka pre-install data) to answer questions like:
“How much did I spend on this campaign?”
“How many impressions did that creative get?”
“How many clicks came from each publisher?”
Second, you need your attribution data (aka post-install data) to answer questions like:
“How many installs did that campaign generate?”
“What was the revenue on this creative asset?”
“How many people went to level two as a result of this keyword?”
Only by combining these two datasets with a robust cost aggregation solution can you really know your ROI by campaign, by creative, by keyword, and by individual ad. This gives you the power to optimize at the most granular as well as aggregate levels, providing your best opportunity to maximize profitability.
To do this manually, you would need to standardize the hierarchies (some sources offer only campaign and ad level, while others go right down to the keyword) and the taxonomies (names and terms differ) across every source, and then calculate your ROI by each dimension … every single time you need it.
Sounds like a pain in the @$$?
Good thing Singular has already done it for you!
This is the dual integration approach
Singular has spent years building API integrations for both sides of the puzzle across over 1,000 additional marketing platforms, and automatically combines this data to show you ROI at the most granular levels.
Unlike other analytics platforms who are only accountable for your “pre-install data” or other attribution providers who are only accountable for your “post-install data,” Singular is accountable for both. Which is why we are the only Twitter measurement partner to have integrations that collect BOTH datasets, just as we do for hundreds of other marketing platforms: so we can do dual integration for you, out of the box.
Inherent flaws with tracking links
You might be asking: So why can’t I just use tracking links to collect this data? My attribution provider uses tracking links and says they can do campaign ROI.
Great question! While the tracking link is the easiest way to collect the necessary macros for a given network, this method has some inherent flaws.
It is not retroactive
You are only receiving data at the time of the click, therefore if the numbers reconcile after the time of the click, this will not be reflected in your reporting.
Not all networks support passing all macros
For example, you might be able to receive campaign cost and clicks, but you may not get site ID or publisher ID.
No creative assets!
Singular is the only solution on the market to provide you the most complete reporting of your creative asset ROI across the most visual networks. However, creative assets and their performance can only be reported by an API integration.
Data loss and discrepancy is HIGH
In a recent study, we compared a number of customers who were using Singular along with a third-party attribution provider. In observing their “campaign data” collected via our API integration against the same data set collected via the tracking link by the third-party attribution provider, we saw a 31% discrepancy … with the numbers reported from our API integration matching identically to the number on the final bill.
Of course, we too sometimes rely on the tracking link for those marketing platforms that do not offer an API to collect campaign analytics. However, in the rare case that we cannot collect data via an API, we will also rely on alternate integration methods to ensure accuracy of the data.
For example, a daily email report, or a CSV file upload to an S3 bucket.
We understand every marketer is different, and how you look at your data may be completely different from your competitors. We are flexible and here to ensure the data you see in Singular matches your internal systems.
Heck, we even have a bi-directional API to push and pull data to your source of truth.
Already a Singular customer and looking to take advantage of our dual integration with Twitter? Check out the help center for details on how to configure your Twitter integration.