Return on ad spend (ROAS)
What is return on ad spend (ROAS)?
Return on ad spend (ROAS) measures how much revenue you earn for every dollar you spend on advertising. It’s the metric performance marketers use to separate what’s working from what’s quietly wasting budget. Similar to return on investment (ROI), it tells you what your advertising is actually contributing to the bottom line, and it can be measured across an entire marketing budget or broken down by campaign, targeting, ad, or keyword.
How do you calculate return on ad spend?
The core formula is straightforward:
ROAS = Revenue Attributable to Ads ÷ Cost of Ads
For example, if you invest $1,000 in an ad campaign and generate $4,000 in revenue from those ads, your ROAS is 4x, meaning every dollar spent returned four dollars in revenue. ROAS can be written three ways that all mean the same thing: a 4:1 ratio, a 4x multiple, or a 400% return.
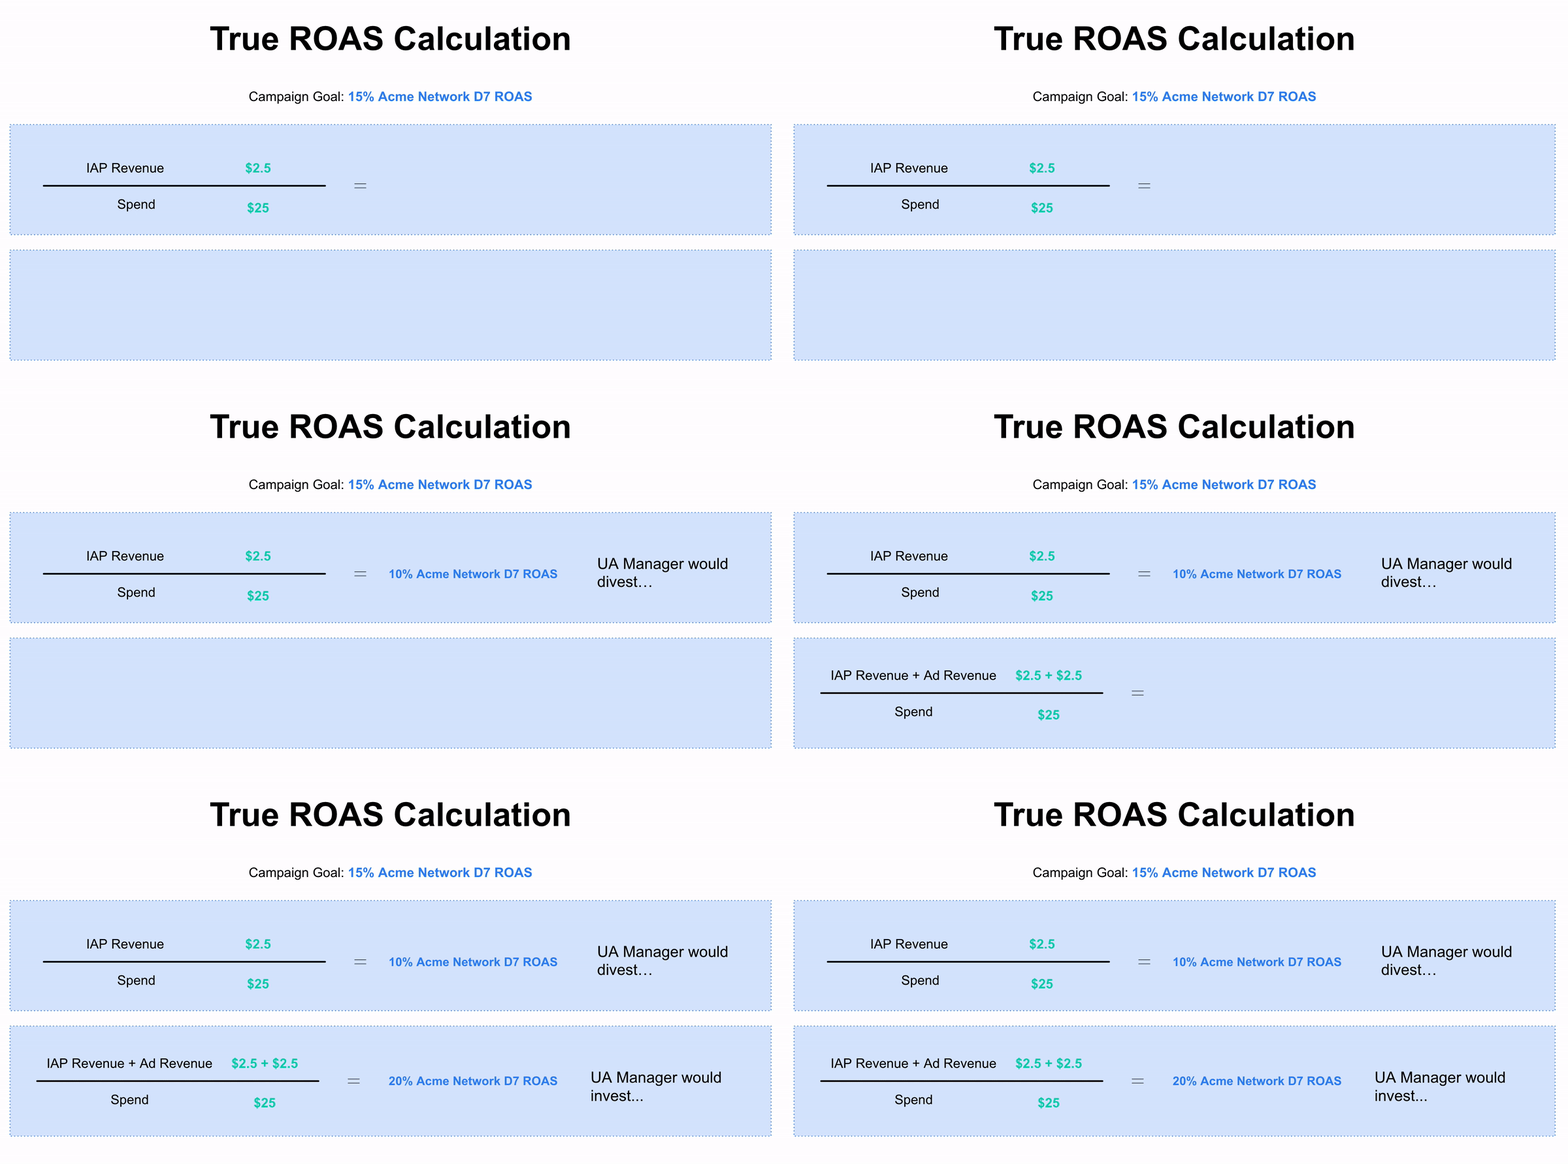
A note on notation, because it trips people up. E-commerce and web campaigns usually quote ROAS as a multiple (4x), measured close to the point of sale. Mobile app campaigns almost always quote it as a percentage tied to a measurement window (a 30% D30 ROAS), because app revenue accumulates over weeks and months through in-app purchases, subscriptions, and ad monetization. Early-window app figures land below 1x, which is why they read more naturally as percentages. The two aren’t directly comparable, and treating them as if they were is one of the most common benchmarking mistakes.
How to achieve maximum ROAS?
Singular helps you get the most out of your marketing
What counts as ad cost?
The denominator matters as much as the formula. You can define ad spend narrowly or broadly:
- Actual media spend: what ad platforms bill you directly.
- Salary costs: in-house or contract team members managing campaigns.
- Vendor fees: agency commissions and technology platform costs.
- Affiliate costs: individual commissions and any affiliate network fees.
Many teams calculate both a narrow ROAS (media spend only) and a fully-loaded ROAS (including all associated costs) to get a complete picture of campaign profitability.
Break-even ROAS: your true floor
Before setting ROAS targets, calculate your break-even point:
Break-Even ROAS = 1 ÷ Gross Margin %
A business with 40% gross margins needs at least a 2.5x ROAS just to cover ad costs. At 25% margins, the floor rises to 4x. Every dollar below break-even means you’re losing money on acquisition. This single calculation is more useful than any industry average, because it’s built on your economics rather than someone else’s.
What is a good ROAS in 2026?
There is no universal answer, and anyone who tells you “4x is the benchmark” without context is oversimplifying. Good ROAS depends on your margins, business model, channel mix, and the measurement window you use. The most important number is your break-even ROAS, not an industry figure.
For web and e-commerce, ROAS is measured close to the sale and quoted as a multiple, so a healthy number depends almost entirely on your gross margin. For mobile apps, the picture is different, and it’s worth looking at more closely.
Mobile apps: measure by window, not by a single number
Mobile apps earn spend back gradually, so app teams track ROAS at day 7, day 30, and day 90 after install rather than as one flat figure. A campaign that looks weak at D7 can be a strong performer by D30 once monetization accumulates. The right window is the one that matches how your users actually generate lifetime value (LTV): ad-monetized games recover quickly, while in-app-purchase and subscription apps build revenue over a much longer curve.
Day 30 is the checkpoint most teams anchor on. It’s late enough to separate real performance from early noise, and early enough to act on. Here is the median D30 ROAS across advertiser accounts running on Singular.
Median D30 ROAS by channel
| Channel | Median D30 ROAS |
|---|---|
| Ad networks | 50% |
| Apple Search Ads | 40% |
| TikTok Ads | 30% |
| Snapchat Ads | 30% |
| Meta Ads | 20% |
| Reddit Ads | 10% |
Source: Singular first-party data, 2026. Figures are medians across advertiser accounts by channel.
A few things to read from this.
These are medians across the full advertiser base, not best-in-class targets. Half of advertisers on each channel do better than the figure shown, and half do worse. If you’ve seen higher numbers quoted elsewhere, those are usually aspirational targets for top-quartile campaigns, not the middle of the market.
Almost no median cohort is fully paid back at D30, and that’s expected. A 30% D30 ROAS means a campaign has recovered roughly a third of its spend one month in, with the rest arriving over the following months through continued purchases, subscriptions, and ad revenue. D30 is a milestone on the way to payback, not payback itself.
Channel medians sit closer together than most people assume. The gap between the top and bottom of this table is smaller than the gap between a strong and a weak advertiser on any single channel. Which channel you buy matters far less than how well you run it.
Why ROAS matters: how marketers actually use it?
No one advertises just for fun. ROAS is the foundational check on whether your campaigns are revenue-positive, but its value goes well beyond a single number.
Evaluate and optimize budget allocation
ROAS can be calculated at every level of granularity: across your whole budget, by channel, by campaign, by ad group, by creative, or by keyword. When one campaign returns 6x while another returns 1.5x on the same channel, you have a clear basis for moving budget toward the winner and reinvesting the margin you free up. This is where combining ROAS with cost aggregation across every source becomes essential, since you can’t compare returns you can’t see.
Set minimum, target, and stretch ROAS goals
- Minimum ROAS: your break-even point (1 ÷ gross margin).
- Acceptable ROAS: covers media costs plus associated operating expenses.
- Target ROAS: the return at which you actively scale investment.
Combine ROAS with supporting KPIs
ROAS is most useful when paired with metrics that explain what’s driving it:
- Cost per acquisition (CPA) shows efficiency at the conversion level.
- Cost per lead (CPL) helps diagnose lead quality relative to return.
- Cost per click (CPC) surfaces cost inflation before it reaches ROAS.
- Lifetime value (LTV) keeps short-term ROAS targets aligned with long-term profitability.
For example, a low CPL paired with low ROAS signals poor lead quality. A higher-than-average CPL paired with a high ROAS suggests your leads are more qualified, in which case your CPL benchmarks may simply need to be recalibrated upward.
How to achieve maximum ROAS?
Singular helps you get the most out of your marketing
ROAS vs. ROI: understanding the difference
ROAS and ROI are related but measure different things. ROAS measures revenue generated per dollar of ad spend, and doesn’t account for cost of goods, operations, or overhead. ROI measures net profit after all costs, showing whether the business is actually making money. A campaign can show strong ROAS while producing negative ROI if operating costs are high, which is why ROAS should always be read alongside total business profitability, not as a standalone verdict.
Measuring ROAS in a privacy-first world
App Tracking Transparency (ATT) reduced IDFA availability to roughly 15 to 30% opt-in rates, so most iOS attribution now flows through privacy-preserving frameworks rather than deterministic device-level tracking. That changes how ROAS gets measured.
iOS: SKAdNetwork and AdAttributionKit
SKAdNetwork (SKAN) is Apple’s privacy-preserving install attribution framework, and AdAttributionKit (AAK) is its successor, with full interoperability with SKAN. For ROAS, both mean the same thing: data arrives aggregated and delayed, user-level attribution is unavailable for opted-out users, and down-funnel metrics like ROAS and LTV are limited without a well-designed conversion value schema.
This is where Singular’s SKAdNetwork solution does the heavy lifting: modeled conversion values recover cohorted KPIs, and near real-time predictive D7 LTV lets ad partners optimize campaigns even inside SKAN’s constraints. It’s part of why iOS-heavy channels can show lower early-window ROAS in aggregated data, the revenue is there, it just becomes visible later and in less detail.
Android: GAID remains active
Google announced in October 2025 that it was retiring most Privacy Sandbox technologies, including the Attribution Reporting API, across both Chrome and Android. The Google Advertising ID (GAID) remains active with no confirmed deprecation date, so Android attribution continues to support deterministic, user-level measurement.
Triangulating measurement
With iOS signal loss and increasingly complex journeys, teams increasingly combine attribution with multi-touch attribution (MTA) for tactical optimization, marketing mix modeling for a privacy-safe macro view, and incrementality testing to measure true causal impact. Standard platform ROAS measures correlation. Incremental ROAS asks the harder question: would that conversion have happened anyway? Singular Incrementality answers it by comparing a test group exposed to ads against a control group that isn’t, isolating the real lift your spend created.
How Singular helps you measure and improve ROAS?
Accurate ROAS across a fragmented media landscape needs a unified data foundation. Here’s how Singular closes the gaps that quietly distort it, each tied to a specific part of the platform.
Measure true ROAS, including ad revenue
Most tools count only in-app purchases, which understates ROAS for any app that also earns from ads. Singular’s ad monetization attribution folds ad revenue into the ROAS formula alongside IAP automatically, so you’re measuring the actual value of a user cohort instead of half of it.
Aggregate every cost source
Singular’s cost aggregation pulls spend from 1,200+ cost connectors and 10,000+ media and technology partners, including Google, Meta, Apple Search Ads, AppLovin, ironSource, and Liftoff, into one platform. That gives you ROAS across your entire portfolio, not just the channels you can pull by hand.
Recover iOS ROAS under SKAN
For iOS specifically, Singular’s SKAN solution includes conversion value optimization, predictive analytics, and fraud protection, giving you the most accurate read on iOS performance your measurement window allows.
See ROAS at the creative level
Singular tracks ROAS down to the campaign, publisher, creative, and keyword. With Creative IQ, you can view individual ad assets side by side with their ROAS data, so you can see exactly which creative is driving returns and double down on what works.
Validate with incrementality
Platform-reported ROAS carries self-reporting bias, since platforms can claim credit for conversions that would have happened anyway. Singular Incrementality runs holdout tests to confirm whether your reported ROAS reflects real, incremental business growth before you make major budget shifts.
Put together, attribution, cost aggregation, and revenue data including ad monetization give marketers the complete view required to scale intelligently. As an independent mobile measurement partner (MMP), Singular delivers accurate, actionable ROAS, not directional estimates. Explore the marketing analytics platform.
How to achieve maximum ROAS?
Singular helps you get the most out of your marketing