How app spend and costs move from Diwali to Christmas, ahead of 2026’s tighter calendar
943B
Ad impressions
4.6B
Installs
$2.4B
Ad spend
28
Markets
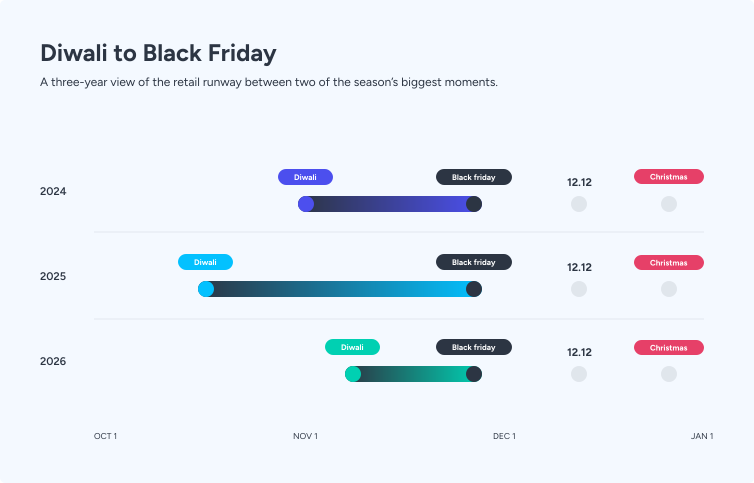
Diwali 2026 falls on Sunday, November 8. Singles Day (11.11) comes three days after Diwali, and Black Friday (November 27) is 19 days after Diwali. In 2025, that stretch ran 39 days, so stages of the season that used to sit weeks apart now overlap.
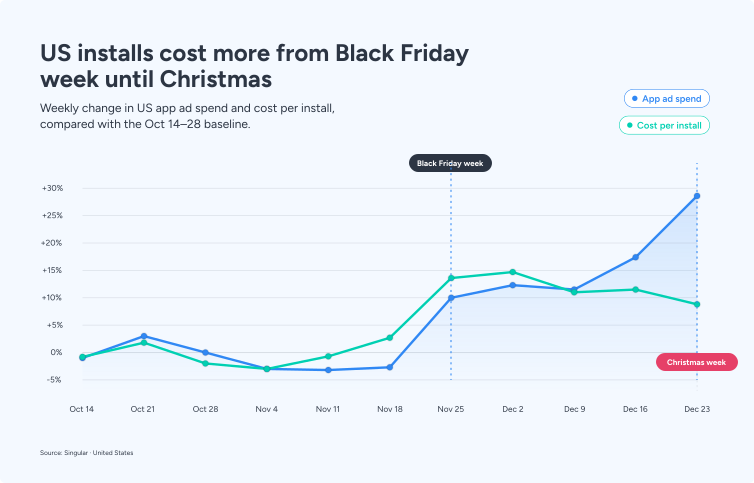
App ad costs don’t follow the shopping calendar. In India, ad spend peaks two days after Diwali, and installs that week cost less than in the week before. In Asia, 11.11 and 12.12 barely move app budgets. But, from Black Friday week, installs get more expensive in the US and in Asia for about a month. The biggest week of the season comes after Christmas, when installs cost less than they do during Christmas week.
This report walks through the season in order, from new creative a month before Diwali to the first week of January, and ends each stage with what to do and the 2026 dates to do it by. It’s built on Singular’s attribution and cost data for India’s 2024 and 2025 Diwali seasons and for 11.11, Black Friday, 12.12, and Christmas in 2025: 943 billion ad impressions, 4.6 billion installs, and $2.4 billion in ad spend across 28 markets. Partner insights from AppTweak, RZR, TikTok, M+C Saatchi Performance, and Affle provide store, purchase, platform, and shopper data.
+15%
India’s app ad spend per day in the two weeks around Diwali, compared with July
16%
Lower Android cost per install in India from Diwali to a week after than in the week before
+13%
US cost per install in Black Friday week, compared with mid-October
+30%
App ad spend per day in the week after Christmas, compared with mid-November
What you will learn
01
The two moments when India’s market moves to new creative, and when top shopping apps change their store listings.
With insights from AppTweak on Diwali store listings.
02
Which days carry India’s festive app spend.
With insights from RZR on when commerce buyers start spending, and M+C Saatchi Performance on India’s early festive sales.
03
Which Diwali week buys installs for less, and when costs start to climb.
With insights from RZR on what festive buyers cost and are worth.
With insights from AppTweak on Singles Day downloads, TikTok on Mega Sales shoppers in Southeast Asia, and M+C Saatchi Performance on 11.11 shoppers.
04
How much more US installs cost from Black Friday, and for how long.
With insights from TikTok on peak-week creative, and M+C Saatchi Performance on Cyber Week sales.
05
Why the week after Christmas is the best-value week of the season.
With insights from M+C Saatchi Performance on holiday gift budgets.
06
A dated plan for the rest of the season, to January 4.
With insights from TikTok on early holiday search, M+C Saatchi Performance on why shoppers stall, and Affle on category-led planning.
The festive timeline
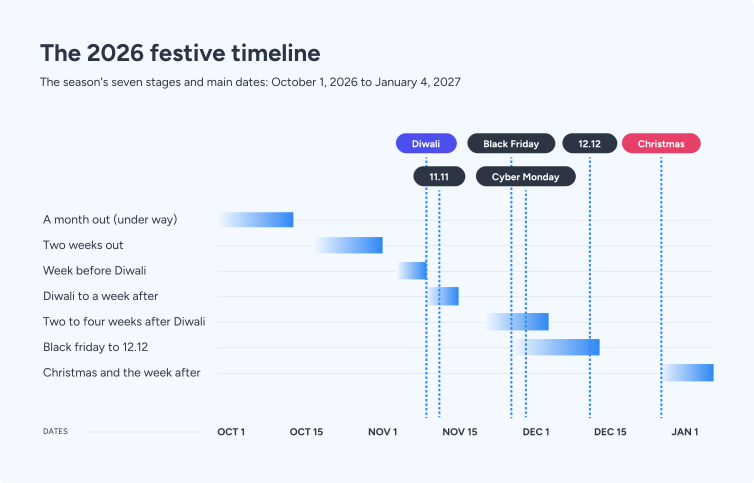
The season is divided into seven stages, dated for 2026. Each section of the report carries its stage as a tag.
OCTOBER 1 – 14
A month out: Already underway spend moves to new creative.
OCTOBER 22 – 28
Two weeks out: more advertisers switch on.
NOVEMBER 1 – 7
The week before Diwali : more money chases the same installs.
NOVEMBER 8 – 15
Diwali to a week after : the market’s ad spend peaks, and installs cost less than the week before. Singles Day (11.11) falls this week.
NOVEMBER 23 – DECEMBER 8
Two to four weeks after Diwali : India’s install costs climb week by week, and a second wave of new creative goes live (November 26 to December 2).
NOVEMBER 24 – DECEMBER 15
Black Friday to 12.12: installs cost more in the US and in Asia.
DECEMBER 22 – 4
Christmas and the week after: the biggest week of the season, with installs cheaper than in Christmas week.
Part 1: Diwali in India
Diwali is India’s biggest moment for app marketers, and the money doesn’t move all at once. Creative changes first, more advertisers arrive next, and spend peaks after the festival itself. We followed two full Diwali seasons, day by day, to see when each of those moves happens and what it does to the price of an install.
New creative arrives a month before Diwali, and again three weeks after
A MONTH OUT, AND TWO TO FOUR WEEKS AFTER DIWALI
Festive plans usually start with the budget, but in India, the first move shows up in creative, weeks before ad spend rises.
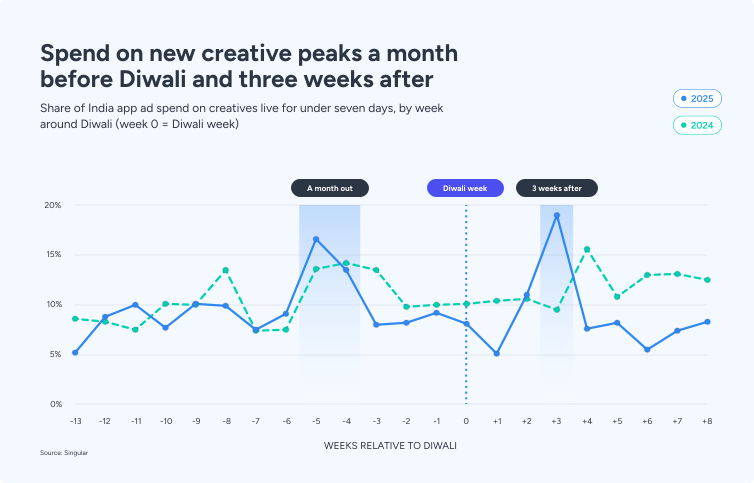
Four to five weeks before Diwali in 2025, 15% of app ad spend in India went to creatives that had been live for less than a week. Earlier in the season, that share was about 9%. In 2024 it peaked at the same point, at 14%.
That’s when the market’s creative changes over. By Diwali week, the share of spend on new creatives was back to 8%, and 81% of the week’s spend ran on creatives that had been live for more than a month (76% in 2024). The creative that carries Diwali is the creative that went live four to five weeks earlier.
A second wave follows three weeks after Diwali. New creatives took 19% of spend that week in 2025 and 16% in 2024, the highest weekly share between July and December in either season. It fell on November 7 to 13 in 2025 and November 18 to 24 in 2024, so it tracked Diwali rather than a calendar date. It reads like a post-festival refresh, with budgets moving onto fresh creative once the Diwali ads have run their course.
The change shows up in where the money goes more than in how many creatives get made. New launches rose 51% in the weeks a month out in 2025 and 10% in 2024, yet the share of spend on new creative peaked in the same weeks in both seasons.
These are the weeks the market moves, which makes them the baseline to plan against. AppTweak’s store data points the same way: all five of the top 10 shopping apps that ran Diwali content on Google Play in 2025 started it at least 12 days before the main day.
15%
Of India’s app ad spend went to creatives under a week old, four to five weeks before Diwali (2025)
19%
Went to new creatives three weeks after Diwali, the highest weekly share from July to December (2025)
81%
Of Diwali-week spend ran on creatives live for more than a month (2025)
WHAT TO DO IN 2026
1. The market’s biggest pre-Diwali creative refresh comes four to five weeks out, October 1 to 14 this year. If yours isn’t live yet, launch it now, to give it time in market before the peak days from November 8.
2. Put festive store listings live by October 27, at least 12 days before Diwali. Brief your next round of creative now.
3. Three weeks after Diwali is November 26 to December 2 in 2026, the same week as Black Friday and Cyber Monday.
PRO-TIP
Singular’s Creative IQ tags every video and image with AI and reports each creative’s installs, ROAS, CPI, and retention across networks. Check it two weeks after launch to see which Diwali concepts have earned budget before the peak, and again before your second round goes live.
PARTNER CONTRIBUTION
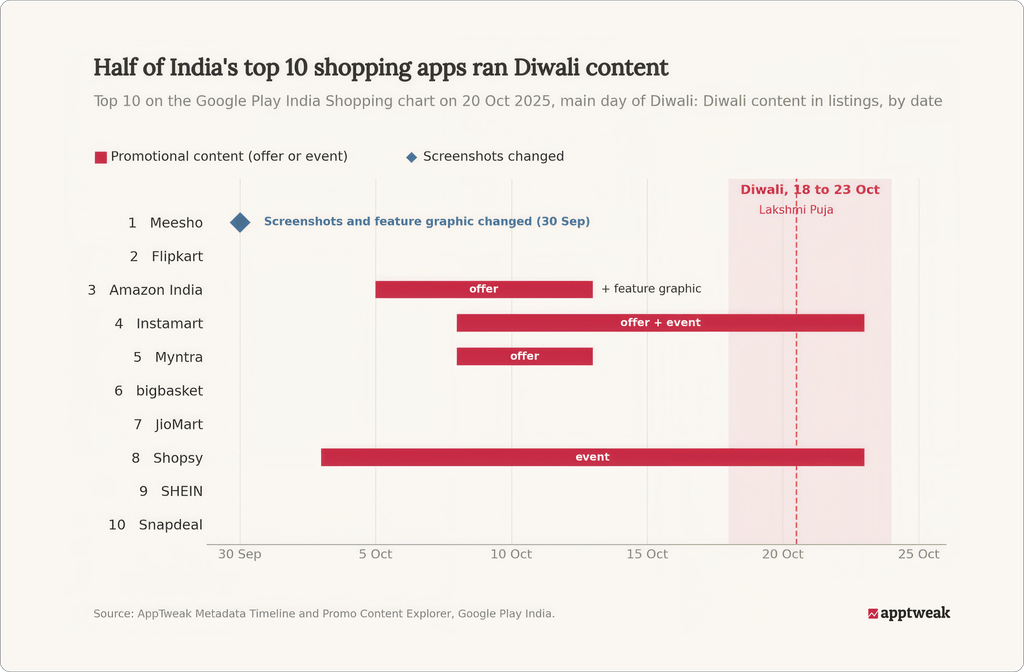
Half of India’s top 10 shopping apps ran Diwali content in their Google Play listings
AppTweak looked at the top 10 shopping apps on the Google Play India chart on 20 October 2025, the main day of Diwali (Lakshmi Puja), and checked each listing for Diwali content. Five of the ten had some. Screenshots were the less common route: only Meesho changed its screenshots and feature graphic. Amazon India, Instamart, Myntra, and Shopsy used Google Play’s promotional content to run Diwali offers or events, and Amazon India also updated a feature graphic.
Marketers going into Diwali 2026 should note that the timing is important. All five started their Diwali content at least 12 days before the main day. Amazon India and Myntra’s promotions ended on 12 October, six days before the festival began on 18 October, while Instamart and Shopsy ran theirs through 22 October. With Diwali on 8 November in 2026, the same lead times would point to 19 to 27 October.
At Diwali, non-retail apps implement festive creatives too
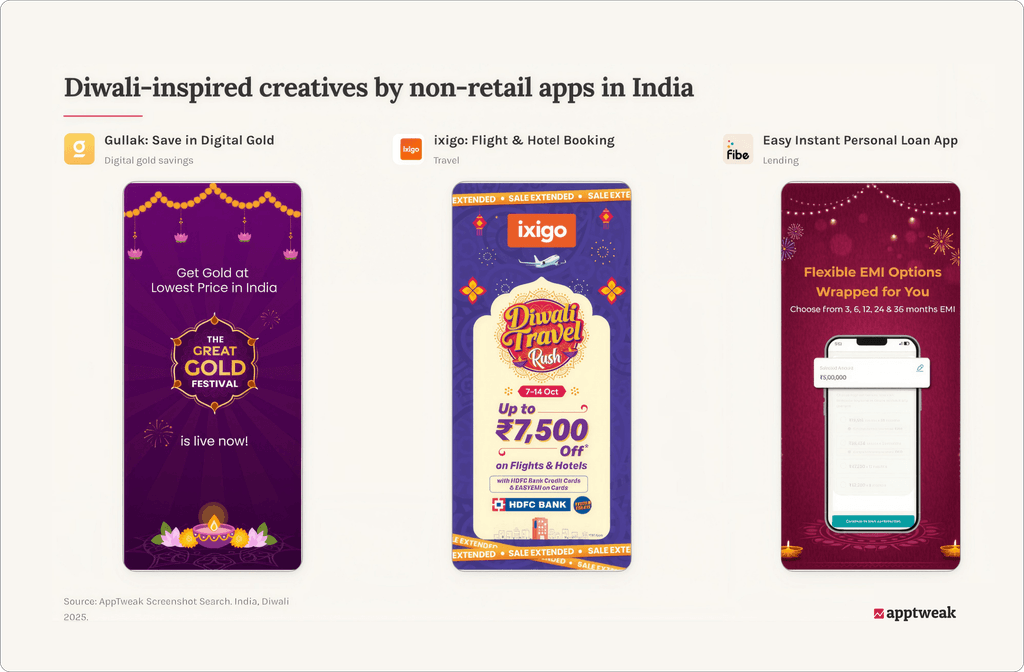
In the week around Diwali, the apps refreshing their App Store creative in India reach well beyond shopping. In AppTweak’s screenshot library, three examples from very different categories all led with a festival-specific first screenshot for Diwali 2025:
In each case, the festive treatment lands on the first screenshot, the highest visibility asset in the listing, while the rest stay evergreen. These apps are treating the store listing as a seasonal channel and placing their festive message where a user looks first.
The takeaway for marketers is that festive visibility in India can be a competitive advantage. If a category has any seasonal angle, whether gold at Dhanteras, travel over the holiday, or credit for festive spending, competitors are claiming it in the store to connect to users during this occasion. Running default creative through the peak cedes that ground. In AppTweak, screenshot and metadata timelines show who changed what, and when, so teams can see how competitors dress their listings for the season and plan their own. Explore it for yourself with AppTweak’s free trial.
Festive seasons like Diwali aren’t only for the shopping app vertical. We see finance, travel and lending apps tailoring their store listings weeks ahead to compete for the same seasonal attention. Any category with a seasonal hook can do the same, through festive screenshots, promotional content and region-specific store listings.
Alexandra De Clerck
Chief Marketing Officer, AppTweak
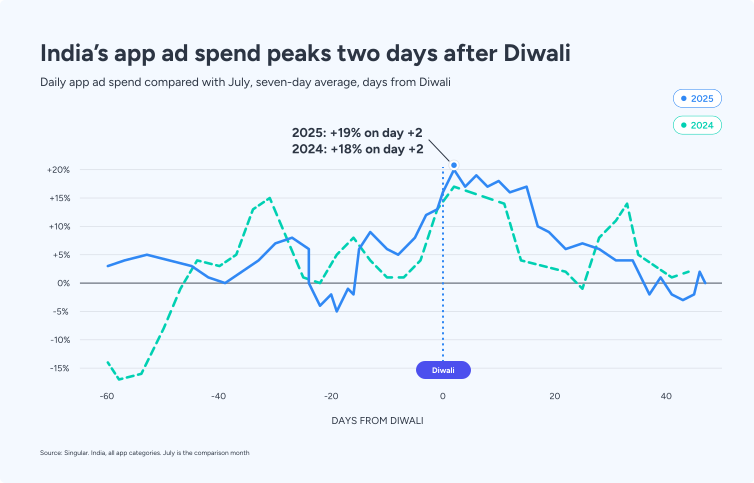
India’s app ad spend peaks two days after Diwali
TWO WEEKS OUT TO DIWALI WEEK
Diwali day is the date everyone plans around. App ad spend tells a slightly different story, with the market’s heaviest days coming just after it.
App advertisers in India spent 15% more per day in the two weeks around Diwali in 2025 than in July, and 11% more than in the three weeks before. The busiest seven days centered on two days after Diwali, at 19% above July, and the 2024 peak fell on the same day as well.
Advertisers switch on well before the money peaks. From two weeks before Diwali, 9% more advertisers spent on a typical day than in July, and the count stayed up into November. In 2024 the rise started earlier, about five weeks out.
The lift comes from part of the market. About half of the advertisers that spent steadily before the season raised their daily spend in the two weeks around Diwali, and the other half spent the same or less. Across the market, spend stayed above its July level for three weeks after Diwali, 10% higher in 2025 and 8% in 2024.
Shopping apps run on a different clock. Their buyers start spending days before each festival, as RZR’s commerce data in the box below shows, and M+C Saatchi Performance’s figures on India’s festive sales show how early that starts. If you sell in your app, your peak may come before the market’s.
+15%
App ad spend per day in the two weeks around Diwali, compared with July (2025)
+19%
In the busiest seven days, centered two days after Diwali (2025)
81%
More advertisers spending on a typical day from two weeks before Diwali (2025)
TRAP QUESTION FOR YOUR TEAM
Is your biggest budget day Diwali itself, or the two days after it, when the market spends the most?
WHAT TO DO IN 2026
1. Expect more advertisers in the auction from late October, about two weeks before Diwali.
2. Put your heaviest days on Diwali and the days just after it. If the pattern holds, the market’s peak falls around Tuesday, November 10, the day before 11.11.
3. If you run a commerce app, start earlier, while buyers are already spending.
PRO-TIP
When buyers move before the festival, every festive touchpoint should take them straight to the offer. Singular Links take users from an ad, email, SMS, or social post to the right screen in your app, even when they have to install first, and tie the click to the install and the purchase that follows.
PARTNER CONTRIBUTION
The festival is the headline, but buying starts earlier
Wait until festival day to launch, and you could miss shoppers already spending. Across the three days before and three days after festivals, daily commerce installs were 25% above normal, D1 purchasers were 27% higher and D1 revenue was 30% higher.
Before Raksha Bandhan and Diwali, D1 revenue approached festival-day levels in the two preceding days. Ahead of Ganesh Chaturthi, it rose for three consecutive days, gaining approximately 20% across that stretch.
Festival day gets the spotlight, but shoppers are already spending before it arrives. RZR’s data shows that festive demand brings both more buyers and higher acquisition costs. Start early, keep budgets flexible, and let purchasers’ value guide how far you scale. The goal is profitable growth, not simply more installs.
Manu Pillai
Head of Sales INSEA, RZR
PARTNER CONTRIBUTION
Diwali: India’s festive shopping boom is moving beyond the metros
India’s festive shopping season kicked off with quite a bang in 2025. In just the first 11 days, starting September 22, around 90 million shoppers generated over ₹60,000 crore in ecommerce sales, marking a 20–22% jump from the previous year. But here’s the number that really catches our attention. According to Redseer, 60–65% of these shoppers came from Tier-2 and smaller cities. That’s a pretty big reminder of where India’s festive shopping momentum is coming from.
So, for starters, festive ecommerce can no longer be planned primarily around metro audiences. Shoppers in smaller cities are already showing up in huge numbers, and brands need to meet them there.
The takeaway? Think beyond the metros when planning festive campaigns. That means understanding regional shopping behaviors, adapting creatives and messaging to local preferences, and making sure your media investment follows where the shoppers actually are. Because the next big festive sale might come from a city you’ve barely been targeting.
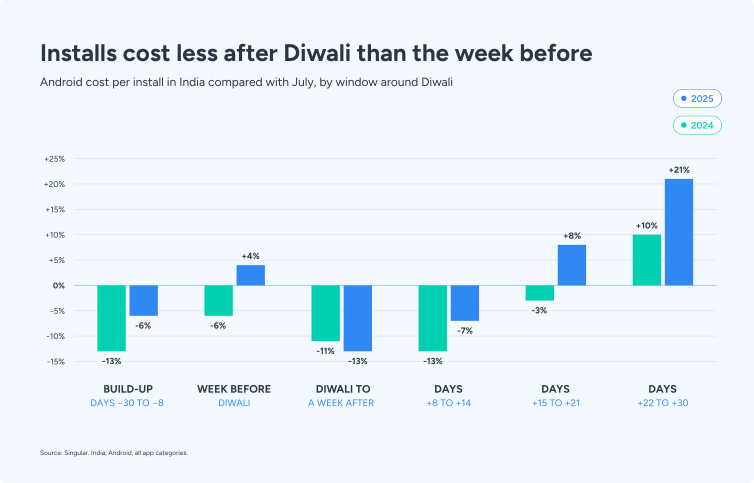
Installs cost less the week after Diwali than the week before
DIWALI TO A MONTH AFTER
More money in the market usually means pricier installs. Around Diwali, the opposite happens for a week, and even a few days’ difference in timing can change what you pay.
On Android, installs in India cost 16% less from Diwali day to a week after than in the week before Diwali in 2025, and 6% less in 2024. That same week holds the market’s busiest days.
The week before Diwali is the crowded one. In both seasons, the cost of an install rose 9% to 10% that week compared with the three weeks before it. In the seven days up to Diwali, advertisers spent about 7% more than in the seven days before, and got fewer installs for it. Once Diwali arrives, the cost of an install falls to 13% below July (11% in 2024).
From two weeks after Diwali, the cost climbs week by week. By the fourth week after Diwali, Android installs cost 21% more than in July in 2025, and 10% more in 2024.
Impression prices explain part of the 2025 curve. Android CPMs ran 16% to 20% above July before and during Diwali, but installs per impression rose further, by 24% to 27%, so each install still cost less. Google carries most Android spend in India, 55% to 61% in 2025, and that’s where installs per impression rose most. After Diwali, installs per impression fell back close to July (+4%) while CPMs stayed 11% above it, and installs got more expensive. In 2024, CPMs stayed 2% to 8% below July throughout.
Two smaller patterns held in both seasons. Sunday was the cheapest day of the week for an install, 4% below the other days in 2025 and 9% in 2024. Day-one retention in Diwali week stayed level with July, at about 17% to 18%, so the cheaper installs didn’t come with weaker first days.
Commerce apps may not see the same dip. RZR found commerce CPMs and CPIs about 17% higher on festive days than on normal days, with purchases rising faster than costs. Shopping apps compete for the same buyers on the same days, which the average across all apps doesn’t show.
-16%
Android cost per install from Diwali to a week after, compared with the week before (2025, -6% in 2024)
+9–10%
Cost per install in the week before Diwali, compared with the three weeks before it (both seasons)
+21%
Android cost per install in the fourth week after Diwali, compared with July (2025)
TRAP QUESTION FOR YOUR TEAM
If CPMs rise 20% in the run-up to Diwali, does your cost per install have to rise too?
WHAT TO DO IN 2026
1. On Android, shift install budget from the week before Diwali (November 1 to 7) into Diwali and the week after (November 8 to 15). Commerce apps should weigh this against buyers who move earlier.
2. Plan for installs to cost more from about November 23, two weeks after Diwali and the week of Black Friday.
3. Track installs per impression alongside CPM. In 2025, CPMs rose and installs still got cheaper.
4. Where you can, give Sundays a little more budget. They were the cheapest days for installs in both seasons.
PRO-TIP
Singular aggregates cost data from 1,200+ cost data connectors with attribution, so you can track cost per install by network every day and catch the climb after Diwali in its first week.
PARTNER CONTRIBUTION
More shoppers ready to buy, at a higher price
Festive shoppers don’t just download. They buy.
In RZR’s August–December analysis of the previous year, daily commerce app installs rose 52% on festive days versus normal days, while day-one (D1) purchasers grew 60% and D1 revenue increased 57%.
That demand came at a premium: CPMs and CPIs rose approximately 17%. But the share of new users purchasing on D1 increased from 8.8% to 9.5%. Higher acquisition costs were accompanied by stronger purchase conversion.
For marketers, CPI is only the starting point. Track cost per purchaser and revenue relative to spend to decide whether to scale, then follow revenue beyond D1. More buyers create opportunity; their value determines how much you can afford to pay.
Part 2: From 11.11 to New Year
After Diwali, the calendar fills up fast. 11.11, Black Friday, Cyber Monday, 12.12, and Christmas all land in about six weeks, and each comes with its own sales noise. App budgets don’t follow every one of them. We compared each event week with the weeks around it, and with markets that skip the event, to separate the dates that move app spend from the ones that simply sit inside a busy December.
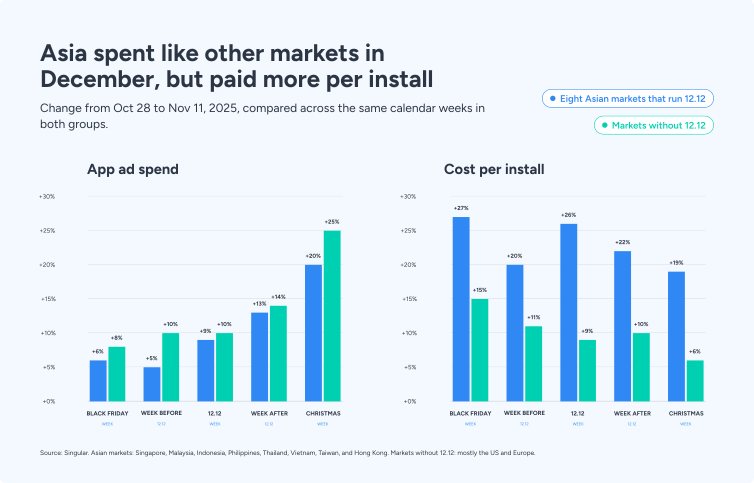
11.11 and 12.12: Asia’s app spend peaks at year end, not on sale days
11.11 TO 12.12
In Southeast Asia, Taiwan, and Hong Kong, double-day sales like 11.11 and 12.12 dominate the shopping calendar. App advertisers treat them differently, and the real pressure on budgets builds later, in December.
Across Southeast Asia, Taiwan, and Hong Kong, neither sale day moved app ad budgets in 2025. Ad spend in the 11.11 week sat 6% below early October, and the 12.12 week was 9% above early November.
11.11 week spent like the weeks around it, and November 11 itself looked like any other Tuesday. 12.12 week was higher, but markets that don’t run 12.12, mostly the US and Europe, rose 10% over the same weeks. In the eight Asian markets, ad spend kept climbing after 12.12 and peaked in the week after Christmas, 24% above early November.
Costs moved earlier than ad spend. Installs in these markets cost 27% more than in early November in Black Friday week and 26% more in 12.12 week, against 15% and 9% more in markets without 12.12. The rise shows in six of the eight markets and doesn’t come from any one advertiser. By the week after Christmas, the premium had eased to 13%.
Two markets went beyond December’s rise in the 12.12 week: Taiwan (+24%) and Indonesia (+15%). Those are the places where app advertisers treated 12.12 as a moment of its own.
Shoppers do move around 11.11. AppTweak found shopping app downloads in Singapore and Taiwan rising in the 11.11 week in both 2024 and 2025, mostly in the week itself.
-6%
App ad spend in the 11.11 week, compared with early October (eight Asian markets)
+26%
Cost per install in the 12.12 week, compared with early November (+9% in markets without 12.12)
+24%
App ad spend in the week after Christmas, compared with early November (eight Asian markets)
WHAT TO DO IN 2026
1. Unless you run a shopping app, plan Asian budgets around December rather than the sale days.
2. Budget for installs is about a quarter more expensive from Black Friday week, (November 24 to 30) through 12.12, which falls on Saturday, December 12.
3. In Taiwan and Indonesia, expect more competition in the 12.12 week.
4. Shopping apps: have store listings, creative, and budget in place before the 11.11 week. In 2026, 11.11 falls three days after Diwali, inside India’s busiest week.
PARTNER CONTRIBUTION
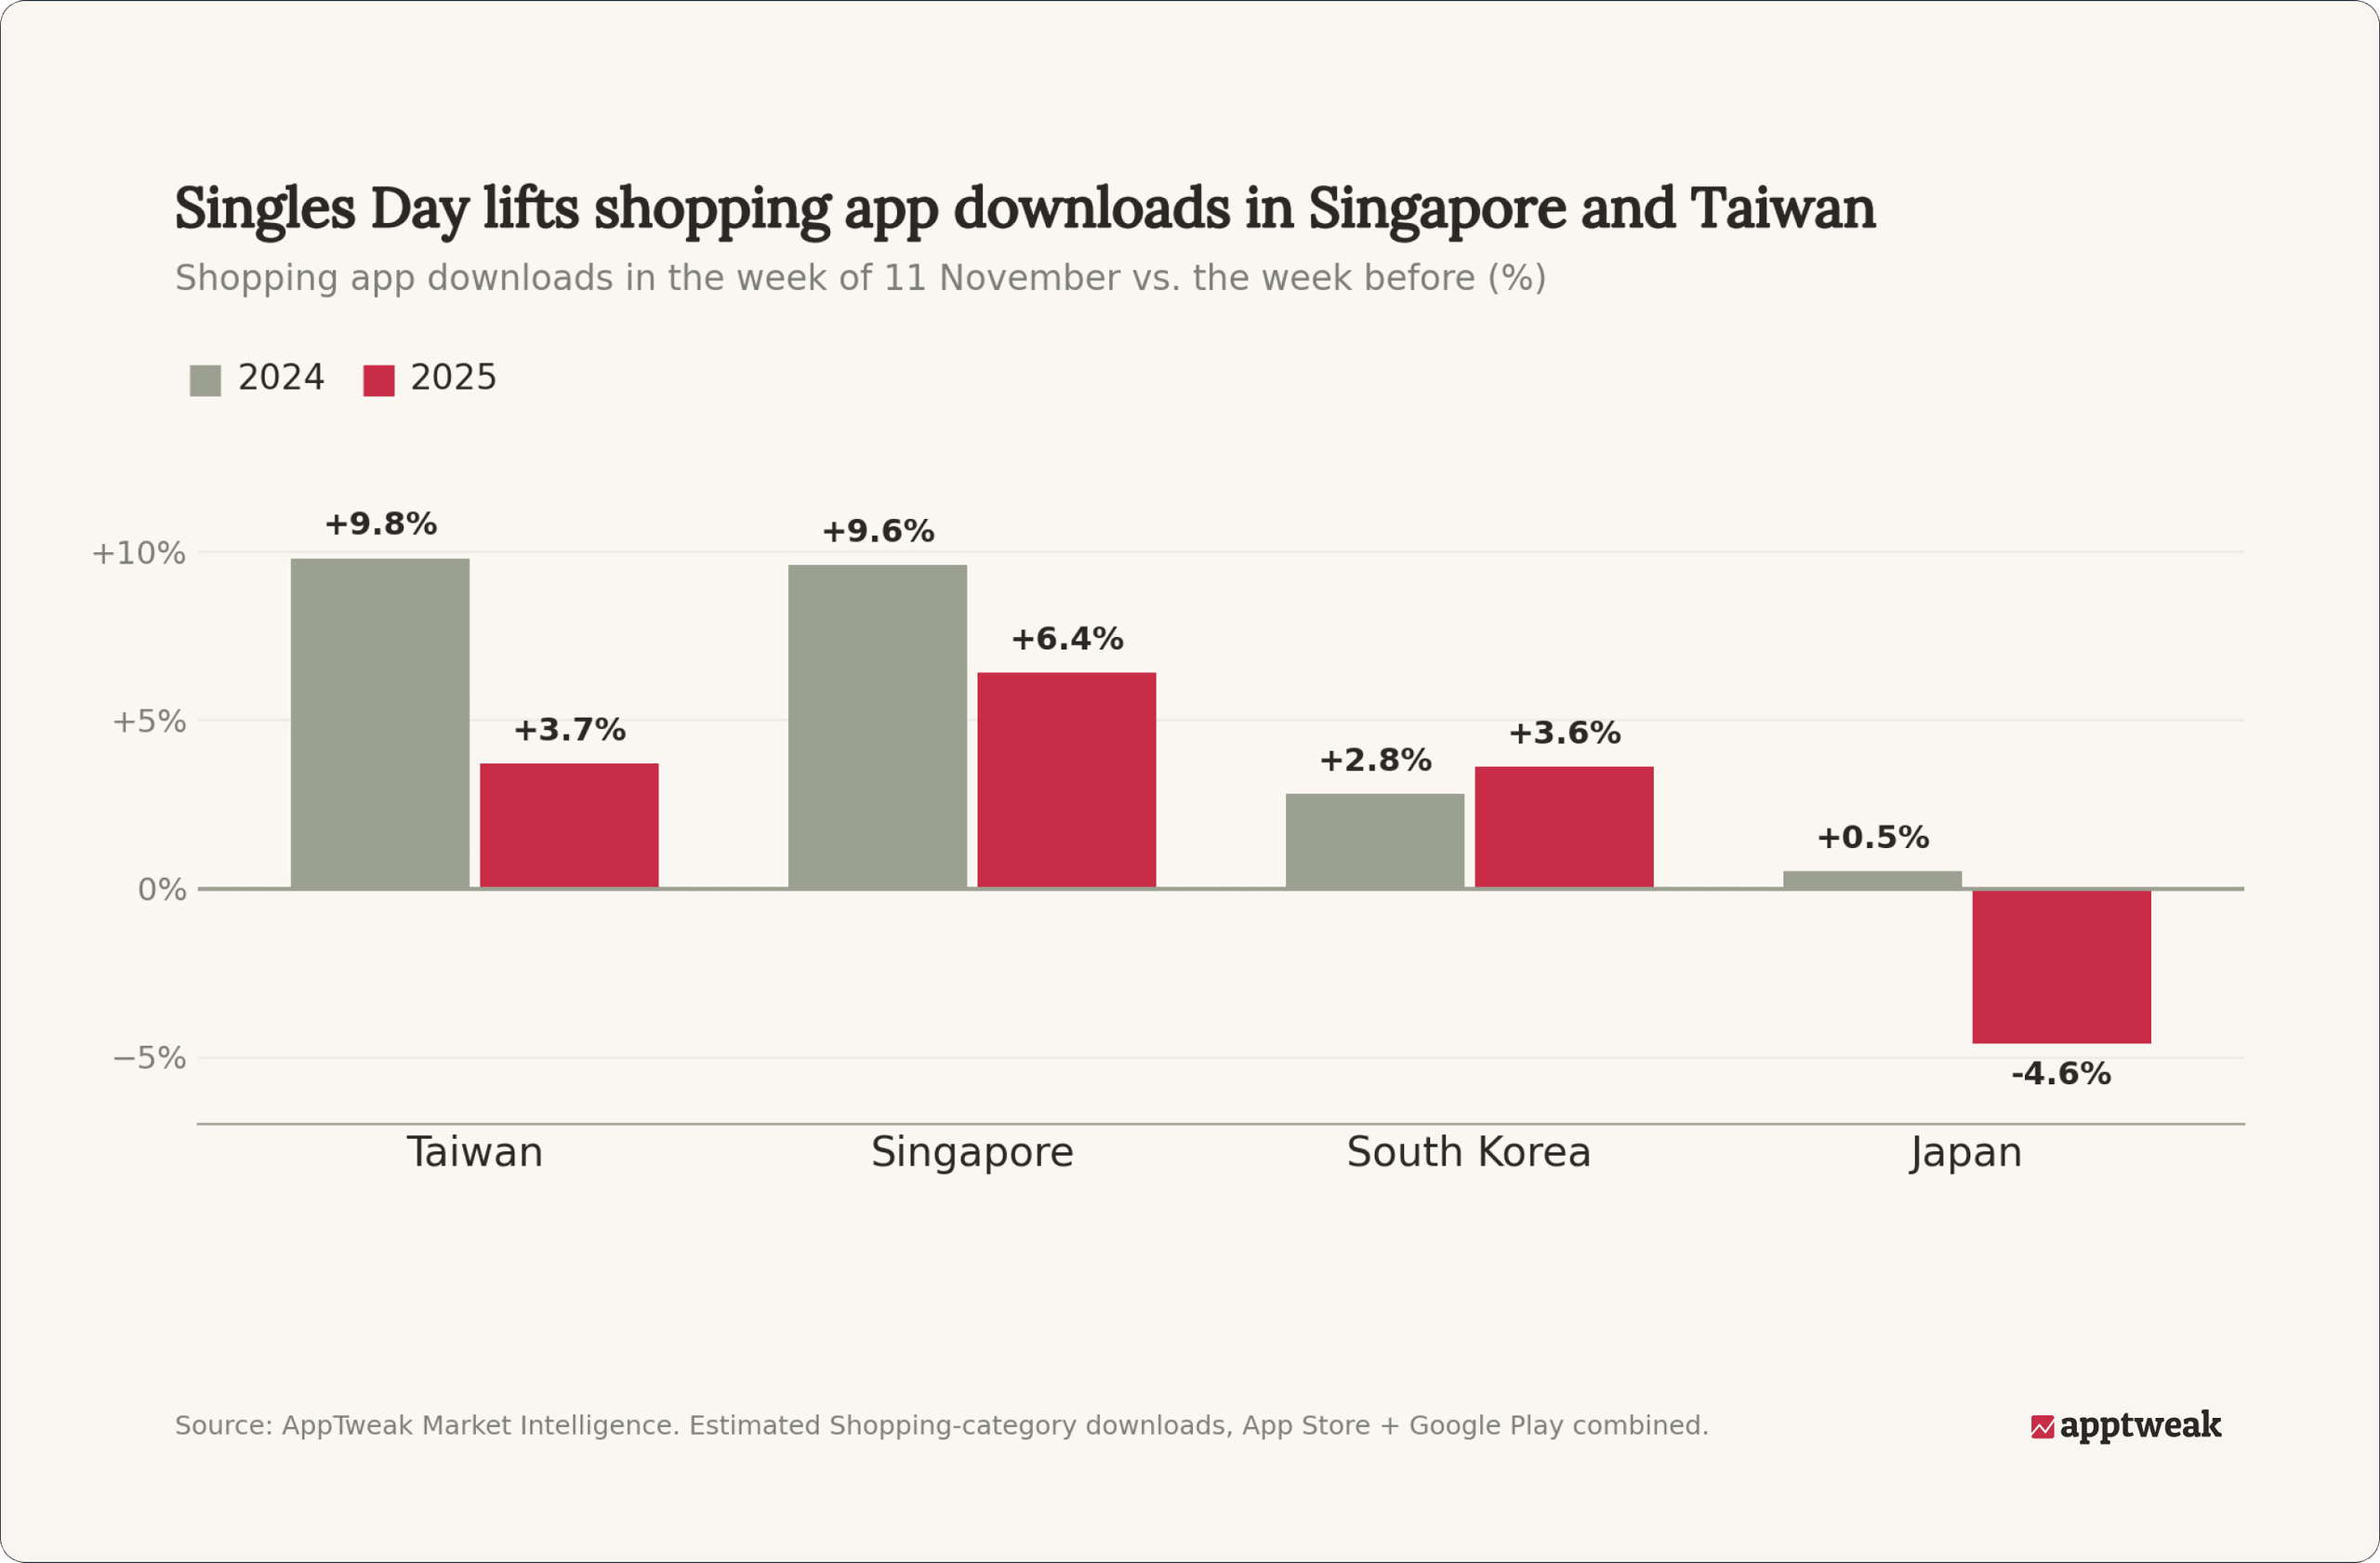
Singles Day lifts shopping app downloads in Singapore and Taiwan
Across 2024 and 2025, the clearest Singles Day (November 11) download lifts were in Singapore and Taiwan. In the week of 11 November, combined App Store and Google Play downloads in the Shopping category rose above the prior week in both markets and both years: Singapore up 9.6% in 2024 and 6.4% in 2025, Taiwan up 9.8% and 3.7%. South Korea saw a smaller rise (2.8% and 3.6%), and Japan was flat to down (+0.5% in 2024, -4.6% in 2025).
PARTNER CONTRIBUTION
In Southeast Asia, Mega Sales are a shopping habit, not a one-day spike
In Southeast Asia, 11.11 and 12.12 are Mega Sales, the big double-date sale days. Shoppers come back to them again and again, so they work less like one-off events and more like a habit. In Vietnam, 70% of online shoppers buy online every week and spend more than an hour a day browsing.¹ Across the region, 90% of TikTok users shopped during Mega Sales in 2024.² Brands on TikTok see 1.6x more orders during Mega Sales campaigns.³
Shoppers arrive already in the market and browsing often. They are used to finding products through content and creators, in formats that feel native rather than promotional.
For marketers, creative works best when it is creator-led, invites people to take part and feels native to shopping. The opportunity goes beyond conversions on the sale day. It lies in steady discovery and order growth around the shopping moments users now expect.
Sources
NielsenIQ, E-Commerce Shopper Understanding, NIQ Syndicated Report, 2024. Survey of 800 respondents in Vietnam.
Kantar Profile, study commissioned by TikTok on shopping behavior during shopping seasons, 2024. Survey of 4,500 TikTok users and non-users in Southeast Asia.
TikTok internal data, Southeast Asia, 2026.
PARTNER CONTRIBUTION
11.11: Shoppers are discovering more, and AI is helping them decide
China’s 11.11 Shopping Festival has always been a big deal for bargain hunters. But the 2025 numbers tell us something interesting about what people are buying. According to Alibaba, 30% of products generating over RMB100 million in sales were new products, while another 14,246 new products crossed RMB1 million in sales each. Clearly, shoppers weren’t just showing up to buy their usual favorites at lower prices. They were discovering new ones, too. And AI was lending a hand. Alibaba reported that its AI-powered search improved result relevance for complex shopping queries by 20 percentage points, helping shoppers navigate products, reviews, recommendations, and coupons.
Here’s where things get interesting for marketers. Shopping festivals are increasingly becoming opportunities to introduce consumers to products they hadn’t even considered buying. And AI is making that discovery process easier by understanding what shoppers actually want, even when they can’t quite put it into words.
The takeaway? Don’t save all your effort for discounts on your bestsellers. Use these high-attention moments to introduce new products, build consideration, and make discovery easier. And as AI becomes more involved in helping shoppers choose, clear product information, useful reviews, and relevant recommendations become even more important. After all, getting discovered is only half the battle. You still need to give shoppers a reason to choose you.
Black Friday starts a month of costlier US installs
BLACK FRIDAY TO CHRISTMASS
Black Friday is the biggest date on the US shopping calendar. For app marketers, its real effect shows up in the weeks after it, in what each install costs.
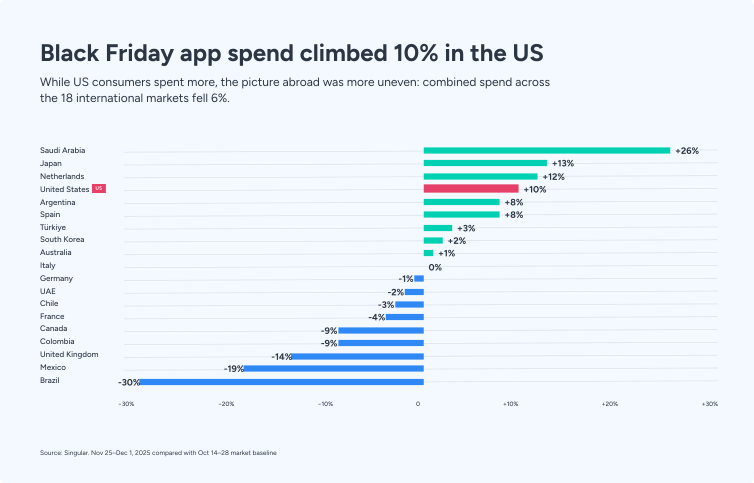
In the US, installs cost 13% more in Black Friday week 2025 than in mid-October, and stayed 11% to 14% more expensive for the three weeks after. US app ad spend rose 10% that week and kept climbing toward Christmas.
The week before Black Friday was quiet, with US spend 3% below mid-October. In Black Friday week, ad spend stepped up while the number of installs it bought fell by about 3%, so each install cost more, and the premium held until Christmas week.
Outside the US, Black Friday week looked different. Across the other 18 markets, app ad spend fell 6%, and installs still cost 7% more than in mid-October. Installs got more expensive even where app advertisers spent less.
For app marketers, Black Friday mostly changes what installs cost. In the US, higher prices last about a month, and elsewhere, the week costs more without the market spending more.
TikTok and M+C Saatchi Performance add the platform and shopper side of Black Friday later in this section.
+13%
US cost per install in Black Friday week, compared with mid-October
11%–14%
More per US install in each of the three weeks after
-6%
App ad spend outside the US in Black Friday week, while installs cost 7% more
WHAT TO DO IN 2026
1. In the US, the budget for installs was 11% to 14% more expensive from Black Friday week (November 24 to 30) to about December 21.
2. Outside the US, treat Black Friday week as a costlier week rather than a bigger one, unless you sell into it.
3. If you run campaigns in India and the US, plan for higher costs in both at once. In 2026, Black Friday (November 27) and Cyber Monday (November 30) fall in India’s more expensive weeks after Diwali.
PRO-TIP
On Black Friday, a shopper might see an ad on one device, browse your site, and buy in your app. Singular’s web-to-app attribution credits that install to the campaign that started the journey, with web cost data alongside for full ROAS. Affle’s research, in section 7, found that 32% of the shoppers it surveyed switch devices during their shopping journey.
PARTNER CONTRIBUTION
The “Efficiency Outlier” and Full-Funnel Acceleration (NAM & Global)
The Numbers: Last Black Friday/Cyber Monday, brands on TikTok saw Return On Ad Spend (ROAS) increase by +28.4% YoY, Average Order Value grow by +12.1% YoY, and CPMs decline by -27.5% YoY. (Source: Triple Whale, The Black Friday Cyber Monday Breakdown Report). Furthermore, TikTok Shop drove $500M over the BFCM weekend, with a 50% jump in native purchasers. (Source: TikTok Internal Data / Newsroom)
Why it Moved: While the broader industry faced rising ad costs, TikTok successfully collapsed the traditional funnel. 85% of users say TikTok speeds up their decision-making (Source: Kantar Media Reactions 2025). Passive discovery turned instantly into action.
Marketer Takeaway: TikTok is a high-volume performance multiplier. Advertisers should capitalize on the lower entry costs (CPM/CPA) by combining Web Traffic/Smart+ Catalog Ads with TikTok Shop to seamlessly capture demand.
High Creative Agility & Entertainment-Driven Momentum (APAC & EUI)
The Numbers: During peak UK Black Friday campaigns, most creatives burned out after just 1-2 days, yet continuous rotation maintained an 8.1x ROAS(Source: UK Black Friday Campaign 2025 Recap).
Why it Moved: The Q4 market is completely saturated. Shoppers immediately scroll past generic discount ads, but they actively engage with authentic, creator-led content.
Marketer Takeaway: High creative velocity is mandatory. Relying on a single “hero” asset is a major risk; marketers must build a high-volume pipeline (e.g., using Symphony Creative Studio) to test and rotate content every few days.
The Numbers: 45%+ of TikTok’s users are unique to the platform and not on other social platforms (Source: TikTok Marketing Science US Path to Purchase Part 2 Research). TikTok drives 3.5x higher incremental attributed conversions in the same day vs. other channels, and delivers 150% stronger efficiency for customer acquisition (Source: TransUnion Marketing Attribution).
Why it Moved: TikTok reaches a highly engaged, net-new audience that isn’t fatigued by competitor platforms. Furthermore, these unique shoppers spend more: TikTok users outspent non-users on 60% of advertised brands. (Source: Kantar Global Long-Term Value Study).
Marketer Takeaway: TikTok isn’t just shuffling existing demand; it’s bringing net-new, highly valuable shoppers. Marketers must treat TikTok as a prime channel for pure incremental growth during the holidays, rather than just cannibalizing their existing media mix.
“Always-On” Smart+ Automation & Search ROI (Global)
The Numbers: Leveraging automated commerce solutions like Smart+ Catalog Ads delivers a 36% improvement in CPA and a 16% increase in ROAS compared to manual video alone (Source: TikTok Internal Performance Data / TikTok Day Portugal). Overall, TikTok delivers up to 2x more ROI for retail than other media platforms. (Source: TikTok x Deloitte Search & Commerce / Cannes Lions Briefing)
Why it Moved: Holiday shoppers use TikTok Search to validate intent. 48% of TikTok users are more likely to discover new products and immediately purchase them natively. When automation (Smart+) pairs with this high-intent search behavior, the platform dynamically serves the right product to the right person.
Marketer Takeaway: Don’t rely solely on manual campaign creation during peak days. Employ an “Always-On” Smart+ strategy to automate prospecting and retargeting, ensuring you capture high-value users efficiently from early discovery through to last-minute impulse conversions.
Holiday shopping no longer waits for November. On TikTok, holiday searches jumped 49% from September to October, and the brands that start seeding ideas in October are the ones shoppers come back to at Black Friday and through December. In those peak weeks, creative can wear out in a day or two, so a steady flow of fresh, creator-led content matters as much as the budget behind it.
Zeno Du
Head of Measurement, TikTok
PARTNER CONTRIBUTION
Black Friday & Cyber Monday: The deals are getting earlier, and payments are getting smarter
Cyber Monday is still the biggest online shopping day in the US, bringing in a whopping $14.25 billion in 2025, up 7.1% year on year. But Black Friday is catching up, with online spending reaching $11.8 billion, growing 9.1%. According to Adobe, that’s the second consecutive year Black Friday has grown faster than Cyber Monday. And there’s another interesting shift happening at checkout. Buy Now Pay Later (BNPL) accounted for $1.03 billion in Cyber Monday spending, with 79.4% of that spending happening on mobile devices. So, shoppers are making their purchases earlier and increasingly finding flexible ways to pay for them.
What does this tell us? Shoppers aren’t necessarily holding out until Monday for the best deal anymore. As attractive offers appear earlier, there’s less reason to wait. At the same time, affordability isn’t always just about the price tag. Sometimes it’s about when the money leaves your account.
The takeaway? Don’t put all your eggs in the Cyber Monday basket. Give shoppers compelling reasons to convert throughout Cyber Week, and pay attention to what happens at checkout. Flexible payment options, a smooth mobile experience and transparent pricing could make the difference between a completed purchase and another abandoned cart.
App spend peaks the week after Christmas, as installs get cheaper
CHRISTMAS AND THE WEEK AFTER
Christmas week feels like the finish line for many festive plans. In app advertising, the biggest week of the season comes right after it.
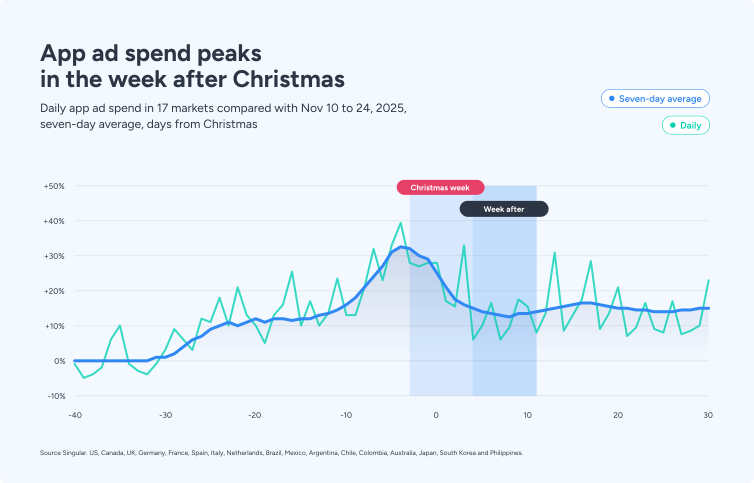
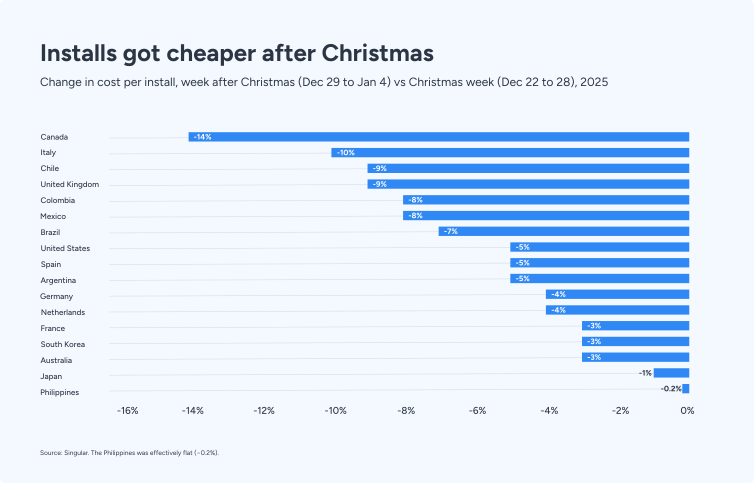
The week after Christmas was the biggest week of the 2025 season. App advertisers spent 30% more per day than in mid-November, and installs cost 6% less than in Christmas week.
Christmas week itself ran 27% above mid-November, led by the US (+31%) and Europe’s largest markets, with Germany up 32%, France 33%, and Italy 39%. From December 29, spend went higher still while installs got cheaper. Cost per install fell in 16 of the 17 markets and held flat in the Philippines, and impressions cost 13% less than in Christmas week. In the US, ad spend in the week after Christmas ran 33% above mid-November, and installs cost 5% less than in Christmas week, back to about mid-November levels (+1%).
Many teams call the stretch from Christmas to mid-January “Q5”. In our data, ad spend stayed 13% to 16% above mid-November into late January, so the season runs well past the New Year.
The same peak shows in Asia, where Christmas is a public holiday in Singapore, Hong Kong, Malaysia, Indonesia, and the Philippines. In the eight 11.11 and 12.12 markets, spend peaked in the week after Christmas, 24% above early November, with installs cheaper than through December.
+30%
App ad spend per day in the week after Christmas, compared with mid-November
-6%
Cost per install in the week after Christmas, compared with Christmas week
16–17
Markets where installs got cheaper after Christmas
TRAP QUESTION FOR YOUR TEAM
Who on your team is buying media on December 29?
WHAT TO DO IN 2026
1. Keep budgets running from December 29 to January 4, the week after Christmas week (December 22 to 28).
2. Keep some budget for January, when ad spend stays above November levels.
PARTNER CONTRIBUTION
Christmas: Shoppers are watching their wallets, but keeping the magic
Christmas shopping in 2026 is shaping up to be an interesting balancing act. US consumer confidence was down 18.5% year on year when PwC conducted its Holiday Outlook survey, and eight in ten consumers planned to use a budgeting strategy. You’d expect that to mean some serious cuts to Christmas shopping, right? Well, not quite. Planned gift spending was expected to dip by just 2%. And there’s another twist. 64% of consumers said they were prioritising screen-free gifts, rising to 78% among Gen Z. Meanwhile, 29% planned to use AI during their holiday shopping journey, up from 22% the previous year. So, people are increasingly using technology to shop for gifts that help them spend less time with technology. Quite the irony.
And that’s what makes this particularly interesting. Consumers are being more careful with their money, but they’re still finding room for the things that make Christmas special. Gifts, traditions and shared experiences seem to be holding their ground, even as budgets tighten. And while AI is becoming a useful shopping companion, the gifts people want are becoming surprisingly old-school.
In 2026, Diwali: 11.11, and Black Friday fall within 19 days
YOUR 2026 PLAN
The patterns above repeat from one season to the next. What changes in 2026 is the calendar.
In late November 2026, India’s install costs start to climb (from November 23), Black Friday week raises install costs in the US and in Asia (from November 24) and, if the pattern holds, India’s second wave of new creative goes live (from November 26), all within four days. In 2025, Black Friday week came three weeks after India’s costs began to climb. The plan below applies 2025’s patterns, and 2024’s where both seasons agree, to the 2026 calendar.
When in 2026
What to do
Why
October 1 to 14
Diwali creative goes live across the market. If yours isn’t live yet, launch it now
Spend moves to new creative four to five weeks before Diwali, in both seasons
October 22 to 28
Expect more competition
9% more advertisers spend per day from two weeks out
By October 27
Put festive store listings live
Top shopping apps started at least 12 days early (AppTweak)
November 1 to 7
Go lighter on install buying, unless you run a commerce app
The week before Diwali costs more per install. Commerce buyers start early (RZR)
November 8 to 15
Spend hardest
The market’s peak and cheaper installs. 11.11 falls on Wednesday, November 11
November 23 to December 8
Plan for higher install costs in India
Costs climb from two weeks after Diwali
November 24 to about December 21
Plan for higher install costs in the US
11% to 14% more from Black Friday week. Black Friday is November 27, Cyber Monday November 30
November 24 to mid-December
Plan for higher install costs in Asia
About a quarter more from Black Friday week through 12.12 (Saturday, December 12)
November 26 to December 2
Launch your next round of creative
A second wave of new creative came three weeks after Diwali in both seasons
December 29 to January 4
Keep budgets running
The biggest week, with cheaper installs than Christmas week (December 22 to 28)
PARTNER CONTRIBUTION
The “October Flip” & Earlier Market Shifts (NAM & Global)
The Numbers: The holiday window has shifted significantly earlier. TikTok data shows 17M holiday-themed searches in September, jumping 49% to 26M in October. Additionally, 75% of the most viewed and engaged holiday content on the platform is directly linked to retail and shopping. (Source: TikTok Internal Data, Holiday 2026 Narrative)
Why it Moved: The traditional November-only holiday window is dead. The path to purchase is no longer linear; 71% of shoppers say decision-making is actually harder today. While they use AI and search to narrow options, they turn to TikTok’s creator ecosystem for social proof, validation, and authentic reviews. (Source: TikTok Internal Data / Global Shopper Journey Insights)
Marketer Takeaway: Waiting until November to activate means missing the critical wishlist phase. Brands must deploy a two-stage strategy: seed inspiration in October, then aggressively retarget for conversion during BFCM and December.
Expectations set. Now the practical part: getting a first campaign live without burning the budget.
PARTNER CONTRIBUTION
Wishlists, Cold Feet & Checkout
1. The shopping season is getting longer. Much longer.
The takeaway? Get on their wishlist before you fight for a place in their cart. Build awareness in August and September, help shoppers compare their options in October, and focus on conversions in November and December. One idea worth testing? Shift 15–20% of peak-season budget into August–October and see whether getting in early pays off when the spending frenzy begins.
2. Three reasons shoppers get stuck: price, choice overload, and trust.
This is where it gets really interesting, because our instinct is often to assume that if somebody isn’t buying, the problem is price. And obviously price matters, especially in Q4. But the data is much more nuanced than that. We went into our global consumer data, which covers more than 50 markets, and looked at what actually makes somebody more likely to complete an online purchase.
And the biggest purchase motivator? Free delivery. Over 50% said free delivery would make them more likely to buy, compared to 39% for coupons and discounts. Clearly, shoppers need different reasons to complete a purchase, and discounts are only one of them. So, how do brands know what will convince a hesitant shopper? It starts with understanding what’s holding them back in the first place.
When we simplify those moments of hesitation, we see three broad barriers coming up again and again: price, choice and trust.
Some shoppers are waiting for a better deal, others are drowning in choices, and some just aren’t sure if they can trust what they’re buying.
Choice overload in particular is a real issue. 76% of shoppers say they feel overwhelmed by the amount of product choice they’re dealing with. So sometimes showing someone another 20 products isn’t helping them shop. It’s actually making the decision harder.
Harikrishnan Binu
Global Insights Director, M+C Saatchi Performance
The takeaway? Find out what’s causing the cold feet before offering another discount. Give price-conscious shoppers better value, help overwhelmed shoppers narrow their options, and reassure hesitant buyers with reviews, clear delivery promises and easy returns. Because sometimes, the best way to win a sale is simply to make the decision easier.
3. AI is becoming the shopping assistant
People discover something offline and buy it online. They might see something on social, then go and read reviews, or ask someone they trust before actually buying it. In fact, 58% of Gen Z shoppers discover gifts in physical stores. None of that is particularly new.
What’s more interesting is where confidence is being built before somebody actually makes the purchase. Where in that journey are we helping someone make the decision? And this is where AI becomes particularly interesting. Because AI is starting to take on some of that decision-making work. According to Adobe, traffic from generative AI tools to US retail websites jumped a whopping 693% year-on-year during the 2025 holiday season.
And that has a practical implication for brands. Your product information, reviews, delivery terms and returns information now need to be understandable to the shopper, but increasingly to the machine helping the shopper make the decision. The bigger shift here is not that shoppers suddenly have more channels. It’s that more of the decision is being made before they ever reach the checkout.
Make it easy for the machine to understand, but hard for the consumer to substitute.
The most valuable moment to influence a festive purchase may not be the moment when the purchase happens.
Festive advertising strategies have traditionally focused investment around major shopping days, when promotional activity and consumer transactions are at their peak. But purchase journeys often begin much earlier, as consumers discover products, compare alternatives, evaluate offers, and build intent across multiple touchpoints.
Affle’s India’s Festive Pulse 2025 research reinforces this distinction. Nearly 49% of surveyed shoppers begin planning festive purchases 15 days in advance, while 50% report making purchases within 3–7 days of seeing an ad. For marketers, this highlights an important consideration: the window of influence and the window of conversion are not necessarily the same.
Plan around consumer intent, not just festive peaks
Festive demand behaves differently across categories. In ecommerce, for example, consumers may spend days researching products before making a purchase during a promotional window. For fintech advertisers, consumers may explore credit or payment options ahead of a planned purchase. Quick commerce, on the other hand, can be driven by immediate, occasion-specific needs.
These differences matter because an effective festive strategy must consider not only when consumers are most likely to convert, but also when advertising has the greatest opportunity to shape their decisions.
That calls for more deliberate sequencing of campaigns across discovery, consideration, acquisition, and re-engagement, with category-specific timing and conversion windows for each category.
Connect the consumer journey across screens
Festive shopping is increasingly a connected experience. Affle’s first-party research found that 68% of surveyed consumers (ahead of the festive season) discover festive deals through in-app ads, while 32% switch devices during their shopping journey.
A consumer may discover a brand through connected TV, engage with its ad on mobile, and eventually transact through an app, website or brick-and-mortar store.
For advertisers, the opportunity lies in connecting these moments rather than treating them as separate channel interactions.
This requires a more coordinated approach to audience engagement, creative relevance, and cross-screen activation, ensuring that consumer interactions build upon one another as purchase intent develops.
Optimize for the conversions that matter
Festive campaigns can generate significant spikes in installs, engagement, and transactions. But increased activity does not automatically translate into sustained business value.
The definition of a meaningful conversion varies by category. For ecommerce advertisers, it may be a completed purchase or a repeat transaction. In fintech, it could be an activated account or a disbursement rather than an application alone. In other app categories, value may emerge through subsequent engagement or repeat usage.
This is the principle behind outcome-oriented models such as Cost Per Converted User (CPCU), which align campaign optimization with defined consumer conversion events rather than relying on installs or engagement as standalone measures of success.
Alongside conversion efficiency, advertisers must also understand the incremental contribution of their media investments, particularly during festive periods when organic demand and promotional activity rise simultaneously.
From capturing demand to influencing outcomes
Festive performance shouldn’t be defined solely by how much demand a brand captures during the busiest shopping days.
A stronger approach begins earlier, connects consumer interactions throughout the journey, and measures performance against the outcomes that matter to the business.
The real opportunity for marketers is to shift from concentrating spend around the moment of purchase to influencing the moments that make purchase more likely.
India’s festive season is a shared cultural moment, with consumer intent that varies by category. An ecommerce purchase, a fintech decision and a quick-commerce need each follow a different path to conversion. This makes a verticalized approach to festive marketing increasingly critical. The next era of festive advertising will be defined by connected journeys, contextual relevance and accountable outcomes.
Orit Sharon
VP Global Marketing, Affle
The big takeaways
01
In both seasons, India’s biggest creative refresh came four to five weeks before Diwali, which is October 1 to 14 this year. A second round follows three weeks after Diwali, November 26 to December 2 this year, so brief it now.
02
Spend the hardest from Diwali to a week after (November 8 to 15), when the market peaks and installs cost less than in the week before. Commerce apps should start earlier.
03
Plan for India’s install costs to rise from about November 23, the same week Black Friday starts the US climb.
04
In Asia, plan around December rather than 11.11 or 12.12, and budget for installs about a quarter more expensive from Black Friday week through 12.12.
05
In the US, budget for installs 11% to 14% more expensive from Black Friday week to about December 21.
06
Keep budgets running from December 29 to January 4, the season’s biggest week, at lower prices than Christmas week.
AppTweak
Put festive store listings up at least 12 days before Diwali, and if your category has a seasonal hook, give the festive message your first screenshot.
RZR
Judge festive campaigns on cost per purchaser and revenue relative to spend, beyond CPI, and launch before festival days.
TikTok
Seed holiday ideas in October, and rotate creative every few days in the peak weeks.
M+C Saatchi Performance
Get on shoppers’ wishlists before you fight for a place in their cart, and find out what’s causing the cold feet before offering another discount.
Affle
Plan campaigns around when shoppers build intent as well as the festive peaks, and measure them against the conversions that matter to the business.
Methodology
What the data covers
Singular attribution and cost data, aggregated across advertisers and limited to data that meets Singular’s reporting standards. No advertiser is named or counted. In total: 943 billion ad impressions, 4.6 billion installs (paid and organic), and $2.4 billion in ad spend across 28 markets.
How we report
Every figure reflects the wider market rather than any single advertiser. Where one company’s activity could set the pattern on its own, the figure is built on the market around it.
India
Two Diwali seasons, with the main day of Diwali (Lakshmi Puja) on October 31, 2024 and October 20, 2025. Daily data from July to December in both years. July is the comparison month, a normal month before the festive season, which in India falls in the monsoon.
The windows we use:
The three weeks before Diwali (30 to 8 days before)
The two weeks around Diwali (seven days either side)
The three weeks after (8 to 30 days after)
Single weeks where the text says so
India’s cost figures use Android, which carries more than 80% of the country’s app ad spend.
Creative
Share of spend by how long each creative had been live, where new means under seven days, measured across the broad market of advertisers. Diwali week runs from three days before Diwali to three days after. The week three weeks after Diwali runs from 18 to 24 days after it.
Events, 2025
11.11 covers 14 markets: Singapore, Malaysia, Indonesia, the Philippines, Thailand, Vietnam, Taiwan, Hong Kong, South Korea, the UAE, Saudi Arabia, the UK, Germany, and Spain.
Sections 4 and 6 focus on the eight markets that run both 11.11 and 12.12: Singapore, Malaysia, Indonesia, the Philippines, Thailand, Vietnam, Taiwan, and Hong Kong.
Black Friday and Cyber Monday cover 19 countries: the US, Canada, the UK, Germany, France, Spain, Italy, the Netherlands, Brazil, Mexico, Argentina, Chile, Colombia, the UAE, Saudi Arabia, Turkey, Australia, Japan, and South Korea.
12.12 covers 8: Singapore, Malaysia, Indonesia, the Philippines, Thailand, Vietnam, Taiwan, and Hong Kong.
Christmas covers 17: the US, Canada, the UK, Germany, France, Spain, Italy, the Netherlands, Brazil, Mexico, Argentina, Chile, Colombia, Australia, Japan, South Korea, and the Philippines.
Each event week includes the event day and three days on either side, compared with the period 45 to 31 days before the event. The week after Christmas runs from December 29 to January 4. We also compared each event week with the weeks around it and, for 12.12, with markets that don’t run the event.
Definitions
Ad spend is in US dollars. Cost per install is the spend divided by installs from sources that report cost. CPM is the cost per thousand impressions. Installs per impression is installs divided by impressions.
Partner data
AppTweak and RZR figures come from each partner’s own data, and TikTok’s from its own data and the studies it cites. All appear as each partner submitted them. M+C Saatchi Performance’s figures come from its own consumer research and the third-party sources it cites. Affle’s figures come from its own research, including India’s Festive Pulse 2025.
About Singular
Singular is the leading MMP built for the AI era. Singular solves the hardest marketing data problems so growth organizations can scale with confidence. It’s the only platform that both collects cost data and does attribution, closing the ROI loop, with 1,200+ cost data connectors and 10,000+ technology and media partners.
Creative Benchmark Report 2026: The Data Behind Creative Performance
CTR, CVR, and CPM benchmarks by vertical and channel, plus the data on where creative performance actually comes from. With practical insights from NewForm, CRAFTSMAN+, Liftoff, MobileAction, and…
The 2026 CTV Growth Playbook: How to Scale CTV as a Performance Channel
CTV has outgrown the brand budget. See what it's worth in a performance mix, the audience it reaches that your current channels can't, and how to prove the…