John Koetsier is a journalist and analyst. He's a senior contributor at Forbes and hosts our Growth Masterminds podcast as well as the TechFirst podcast. At Singular, he serves as VP, Insights.
Everyone wants insane app retention rates. Most people get single digits, grumble, and put more money into the growth slot machine to keep. on. finding. more. new. users.
UA merry-go-round, here we go again and again, round and round, round and round.
Think about it for a second:
Would a 10% app retention rate make you smile?
Would you blast dangerously through the endorphin roof if your app hit 20%?
And would 30% probably give you a heart attack of joy?
Only one app I’ve come across has a retention rate of 56%, however … and it’s achieved that even in the extremely challenging fitness, health, and wellness space. The app is Welltory, and I recently had a chance to check in with the brand’s VP of strategy, Asya Paloni.
(And no, I can’t pronounce her first name either.)
Hit play, keep scrolling. We’re going to highlight Welltory’s 5 Jedi mind tricks for insane app retention rates below …
I met Paloni backstage at MAU, Mobile Apps Unlocked. We started chatting, and within 3 minutes I knew she needed to be a guest on the Growth Masterminds Podcast. (Well, to be honest, I needed her to be a guest.) Within 3 minutes of listening, I think you will see why.
Why wellness apps have horrible mobile app retention rates
Part of the reason is that the wellness category is notorious for awful app retention rates.
Here’s why:
“The fitness, mobile health and wellness category has atrocious retention rates,” says Paloni. “Typically all of these apps follow the same kind of mechanics: you’re just a regular user, and something happens in your life that makes you say, you know, it’s time to change my life around, I’m gonna download a health app and I’m gonna get super healthy.”
So far so good.
Cue the energetic music, the happy busy part of the movie where the strike team is getting everything ready for the mission, the pleasant anticipation of imminent success.
But wait … there are rapids in the future.
“It’s going to analyze all of my data,” says Paloni. “It’s gonna give me a personalized plan and tell me exactly what I need to do to get in good shape. But then, of course, people download the app, they buy the personalized plan that it gives them … and then they don’t do it.”
Uh oh.
In other words, wellness and fitness is the gym membership of apps. And nothing is more common than people buying a gym membership, then dropping out. On January 2, all the New Year’s resolution newbies hit the gym and no one can find an elliptical machine. On January 31, it’s back to the regular old crowd, and everything’s available.
Why?
“What happens is you’re tired at the end of the day, you know you’re not gonna meet your goals,” says Paloni. “So then you’re not gonna want to open the app because it’s just gonna tell you you’re not doing the things that you’re supposed to be doing and that’s gonna make you feel bad.”
So …
You don’t open the app because it has bad news.
You don’t want to pay for something you don’t use.
Therefore, you churn.
You drop out.
You become just 1 little part of a very big and very depressing statistic about mobile app retention rates.
Welltory’s entire journey, Paloni says, is about how to avoid that. One big key that sounds simple but is too often ignored: people like apps that make them feel good, she says, and they don’t like apps that make them feel bad.
5 Jedi mind tricks for insane mobile app retention rates
So first off, I have to be honest. I’m the person who called them Jedi mind tricks. Paloni definitely doesn’t go around thinking she’s a mind-controlling master of human behavior.
But they are pretty cool.
And, if they deliver retention rates like 56% … they at least seem supernatural.
So here they are …
1. Make magic
Make something magical happen in your app.
“I don’t buy like a bath bomb to make progress in my life, right?” says Paloni. “I buy a bath bomb because it’s magical and it turns my bathtub into a magical spaceship. And I think that’s cool and fun.”
So when Welltory analyzes people’s data, it doesn’t provide raw data or spreadsheets. Instead, it gives you a “beautiful, magical fuel tank that changes color and behavior depending on how your body is feeling.”
More stress? Red.
Calm? More blues.
Lots of energy? Green, with a lot of fuel in the tank.
The result is a more engaging, interesting — dare I say magical? — experience that helps build higher app retention rates.
2. Hyper personalization
Welltory enables connection to over 1,000 data sources, Paloni says, because stress isn’t just what your Apple Watch can detect from your heart rate and movement.
It’s also about your job, your relationships, your commute, and much, much more.
So Welltory’s CEO has her Stripe revenue connected to her instance of Welltory.
“When I talk to her and I’m like, Jane, your stress levels are a bit high, I’m a lot more likely to get a positive response if I remind her, ‘Hey, Jane, your stress levels are actually correlated with your Stripe revenue,’” says Paloni. “‘We sent you a correlation. We built you like an entire research paper and sent it to you personally to show you that you need to take care of your stressors.’”
If Slack is the thing that triggers you, Welltory can know that. Or maybe it’s messages in WhatsApp. Once identified, Welltory can help you deal with it, and that hyper-personalization makes the app super-sticky.
The reason is obvious: the more things connected to an app, the smarter it can be and the stickier it gets.
3. Novelty & little rewards
We are all dopamine addicts. Even an app dedicated to your wellbeing recognizes that and works with it, not against it.
To illustrate the point, Paloni brings up Nir Eyal’s book Hooked:
“He makes a great point that people find products like TikTok and Facebook and Instagram super addicting and they keep coming back because you get a little reward every time,” she says. “You know, you never quite know what you’re gonna get. You’re gonna get some new content, you’re gonna get into an argument with your uncle … you never know!”
People associate that with negative impacts because that’s what we tend to focus on, but the same dynamics can be used for good goals too.
“We were really committed to the idea of showing users something new every time they open the app,” Paloni says. “So even long before generative AI, we built our own janky generative AI, and I swear it aged me like a decade, but our users see something new every time they open the app, and it really worked.”
Novelty and rewards equal occasional hits of dopamine equal higher mobile app retention rates.
4. Make sense in real time
We all have a ton of data inputs, and people who are focusing on their wellbeing have those too. The challenge is that most human brains are not built very well for the purpose of constantly assimilating a flood of data from multiple sources and making it all make sense.
So Welltory tries very hard to provide simple, holistic, and instant insights.
“So people wear a lot of wearables and data trackers, and I really love how wearables are getting more and more accurate,” Paloni says. “I really think that they’re doing a really good job of showing trends and like visualizing people’s data … the challenge for users is that you don’t really know what 10,000 steps means for you … it depends on your age, your fitness level, how quickly you walk those 10,000 steps, how much stress you’ve built up in your cardiovascular system that day.”
One solution in Welltory is a pressure gauge … showing you immediate visible impact of stressors as well as immediate visible impact of activities that calm those stressors away.
“So anytime you open it throughout the day it won’t be like, you walked 10,000 or 12,000 steps,” says Paloni. “It’ll actually infuse all that data with meaning and create holistic sense out of it.”
What that translates into in different apps is hard to say, although I’m sure most publishers could immediately think of applications specific to their apps. One that comes to mind in a game I often play is components in this complex game that I don’t use, which means I get freebies and power-ups that I don’t understand and bonuses for things I don’t do.
In a productivity app, maybe that means I’m never left wondering what I should do next, or never wondering what my current status is.
Whatever it is for your app: make sense in real time.
5. Don’t make your users feel bad
We’ve already teased this one above: don’t make users feel bad if you want high app retention rates.
That means not shaming people, even when there’s somewhat bad news to share.
“If you think about the way that most fitness trackers function, they kind of have a really fixed interface where you open it and you’re like, okay, my steps are here, my heart rate’s here … if you have a really bad day, all of those things are gonna look bad.”
Instead of making people look bad, and then feel bad, and then not open the app, Welltory strikes a balance between showing people the data they need and entertaining them. The justification, of course, is that if people just ignore their wellness data entirely, they’re likely to be less well. In addition, this strategy is more likely to keep people using the app.
But that’s a slightly different feeling, and smart game apps will find ways for everyone to feel good about something, even if they’ve just lost a match.
Results: insanely great mobile app retention rates
5% D30 retention might be acceptable for some. 25% or 30%, as I mentioned earlier, might feel like mainlining testosterone (or estrogen!).
Welltory has 56% after 3 years.
That doesn’t mean everyone keeps paying the whole time, Paloni explains.
“Our usage retention rate is about 56% over the course of three years,” she says. “I am talking about usage retention. So a lot of people churn, they unsubscribe, but they keep using the app because we have a really nice freemium thing and then they resubscribe later and we get more and more value out of our cohorts the longer they stay with us.”
That’s impressive.
“Our strategy is to keep them with us for as long as possible, even if they do unsubscribe, because we can always get them to resubscribe later.”
And that makes sense.
Now the question is: how do these 5 Jedi mind tricks for mobile app retention rates apply to your app?
CPI is up, 4 networks whose names you’d probably recognize gained the most new advertisers in the past quarter, and ATT opt-in on iOS dropped. But 6 categories of iOS apps are still over 30% ATT acceptance, and global CPI on Android apps at least — not games — is slightly down.
Useful benchmarks and insight for mobile growth organizations
Paid vs organic installs: iOS vs Android
Plus partner contributions
RevenueCat: subscription trial conversions
Fluent: rewards in mobile user acquisition
Mistplay: finding IAP spenders
Clearly, your own marketing and performance data is what matters most, and benchmarks are best left on the bench. But it’s always interesting to see what the bigger picture is, and there’s a pretty big picture here based on:
Billions of dollars of ad spend
Trillions of ad impressions
Billions of app installs
There’s a ton of data plus a ton of mobile quarterly trends insight in the new report, and all of it helps you navigate the $446 billion in global ad spend and $135 billion in annual in-app purchases that we’re seeing in mobile.
Most teens play games. Most teens play games to be social. And most teens play games on multiple platforms. But there are some significant differences between girls and boys, and between those who identify as gamers and those who do not. And there’s some big differences of opinion on whether games are actually good for teens.
Pew Research recently surveyed 1,453 U.S. teens aged 13 to 17 on their gaming habits across all platforms.
I was particularly interested in their research because Adjoe just released its 2024 Mobile Games Index, and one of that report’s key findings was shocking: older adults game more.
This was counterintuitive to me at first, but when you dig a bit deeper, it makes sense.
Adult super gamers?!?
According to the Adjoe data, adults aged 40-49 are the most engaged gamers, with daily sessions averaging 23 minutes: up a third since 2023.
Kids, on the other hand, spent less time in games: 0-19 year-olds, who were the most engaged in 2023, spent less time playing than any other age group: under 21 minutes.
The Adjoe data is compelling, not least because it’s based on a huge amount of data: 95 million interactions with popular mobile games from more 27 million users in about 6,000 Android apps. (Clearly ATT and Apple’s other privacy initiatives have made it harder to gather data from iOS users.)
The difference, of course, is that the Adjoe data is about gamers because it’s based on a self-selected audience of gamers. The Pew data is a representative sample of kids: gamers and non-gamers. Plus the Adjoe data contains a lot of pre-teens, which is an entirely different demographic.
But both datasets are interesting and valuable in different ways.
Shocker: teens love games on most platforms
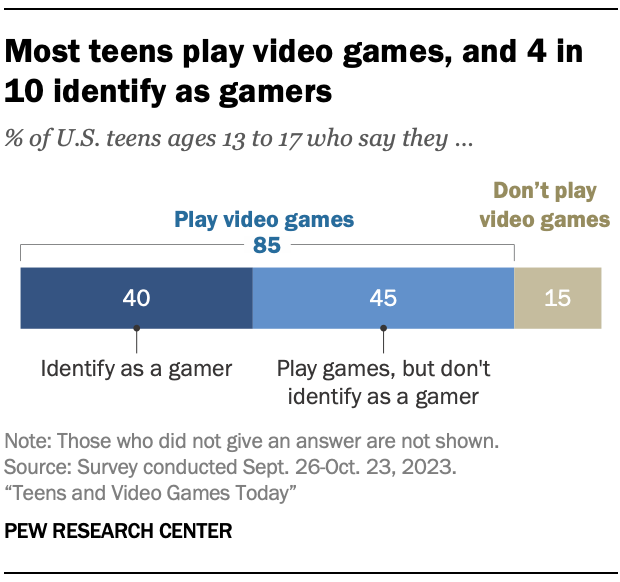
So it’s no shock: 85% of U.S. teens say they play video games. Not quite half, 41%, say they play games daily, and about that same percentage identify as “gamers.”
While 97% of boys play games and 85% of girls play games, boys are about 50% more likely to identify as gamers. 62% of boys identify as gamers, versus 40% of girls.
(Interestingly, we saw something related in a Growth Masterminds episode recently on gaming: a reluctance to label those who just play games on mobile — as opposed to console or desktop — as gamers.)
Boys are also much more likely than girls to play daily:
61% of boys play daily
36% multiple times daily
22% of girls play daily
11% multiple times daily
What platforms do they play on?
Pretty much every single platform. Interestingly, while console and phone lead, virtual reality headsets have surprisingly wide distribution: more than I would have expected.
Console: 73%
Phone: 70%
Computer: 49%
Tablet: 33%
VR: 24%
The one device that girls are more likely to play games on than boys is probably not a surprise: their phones. 79% of girls play games on their phones compared to 61% of boys; on all other platforms boys tend to play more games than girls.
Teens, games, and friends: gaming is social
It probably shouldn’t be surprising to us in these days of declining “third spaces,” but games are intensely social, especially for teens. (Homes and schools/offices are 2 primary spaces we live in; malls, theaters, parks, and coffee shops used to be more prominent third spaces to meet and be social.)
Socializing with others is a key part of the video game experience, says Pew. 89% of teens who play games do it with others, and almost half have made a friend online because of a video game.
Only 11% play games entirely alone.
Teens who identify as gamers are the most likely to play games socially: 98% of them say they play games with others, and 68% have made at least 1 friend online. This is legit a thing: it’s fairly common to see posts about gamer friends finally meeting IRL … in this case, two young men met for the first time after playing Xbox for 20 years together, with 1 serving as the other’s best man at his wedding.
It’s not just about IRL either: teen gamers “stand out” for their use of Discord and Twitch, Pew says. 44% of teen gamers use Discord, while 30% use Twitch.
Teens generally think they spend the right amount of time gaming
From personal experience, parents are likely to disagree, but most teams say they spend about the right amount of time gaming. Only 13% said they spent too much time gaming, though boys are almost 4X more likely than girls to worry about that.
58%: right amount
14%: too little
13%: too much
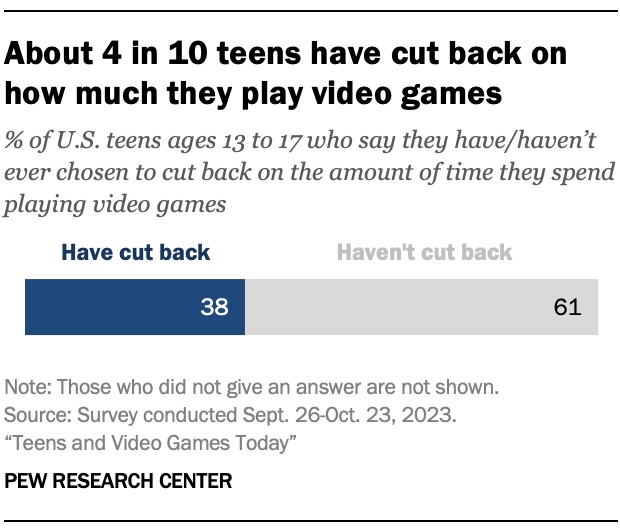
Close to 4 out of 10 teens say they’ve cut back their video game playing time at least once in their lives.
That’s a relevant finding right now as parents are joining a wave of lawsuits alleging that games like NBA 2K, Grand Theft Auto, and Roblox are causing “brain damage, a stroke, and seizures,” in at least 1 case. These lawsuits are targeting big gaming developers with deep pockets like Microsoft, Nintendo, Sony, Roblox, and Epic Games, Bloomberg says.
Many teens, however, say that games are good for them:
56%: Improve problem-solving skills
47%: Help their friendships
41%: Show them how to work with others
32%: Boost their mental health
A negative that teens do admit, however, is that games aren’t great for the amount of sleep they get: 41% say they’ve gamed too much and slept too little. And teens who say they play too much are most likely to also say they get too little sleep and spend too little time on homework.
Also, 43% of teens who play games say they’ve been harassed or bullied while playing, including 8% who were sent unwanted sexual images. 80% of teens agree that bullying while playing games is a problem.
Why teens play games: not just fun
We generally play games to have fun, so it’s not a shock that 87% say fun or entertainment is a core reason they play games. But 72% also say that spending time with others is important.
Competition is another big reason — especially for those who identify as gamers — and learning new things is a factor for 50% of teens who play games.
Judging by the Adjoe data, adults play games at similar if not higher levels than teens, though I suspect much more on phones than consoles or computers.
Growing games: the next few years
Games jumped massively in engagement and use during COVID, dropped somewhat in 2022, and rebounded in the past year, according to Adjoe. At Singular, we’re seeing similar things, although some app categories like entertainment, medical/health/fitness, and sports are growing faster.
We’ll see: coming phones and consoles and computers will have AI-specific chips that can run complex LLMs and other AI features.
Of course, when games start having truly intelligent NPCs powered by technology like GPT-4o, we’re also going to have even more interesting discussions on how healthy and how engaging games will be … and what a game is … and why people game.
How can you get a single, de-duplicated, and accurate view of user acquisition activity on iOS devices? It’s much harder than it appears. And it doesn’t actually require magic. But it is necessary for the most efficient iOS mobile attribution.
Hit play, then keep scrolling …
What you really want from iOS mobile attribution
What you really want from iOS mobile attribution is not hard to figure out. It’s pretty much what you used to have pre-ATT.
“You want to see in a single place: just show me how many installs are every channel driving? What’s my ROAS for every channel?” says Singular VP of Product Evyatar Ram. “And it’s all over the place: some of the data’s here, some of the data’s there, some of the data’s cohorted, some’s not cohorted, some’s available immediately. some’s available three days later … it’s painful.”
This is of course the challenge that SKAN was supposed to solve, post-ATT. And it does, to a degree, but not completely.
Because SKAN on its own is not enough.
Because sometimes, the friendly fairy lies. Or … omits some information.
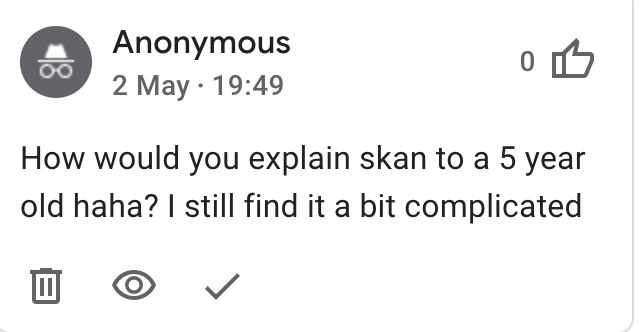
SKAN is a friendly fairy (or: explain it to me like I’m 5 years old)
“How would you explain SKAN to a 5 year old haha? I still find it a bit complicated.”
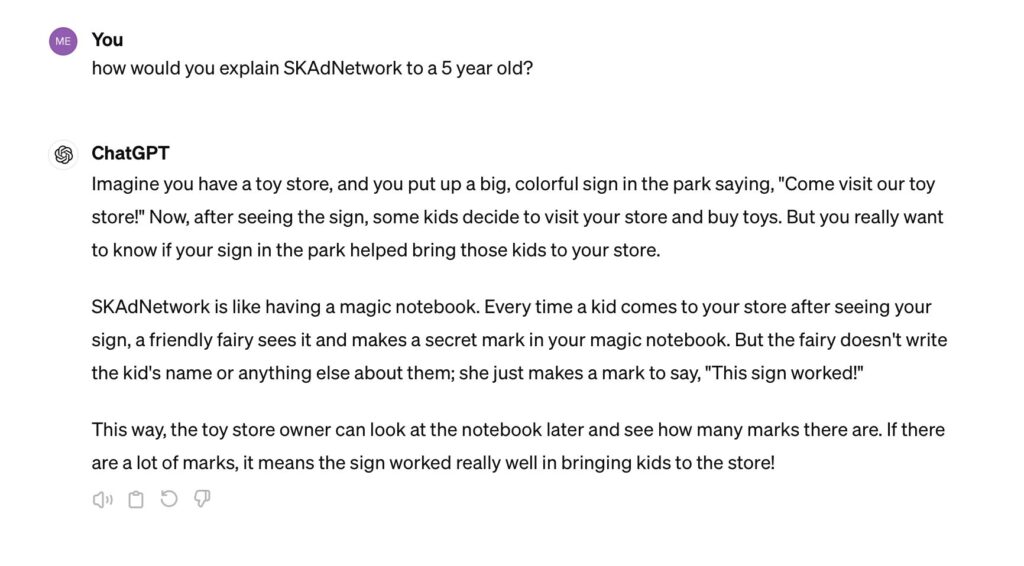
So I asked GPT-4 how SKAN does iOS mobile attribution. And here’s what the AI-powered magic 8 ball said:
SKAN is like a friendly fairy that makes a secret mark in a magic notebook every time an ad works.
So SKAN is a magic database (notebook) and a friendly fairy: OK, got it. That’s mostly accurate, actually. But naturally it leaves out a lot of detail, just like SKAN drops a lot of data.
And that’s the challenge.
Unfortunately, the iOS mobile attribution magic database isn’t complete
We all know that sometimes, the friendly fairy doesn’t tell the whole truth.
The friendly fairy knows that if she makes a secret mark in the magic notebook every single time a kid sees the sign and comes to the store, eventually the toy store owner might figure out which mark belongs to which kid … and privacy is gone.
Which is why privacy thresholds in SKAN 3 and crowd anonymity in SKAN 4 ensure you’ll never get all the postbacks from all your installs.
So what you get from SKAN is reliable but incomplete. It’s deterministic, but censored and not granular: decoupled from actual devices and people.
It works with a lot of data science help from Singular’s SKAN Advanced Analytics, but there are still discrepancies compared to other forms of measurement.
Plus, every time you measure you get different answers
The challenge is familiar to all iOS UA managers, and it makes iOS mobile attribution tough.
Consider getting 100 installs for your app from a marketing campaign in 1 week.
SKAN postbacks tell you you have 83 new users
Your ad partner’s dashboard says they drove 123 new users
Your internal user data tells you without a shadow of a doubt that you have 157 new users in the last week, which you realize includes both organic and paid user acquisition
But you have an open question: how many installs did your paid marketing campaign actually deliver?
The real-world impact is considerable:
“The impact is it’s really hard to be a marketer these days,” says Singular product marketing manager Kelsey Lee. “They can’t trust their channel performance because they’re looking at all of these different attribution decisions, and each decision makes the performance look different based on different methodologies.”
The good news is that now you actually can know, thanks to Unified Measurement from Singular, which we announced about a month ago and is simplifying life for customers every day.
I spent some time with Evyatar and Kelsey Lee to get more details.
The solution: Unified Measurement is deduplicated and accurate
What you really want in iOS mobile attribution is one source of usable data that is accurate and unified. So what Unified Measurement does is combine multiple sources of insight into one number, with full transparency into the other analytics.
Ultimately, by combining SKAN Advanced Analytics and multiple measurement sources, Singular has been able to provide:
Cohort capabilities: providing insights into post-install performance up to D35
Side-by-side comparisons: allowing marketers to analyze SKAdNetwork data, tracker data, and unified metrics simultaneously
Full SKAN conversion payloads: maximizing SKAN utility for data collection by not stealing half of your potential values
Accurate deduplication of sources driving your app installs
Beta testers of Unified Measurement, including companies running significant ad budgets, have reported substantial improvements in their campaign performance. Reductions in effective cost per install, revenue reallocation, and more accurate partner reporting are just some of the benefits witnessed by users of Unified Measurement.
“Unified measurement is a way to get a single duplicated and accurate view of your UA activity on iOS,” Evyatar Ram says. “Essentially what it does is it combines SKAdNetwork data together with tracker data in a way that is de-duplicated and accurate, so you know the real number of installs that are driven from every channel and you know your actual number of installs.”
And not just installs, he adds.
Unified Measurement is for installs and revenue cohorts and also in-app events.
As Singular CEO Gadi Eliashiv reported when announcing Unified Measurement, it’s making a big difference for clients doing UA on iOS. Each client is different of course, with different spend profiles and different ad partners, so each sees different results.
What we’ve heard from customers includes stats like these:
57% reduction in eCPI
31% reallocation from organic to paid
17% more accurate partner reporting
88% higher SKAN revenue
19% reduction in double-counted revenue
109% increase in attributed installs
43% boost in D14 ROI
Each number is from a different customer, and what you see when you try Unified Measurement will vary as well depending on your unique circumstances.
The outcome: better decisions
Ultimately, you collect data to make better decisions, and that’s what Unified Measurement is designed to deliver.
“It’s not complicated,” says Ram. “You want to see the channel, you want to see the campaign, you want to see the installs, and you want to see the post-install cohorted performance: what happened after day 1, day 3, day 7, day 14 … and I think kind of our North Star was to get you back there.”
The result, he says: better decisions, and empowering UA managers to do their jobs much more effectively.
Take a test drive?
Unified Measurement has been live for months. If you’d like to experience it for yourself, book a demo and a Singular representative would be happy to show you how it works.
If “marketers and AI” were in a relationship, their Facebook status would probably be “it’s complicated.”
Why?
According to a recent survey of 1,200 marketers, only 37% see AI as becoming an integral part of their overall skillset as a marketer. In spite of that, 9 in 10 expressed concern that “I will have to learn how to use AI to maintain my value as a marketer.”
4 out of those 10 were “very concerned.”
And yet, at the very same time, according to the same survey, 91% of marketers surveyed are currently using AI on a daily basis, both professionally and personally.
So yeah: it’s complicated. And there’s way too much fear and FOMO.
Marketers and AI: what marketers think
So how do marketers feel about AI?
Marketers have a lot of ideas about AI, many of them positive. And most of them are already using AI both in their jobs and in their personal lives. But some are worried about job loss just as much as warehouse workers looking at automation, or short-order cooks seeing Flippy, the hamburger-making robot.
The data highlights on marketers and AI:
91% of marketers are already using AI in their jobs
69% say AI is creating new job opportunities
67% say AI is a transformative tech revolution
49% say AI will help them do better work
47% say AI will make them more efficient
45% say AI will boost their skills
31% say AI will replace workers and take jobs
While there are thousands of AI tools, apparently there aren’t enough. Or at least enough of the right kind.
Here’s what marketers want more of:
57% want more optimization-focused AI that will automatically recommend campaign improvements
53% want more automation (I’m not sure if these include any of the 31% that say AI will take jobs)
50% want more predictions for customers or users who are most likely to convert
49% want more generative AI … probably safe and connected to brand standards
All of which makes sense, but the hard part is the integrations between all the different systems using AI to create a seamless whole.
AI and marketing: where’s it going?
Search for “prompt engineer” on LinkedIn and you’ll find more than a few jobs pop up. And according to this Time article, prompt engineering pays up to $335,000. My guess is there’s literally 1 job in the world that advertised that salary, and it’s more tied to training AI than generating output from AI.
But increasingly we’re seeing job postings that explicitly tie marketers and AI together
The role was about generating and testing pieces of content weekly, including images and video. Applications needed to be able to create art in AI tools like Leonardo.ai, Midjourney, and Dalle-3. The interesting thing: old-school skills like Photoshop and After Effects, plus ideally some knowledge of coding in Unity, were also important.
So clearly, AI skills and AI familiarity are a plus, but you might not be able to just get a job pulling a virtual slot machine handle on a bunch of AI tools and throwing the results over the wall at your boss or internal customer.
There’s more to it: polishing, finishing, adjusting.
Increasingly what you need is comfort and knowledge of how to use AI tools to help create content, build art, manage and optimize campaigns, segment users and customers, and help with communications and alerts. For example, it’s easy to create crappy content using an AI-generated text tool. Scalenut can create an instant SEO-optimized article on pretty much any topic you might imagine, but out of the box it will suck. It will likely contain duplicate, simplistic content, and it might actually contain errors.
It takes more skill and time to carefully edit that post, add a human voice, fix any errors, and intelligently add what’s missing. But by doing so, you can create a higher volume of fairly good quality content. You’re mixing generative AI with a human voice and human intelligence.
In a similar way, it’s also easy to create art that’s cool but can’t really be used in marketing via AI. It’s harder to add generative AI to a creative workflow that adapts the AI output into something that fits your needs precisely.
Increasingly, marketing is about finding that balance.
AI as table stakes, and increasing FOMO
AI in marketing is also increasingly about AI as table stakes.
Ultimately, for many of us, the volume of output we need to generate will only go up, and AI will be essential for us to maintain the level of production that we’re required to deliver. Plus, we continually hear FOMO-generating comments like “you’re missing the party if you haven’t joined the conversation around AI in marketing.
The key is to not panic.
AI is all around you, and you’re using it already for many things, including Singular.
In fact, there’s AI tools that you use, and there’s AI tools that use you. Dark AI, for instance, artificial intelligence working behind the scenes at big ad platforms makes targeting, delivery, and optimization decisions for ad campaigns. It’s there and it’s working, but not in a transparent way. The reality is that marketers will never see most of the inputs or direct outputs of the decisions dark AI makes on their behalf, but it’s using your dollars, your assets, and your copy — in sometimes mixed up and generative ways — to get better at figuring out customer behavior.
But AI is also embedded in the tools you use everyday that are modeling SKAN conversions, suggesting the next message to send to users, and optimizing your live ops.
Marketers and AI: how to get started
If you’re not actively using AI, it’s easy and cheap to get started.
It’s about picking the right tools and adapting your processes, but you don’t have to dive into the deep end all at once. You don’t have to immediately toss out your basic in-app user/player segmentation tool to one that uses AI to learn about each individual user and personalizes offers to them.
That might be where you end up, but an easier starting step is to subscribe to OpenAI and use GPT-4 as the starting point for some of your next emails, or to suggest a recipe. Or, if you’re more into art and design, jump over to Dream Studio, load up your account with $10, and start making art.
It’s easy and it’s cheap to play.
And playing is how humans learn best, with minimal downside or risk.
Ultimately, it is important to bring AI in your personal and professional workflows. Let’s face it, there’s going to be an increased expectation with AI-powered tools (if there isn’t already). When we can produce more output — or higher quality output — there’s going to be an expectation that we do so.
Ultimately, to really make a difference in your role, you’ll need both marketing-specific AI tools that fit into your tech stack and new processes to make good use of them.
But developing a first-hand appreciation for what AI tools can do in your specific marketing role is a great starting point before you start making 4-figure or 6-figure buying decisions.
The key is ROI
The key is boosting ROI: both from you and from the marketing organization that you’re part of. Only by doing that increasingly over time do you future-proof yourself and your skill-set.
Testing personal tools yourself is critical to doing that, because you need to have a realistic sense of what AI can and can’t accomplish before you make the much bigger buying decisions around software platforms and tools.
AI is powerful, and generative AI is amazing. But both are still incredibly fallible, and building them into your processes with deep knowledge of that borne from experience is critical to using them appropriately.
You’ve invested so much but your game isn’t growing. Why? What is the problem? Why are all the dollars you’re spending not moving the needle? Why are all your product development efforts not translating into increased engagement and retention?
I recently spent some time with the gunslinger of game growth. She’s worked with 40+ gaming studios over the last few years including EA, Rovio, Gameloft, DoubleDown, Netflix Games, and TutoToons. (Not a bad resume!) She runs the Shamsco gaming growth consultancy and is the instructor in a mobile gaming growth masterclass.
Her name is Sara El Bachri, and she just chatted with me on Singular’s Growth Masterminds podcast. If you built a game and it’s awesome, but it’s not growing like you want it to, it’s just possible that this episode of Growth Masterminds holds the answer.
As usual, hit play, keep scrolling:
Why your game isn’t growing
So, what are the most common blockers to growing games profitably? In her work with over 40 gaming studios, Sara El Bachri has seen at least 14 different reasons why growth has stalled and a game isn’t growing.
Here they are, in the order she shared them in the podcast.
This is particularly an issue in smaller gaming studios, but it can happen in larger ones as well. Sometimes, your game isn’t growing just because you haven’t invested in a growth expert, and you’re expecting developers or product managers to magically morph into user acquisition pros.
2. You need an outsider’s view
We all build blinders based on where we are and what we do. Sometimes those blinders cause us to miss opportunities and fail to see problems.
That’s 1 reason a big studio spending $50,000 a day on Facebook brought El Bachri in.
“We think we’re doing a good job,” they told her. “But we’d just like you to audit the activity and tell us what you see.”
That takes some level of humility that not all studios or managers have. And it doesn’t require finding a big problem to make an experienced doublecheck worthwhile: when you’re spending $18.25 million a year on just one channel alone, a few percent improvement can easily be worth $500,000.
3. You need to fix targeting
Targeting sounds simple, but very clearly, the devil’s in the details. For instance, it makes logical sense to target campaigns to only a single country, especially when they have different languages.
But that’s not always the case when your game isn’t growing:
“Something very simple that not a lot of UA managers do is, for example, how you group the different countries together,” El Bachri told me. “I can say instead of running Germany alone in a campaign, France alone … grouping them could potentially lead to better performance.”
Interesting!
4. Your performance suddenly dropped
Sad fact of performance marketing: sometimes things just go sideways. The algo doesn’t like you anymore, you reach a local maximum, your target needs refreshing, your creative is fatigued … something is wrong.
But what is it?
This is where a fresh set of eyes can come in, look at things from different angles, see performance with unbiased eyes, and give you a new set of ideas to play with.
5. Your junior employees need training
Maybe you do have UA professionals, unlike the problem in #1. But maybe they’re young in their career and need some insight and guidance so that their training isn’t all at the cost of your wasted budget.
Getting a veteran in who has been there and done that can save 6 or even 7 figures over time.
6. You don’t communicate well
Sometimes your problem is obvious to outsiders and the solution is simple once you see it yourself. But simple is not equivalent to easy, and poor communication can be hard to fix.
Especially in gaming, where big brands are often built in an acquisitive, accretive way that plants the seeds of trouble.
“I find that in a lot of especially big gaming studios where they have hundreds of employees scattered around different offices around the world, there’s a big issue in communication that I see between the teams.”
You might chat a lot with people in your Barcelona office, but the L.A. crew? Or the Helsinki team? What about those crazy rebels in Malta?
Fitting this all together is hard, even if diagnosing the problem is fairly easy for an outsider. But the cost can be competing campaigns that are actively costing you opportunities … and be the main reason why your game isn’t growing.
7. Your growth teams don’t talk to your product teams or your live ops teams
Siloed teams that don’t cooperate is one specific type of communication problem.
Growth can’t do its job well if it’s not well-connected to product and live ops. Product will align features and builds around what’s working if they understand the growth challenges, and live ops can provide great insight for growth teams on who to target and what kind of messaging might attract the highest-value players.
8. You have internal politics
“Every single person working in a gaming company needs to have the will to help,” El Bachri says.
If KPIs and incentives aren’t aligned, though, people will be working towards different goals that may not be compatible with overall success.
9. You lack collaboration
Even if you communicate, you’re aligned, and you don’t have politics, it doesn’t mean your team is actually working together both efficiently and effectively.
There is more juice to squeeze when you do. Even when you’re doing something like deciding on creative direction for your new ad campaign:
“When I coach and I help clients and gaming studios build their creative processes, one of the most important parts of that is to have people from the different teams collaborate together,” El Bachri says. “You have the UA manager, you have someone from product that knows the product best, and then you have someone from creative. So basically brainstorming altogether makes the creative better, more efficient.”
Even if it’s not technically “my job” to help make creative for ads.
10. You lack a creative process
Sometimes you just want to put the creative people in a box, shake it around, open it up, and have wonderful, amazing, performant images, copy, and ideas pop out.
But while that’s something that might work on a bespoke level, it doesn’t scale.
“You’d be surprised how many big gaming studios don’t have an efficient UA creative process,” El Bachri says. “Why? Because there are so many people involved. Also, a lot of times you need someone to come in to organize … and to lead.”
A creative process is about reliably and efficiently generating industry-beating creative time and time again. Without process, you’re down to luck and individual talent, and if you don’t have a complete rockstar on the team who just hits it out of the park every single time, you’re going to eventually fall flat on your face.
Which means: your game isn’t growing.
11. You’re not testing enough on-store assets
One of the biggest issues Sara sees is that studios don’t test enough app store assets, which kills a ton of opportunity to be more efficient at user acquisition.
The top 5% of best-performing studios make at least 18 changes per year to their app listings in Google Play and the App Store, she says. The bottom 5% make only 1 change per year.
“You don’t need to test assets that take a lot of time to produce, but it could be small changes on app icons or screenshots or that could actually make a big difference,” El Bachri adds.
12. You don’t have a testing plan
This is something we saw recently in our Growth Masterminds episode with Russell Ovans on his new book on game analytics: a lack of a real testing plan.
If your game isn’t growing, you’re probably testing a lot of different things. But testing is complex. It’s easy to do wrong. It’s easy to get answers which lead you in precisely the wrong direction.
Building a reasonable testing plan will help you avoid those pitfalls.
13. You don’t educate your internal team about UA
ASO managers can’t test new assets they don’t have.
Sara tells the story of an ASO manager who hadn’t changed an app store listing for one of her games for over a year. (Yeah, I was shocked too.) The problem wasn’t the ASO manager per se: it’s that she couldn’t convince the creative team to prioritize her requests.
“There is a big lack of education in the industry on the nuances and all of the layers of complexity of growth,” El Bachri says.
So she had to come in and explain to the entire team how important it is to test, and how creative changes will impact both bottom line revenue and top line profitability.
14. You don’t have enough generalists who see the big picture
It’s pretty clear from many of Sara El Bachri’s reasons why your game isn’t growing that part of the problem is siloed professionals in narrow disciplines who aren’t seeing the big picture. Or understanding their role in the entire team’s success.
Which in an odd way makes me (a generalist) happy: generalists are valuable because they see the whole picture, and can take steps to get everyone aligned.
Game isn’t growing? So much more in the full podcast
If you haven’t subscribed to Growth Masterminds yet, take this as a sign that the universe is telling you to stop procrastinating. Subscribe, watch, or listen to the whole episode for all the details and all the context. And, of course, to get all the other episodes and all the insight from every single guest!
Yesterday TechCrunch reported that “TikTok may be routing around the App Store to save money on commissions,” and as such, could be in trouble with Apple for offering in-app purchases (IAPs) on the web. But that’s only partially true.
Here’s why …
Buy on the web, IAPs on the web
The “discovery” is that TikTok offers a web store where people can buy coins, which would then be used in-app in order to boost your videos or tip other creators.
That is true: such a web store exists, and I’ve visited it, and it does indeed offer a discount off the price of coins available in-app of 25% … a number which is very coincidentally almost the amount that TikTok would pay Apple in commission for in-app purchases, minus some additional transaction fees that TikTok would incur when processing payments itself.
You can buy as few as 70 coins, but with the “Custom” option, you can buy up to 500,000 coins for $5,300 U.S. at once. This is clearly targeted at the big influencer marketing studios that are looking to boost many videos hard, not so much individual creators who just want to give their videos a little shot in the arm.
App Store Guidelines problem?
Once upon a time, back in the day, IAPs on the web was definitely not OK, and Apple was very religious about this: purchases for use that might be used in-app needed to be actually purchased in the app.
“Epic Games … started allowing Fortnite payments by web. Click the link in Fortnite, go to Epic’s site, buy the skin, go back to the app, and BOOM … no 30% cut for Apple. Apple booted the app from the App Store, and Epic sued.”
However, since then there’s been many legal and regulatory changes.
One, granted by Apple way back in 2021 as a way to settle a developer lawsuit, was an update to App store guidelines that allows app publishers to inform users/players/customers of alternative payment methods outside of their app. That was reaffirmed in 2023 in one of the antitrust cases Epic Games brought against Apple. And other lawsuits and regulations such as the EU’s Digital Markets Act have pushed Apple to allow more payment freedom as well.
But there’s something significantly different about IAPs on the web — a mobile app on iOS and Android pointing users to an e-commerce site — compared to a multiplatform service, not just a mobile app, enabling e-commerce wherever it does business.
And that’s what TikTok is: it’s also available on the web.
As such TikTok has every right to ask users to make payments on the web.
And Apple’s own guidelines confirm this in guideline 3.1.3(b) Multiplatform Services:
“Apps that operate across multiple platforms may allow users to access content, subscriptions, or features they have acquired in your app on other platforms or your web site, including consumable items in multi-platform games.”
Which seems to indicate that all is well.
But wait, there’s 1 little caveat
So all is good and Apple and TikTok are now best buds, despite Apple losing IAP revenue? Perhaps not quite exactly.
Because what I copied above from guideline 3.1.3(b) about Multiplatform Services isn’t the entire guideline. There’s just a little bit more:
“ … provided those items are also available as in-app purchases within the app.”
Hmmm …
Yes, you can buy coins inside the iOS app. But last time I checked, the most you can buy is 16,500 for about $350 … about 6% as much as you can get on the web. Remember, you can order 500,000 coins for $5,300 in TikTok’s web store.
So Apple could conceivably talk to TikTok and say that this condition is not met.
At which point TikTok could come to Apple and say that the base “item” here is a coin, and coins are indeed available on the the web and in the iOS app, and therefore the App Store guideline has been fully and completely fulfilled, and the exact number available on each platform is irrelevant.
At which point it gets more challenging.
(Or TikTok could make a 500,000-coin IAP available in the iOS app, if they chose. In December of 2022, Apple increased the maximum in-app payment price to $9,999.99.)
Summing up
TikTok is a multiplatform service, not just a mobile app, and as such is fully within its right to offer products for purchase on the open web, or IAPs on the web, if you like. Things might get a little sticky with Apple, but TikTok at least has a case that it is fully in compliance with App Store guidelines.
And besides … could Apple really kick one of the biggest services on the planet off the App Store?
Google sees modern marketing measurement as a tripod. The 3 legs of the measurement stool, as Mountain View sees it, are attribution, incrementality, and marketing mix modeling (MMM).
Google just released a 44-page report titled the Modern Measurement Playbook, sharing how it sees the future of paid media attribution and analytics. Since Google is the world’s largest adtech company by revenue — $307 billion for 2023 — and probably the single biggest ad partner for Singular customers by spend, it’s worth understanding how Google looks at marketing measurement in general, and paid media attribution in particular.
Google’s modern marketing measurement tripod has 3 legs:
Attribution Micro focus: Assigning credit for conversions
The key is understanding how all of these measurement methodologies interact.
Attribution is the most immediate and it’s the one performance mobile marketers and user acquisition managers are most familiar with. There’s a click or a view, and then something happens: an install, a re-install, an engagement, a conversion. The click or view connects action and reaction, or input and output, and you have near-instant signal.
That signal, of course, is changing thanks to privacy, but SKAN and eventually Privacy Sandbox will still provide an attribution signal of varying levels of value.
Incrementality measurement doesn’t capture the immediate causal impact of clicks or views, and that is both its biggest weakness and greatest strength. It’s a weakness, from the perspective of those who want a direct connection in time and space between a marketing stimulus and a consumer response. It’s a strength, from the perspective of those who point out that just because an ad impression or click occurred at some point on the customer journey, other factors were at play. And the conversion may have happened in any case without the ad view or click.
At its best, incrementality measurement tells you the additional value of ad spend and media sources by comparing what happens for specific sets of people or geos who are exposed to marketing campaigns versus those who were not. Ultimately, incrementality measurement should reveal what you got for all your marketing effort and energy that you would not otherwise have achieved.
Media mix modeling is the longest-range, broadest-scope, and highest-level measurement methodology that Google incorporates into its tripod theory of modern marketing measurement. MMM takes into account all marketing efforts including paid ad campaigns and non-paid organic efforts, but it doesn’t stop there.
None of your marketing efforts happen in a vacuum. Everything around — world events, weather, competitor activity, economic and financial changes — impacts sales and revenue.
Modern marketing measurement: putting them all together?
Google suggests the way forward is using all 3 modern marketing measurement tools together, where attribution gives you real-time data, MMM provides a macro view of everything, and incrementality ensures you only pay for marketing that works (and partners who are effective).
The big question for a digital marketer, however, is whether you need all 3.
At some level, scope and scale provide insight on which tools you need in your bag.
A startup just beginning with modest scale will certainly waste its time with old-school MMM and is likely to find that sophisticated incrementality testing is out of scope. (Simple incrementality testing, however, like just turning the money tap off for a few weeks here and there, is not, and should be done from time to time.)
Even relatively large mobile gaming and app studios may be likely to find that traditional MMM is too big of a beast. (Note: Google suggests the time scale of MMM projects is “usually two years.” Singular offers MMM for mobile marketers that requires less … though it is 100% true that the longer you have data for, the better MMM works.) At this level, however, incrementality is a key way of discovering which ad partners are truly delivering value.
That said, there are many who don’t dive this deep into all the elements of modern marketing measurement.
Ultimately, it’s at your discretion. And a function of how much time, budget, and resources you have to invest in optimizing your marketing investments. Use the ones that make sense, but make sure you understand both the strengths and the limitations of each to avoid over-correcting course when you get results that don’t match your preconceptions.
If you do use all or several of these, Google suggests using each to calibrate the others. One way is to set the bounds as sanity checks on attribution methods.
As Google says:
“For digital click-based channels, in-house attribution typically represents a generous view of that strategy’s contribution (i.e. the upper-bound), and incrementality represents the most conservative view (i.e. the lower-bound). Your MMM’s assessment should fall within the range of these bounds.”
When you put them all together, your marketing plans set the strategy and allocate budgets for various channels, separate out goals for performance versus brand channels, and enable in-channel optimization.
Unified measurement: where Singular is trending
There’s a universe in which you have all the resources and time you need to create the ultimate modern marketing measurement machine for your specific company and marketing mix.
Unfortunately, it may not be this universe.
Marketing maturity for you is to adopt the thinking, processes, and tools that make sense for your specific situation.
What Singular is delivering, starting first with iOS, is Unified Measurement. Unified Measurement is a recognition of the fact that while attribution is just 1 leg of the tripod, in itself it contains a world of diversity in methodologies, signals, and strategies. Unified Measurement brings those together, but it doesn’t stop there. Attribution at its best is very good, and Singular’s new Unified iOS Report is indeed now the gold standard in attribution, but there’s more needed.
The insights you can derive from those methodologies have plenty to say about which partners and channels you should use, and can feed into a better marketing strategy. That’s why you can already tap into those capabilities as a Singular customer in a super user-friendly way: Singular is working to incorporate the insights they deliver into Unified Measurement.
An interesting insight from Google highlights how critical the attribution stage is:
“Regardless of the maturity stage or the number of tools you are using, when it comes to optimizing campaigns and tactics, attribution will be the best tool to prioritize since it allows you to monitor relative changes in the performance of your chosen KPI in real time.”
Ultimately, being able to pair that with higher-level methodologies provides insurance that your attribution results accurately reflect reality … especially the parts that are invisible to today’s tracking and measurement methods, like multistage customer journeys that are influenced by offline or disconnected events you will never see.
Much more in the report
If you are using incrementality or MMM, it’s worth checking out the entire Google report, which offers insight on using those methodologies to help you set bids, understand the true value of paid media (which can be greater or lower than attribution tools alone suggest), set hypotheses to test, and more.
There’s also tons of detailed examples of how to use the methodologies together.
Ultimately, it’s a fairly strong overview of modern marketing measurement. That’s not just about what to do as granular signals fade. It’s also about what should always have been paired with direct attribution data.
You see social killing it. You know billions of people are there. You see random silly things go viral, products explode, and apps go nuts, and you wonder … why isn’t that us? Have no fear: there’s a strategy to drive organic social downloads, even if you’re a total noob.
(You know the drill: hit play, keep scrolling …)
A social shopping community
Mys Tyler (think: Ms. Tyler, not My Styler) is a social shopping community, currently at about 650,000 women, built on the premise that a lot of us hate shopping. But a few of us love it, and if those of us who hate shopping can find someone who looks like us and shares our style, maybe magic can happen.
As in: she shares stuff, women like it, they buy it, and they get what looks good on their body type.
“We all have to get dressed every single day, whether we like shopping for clothes or not,” says Sara Neill, CEO and founder of Mys Tyler. “If we match the people who love shopping with the rest of the people in the world that have their same dimensions, then they can do the job of shopping for us.”
There’s a huge benefit for retailers here as well as anti-shoppers: whereas 40% of fashion that’s bought online is returned, Neill says, only 5% of what Mys Tyler members buy meets the same fate. That’s huge for profitability and it’s way more efficient for shoppers. (How many things have you intended to return only to nope out of actually doing it?)
Mys Tyler has grown quickly and fairly cheaply via Facebook and Instagram (plus other non-social strategies; keep reading to the end) but that’s led to its user base skewing older. Not necessarily a problem, but if you want to attract younger shoppers, you probably need to go to TikTok.
And therein lies the problem: what if you get the ‘gram, know Facebook, understand adtech, but aren’t particularly familiar with how TikTok works and why things go viral there?
Noobs welcome: how to drive organic social downloads
The simple answer: find people who do.
So Neill started an internship program with a twist: she’d introduce not 1 but 10 interns to building an app-based business, and the interns would help build and execute Mys Tyler’s TikTok strategy. (Part of the reason for the go big or go home strategy: a lucky mistake: overspending on the internship job ad led to 500 candidates, many of them top quality.)
“We started going through and we only wanted one, but there were so many great people that were coming through and so we ended up interviewing 20 people and then we thought, you know what, let’s change the scope of this internship and rather it being one person that works with us, let’s make it more like a 10 week course,” Niell told me.
So the interns spent an hour a week learning about product prioritization, affiliate marketing, customer journey mapping, social media marketing. Each of them took over the company’s Instagram account for a day, for example.
Essentially, they got a mini-MBA in running a mobile business.
In return, Niell asked them to build TikTok creative and campaigns for Mys Tyler, which the company would then boost with some cash. The goal: organic social downloads, or cheap paid ones, via boosting.
Organic social via Spark Ads
“So your job for next week is to each of you create something for TikTok,” she told the interns. “It can be you doing a selfie video or if you don’t feel comfortable being on camera, it could also just be scrolling through the app and like doing a voiceover or typing over it. So whatever you feel comfortable with, just create something and then we’ll load them all up next week.”
In the process, she taught the interns how to set up a campaign, what an adset is, how to target, and so on.
The type of ad she chose was TikTok’s Spark Ads, which are native ads on influencers’ own pages. The benefit for Mys Tyler was real, organic, authentic content. The benefit for the interns was that all the likes, follows, shares, and comments happened on their own TikTok accounts.
“So they get the likes, they get the comments, they get all this like engagement, but three seconds in, it has the call to action to download Mys Tyler,” Niell says. “And so what’s great about that for us is because now it’s creative with their profile picture, their name. So it’s really organic content that has a call to action to download our app.”
Then Mys Tyler put some money behind them.
Just like ads you design and build yourself, not all hit it out of the park. But one got over a million watches, which was super-exciting for the intern, and very beneficial for Mys Tyler. And it wasn’t just about views. Mys Tyler’s CAC dropped significantly as well.
“At the beginning we had a cost per install of $2.93, and by the end we were down to $0.76 cost per install,” Neill says.
The key was getting a lot of creative: creative fatigues quickly on TikTok, she adds.
One more thing: paid PR
There was another strategy that Mys Tyler used to drive significant downloads, and it’s one I hadn’t heard before from a mobile marketer or executive: paid PR.
Here’s Neill’s 50-second explanation:
Essentially, it’s paid editorial: you pitch Vogue or Women’s Health on a topic, set a cost per click, and if they’re interested enough, they’ll write about it. They’re incentivized to get people to click, Neill adds, so there are plenty of links in the story.
Just one drove 5,000 downloads all by itself. But the key is they weren’t just downloads. Because people had read an editorial piece on the app, how it works, and what it does, they were invested enough to actually sign up and create accounts in Mys Tyler:
“We had over 5,000 people download the app and create an account, like go all the way through the funnel from that,” Neill says. “They were really high engagement people because they’ve read a whole article about it. They really understand your business. They’re not just like, what’s this app? It looks like it could be appealing … I’ll give it two seconds of thought and then give up on it. So that has been incredible for us.”
The installs are great, and the sign-ups are even better, but there’s an additional bonus: media you can leverage wherever you want.
For example, since the Buzzfeed article said “this app is the closest thing you’ll find to a personal stylist,” that became part of a Meta ad.
Plus, they’re helpful for your investor deck if you’re raising money.
SKAN 4 is here and we’re starting to see about 40% adoption across the supply side of the industry. That means about 40% of the postbacks Singular is receiving are now SKAN 4 postbacks. SKAN 3 is obviously still in the lead, and until the biggest platforms such as Google and Meta commit to SKAN 4, it will remain that way.
However, that switchover could happen at any given time. And that means it’s time to build your SKAN 4 strategy now to take advantage of Apple’s updated mobile attribution framework.
Spoiler alert: it’s not incredibly easy. The transition from SKAN 3 to SKAN 4 has some serious minefields to be aware of and prepared for. The good news for Singular customers, however, is that you can switch SKAN 4 on while remaining backwards compatible with SKAN 3. That gives you more time to prepare, to get more data from SKAN 4-enabled partners, and to remain SKAN 3 functional for partners who haven’t updated yet.
What you’ll find here, is a concise summary of the changes in SKAN 4 and an overview of how to approach each of the major ones, significantly updated for new data as of late April 2024.
In addition, I’ll add some details on what you can expect in your SKAN reporting from Singular.
SKAN 4 summary: what changed from SKAN 3
If you’re already a SKAN expert, just skip this section and move on to the section on preparing to make the switch. Otherwise, skim or read as needed for a refresher.
Crowd anonymity and source identifier: SKAN 4’s first big update
SKAN 3’s Privacy Thresholds are gone. Now Apple is using what it calls Crowd Anonymity to ensure privacy in mobile attribution. At the same time — and very related — say goodbye to the old campaign ID in SKAN 3. Now, that is the Source Identifier in SKAN 4.
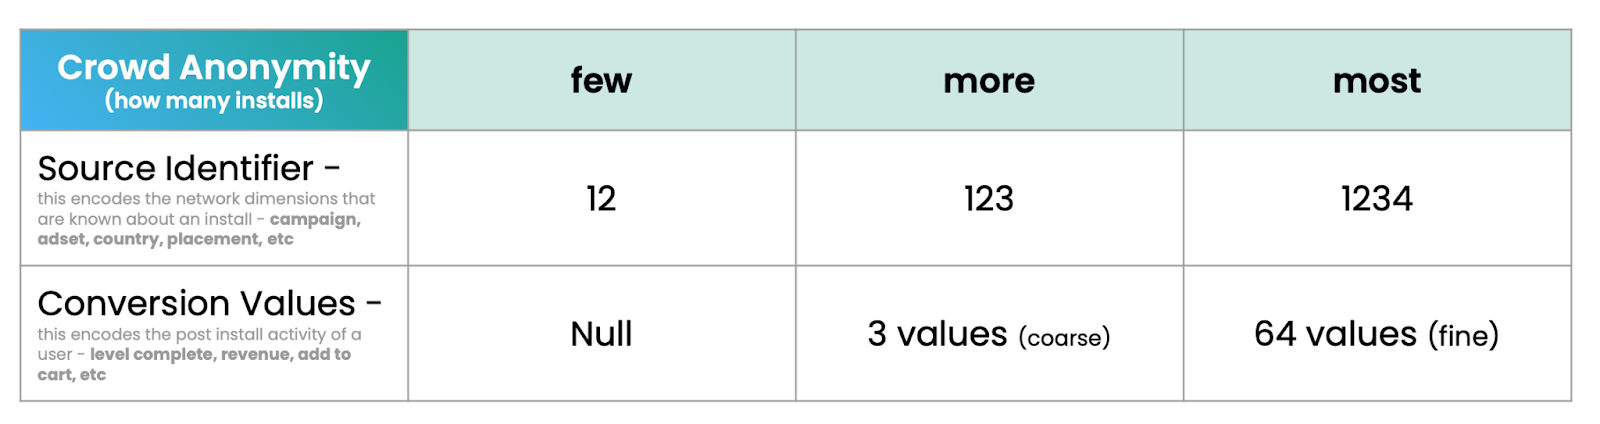
Crowd Anonymity determines how much data you get from SKAdNetwork both in postbacks and in your Source Identifiers, which are super valuable for encoding network dimensions such as campaign ID, asset, geo, ad placement data, and so on.
All of this is simple in concept but complicated in detail.
The simple part: more installs per campaign equals higher crowd anonymity which will return more data. If you get only a few installs per campaign, you’ll only get minimal data. A large number of installs per campaign — only Apple knows how many, and the parameters could change over time — gets you the most data.
If you remember nothing else about Crowd Anonymity, you’re probably OK on a high level. The big platforms will help you ensure that you have enough scale in each campaign to achieve high levels of Crowd Anonymity, but you may need to make some changes to make certain you have enough spend in each campaign to get good data out.
To break that down with a bit more detail …
If you have MANY installs per campaign
You’ll get all 4 digits of Source Identifier information in your SKAN 4 postbacks
You can use them to gather data on campaign ID, ad set, geotargeting, ad placement, or other info
You can optimize campaigns
You can get better insight on campaign results
Importantly, you’ll also get 64 potential values of post-install conversion data in your SKAN 4 postbacks, which you can use to understand engagement, activity, and revenue from your new app users at a much deeper level than SKAN 3
Note: you’ll be the full 4 digits of Source Identifier data and the full 64 values of post-install conversion for your first SKAN 4 postback for an install only: the second and third postbacks for that install will always have less data
If you have FEW installs per campaign
You’ll get less data in your Source Identifier
Perhaps only 2 digits, similar but not identical to SKAN 3
You’ll get less data in your conversion values
Coarse conversion value postbacks only have 3 potential values (out of 3 possible values you can choose)
Multiple postbacks: SKAN 4’s second big update
SKAN 3 only had 1 single lonely little postback, making mobile marketers struggle to understand the value of their ad campaigns. If you achieve sufficient Crowd Anonymity, SKAN 4 offers 3 postbacks spread out over time, providing more insight and more value.
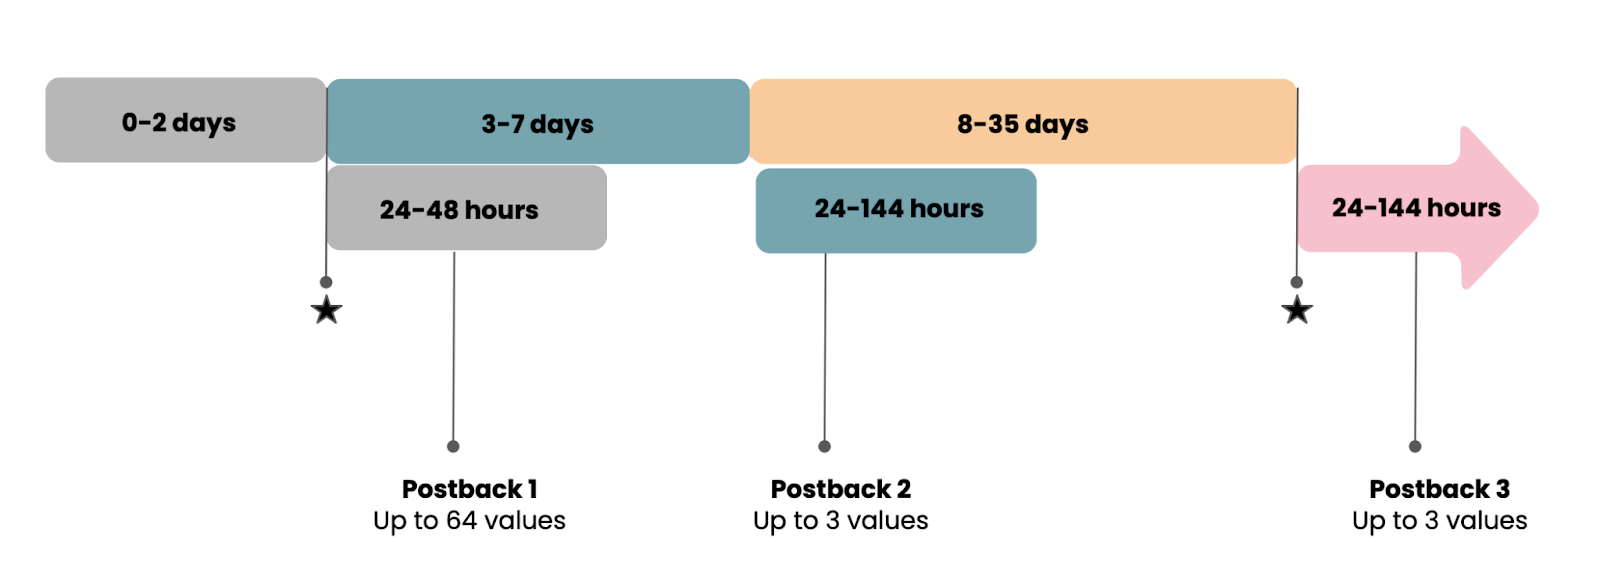
Postback 1 Postback 1 is the most data-rich postback, as you saw above, and it can be sent the quickest: within 2 days.
Postbacks 2 & 3 Postbacks 2 and 3 are very simple: each only has 1 of 3 possible values that you can set, and they will be set over longer periods of time. Think high, medium, and low, or something like that.
Postback 2: 3-7 days
Postback 3: 8-35 days
Random delivery delays Note: just to make things more fun for marketers, actual delivery of postbacks will be impacted by a random timer. More on this later …
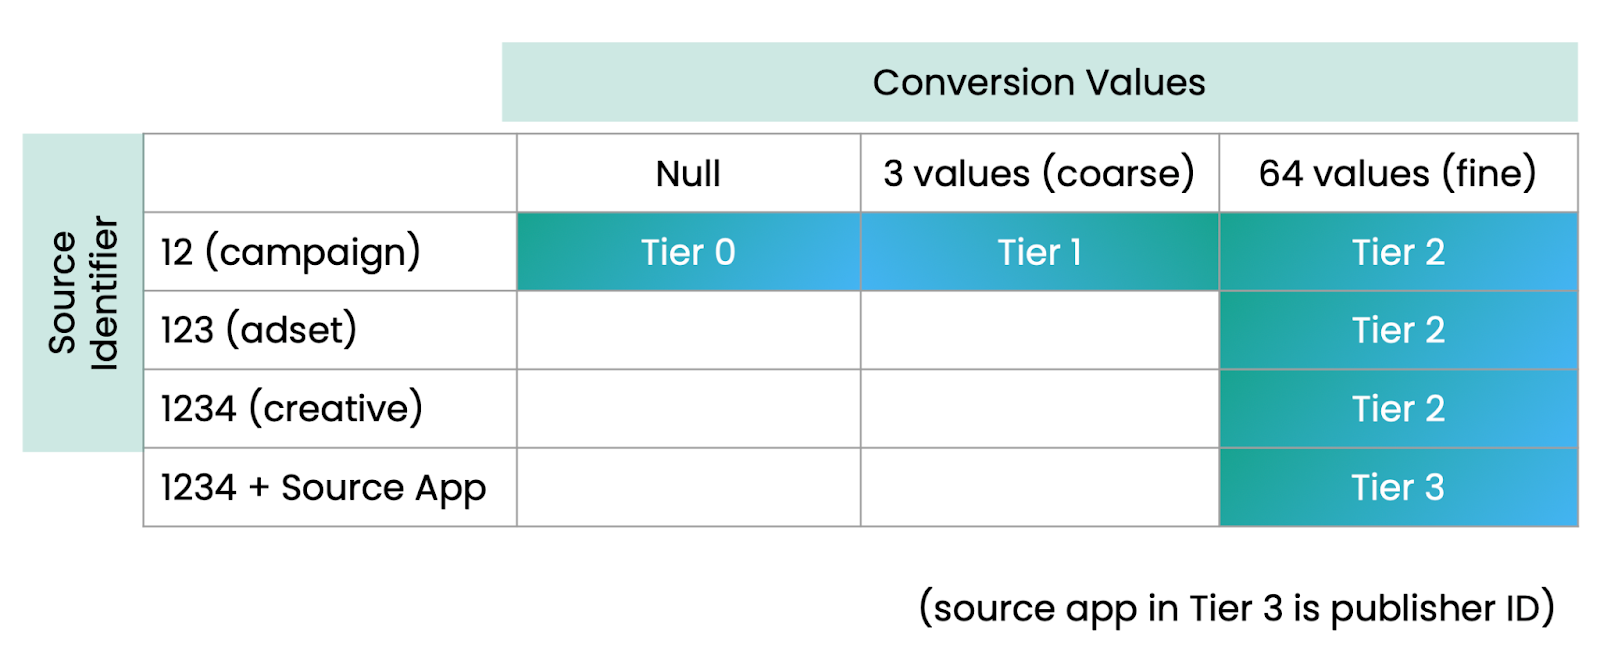
Postback 1 is the most critical postback for obvious reasons: it returns the quickest, and it carries the most data. There’s a lot of complexity in the range of values that you can potentially get from postback 1 depending on the level of crowd anonymity that you have achieved.
If you look at the above chart highlighting the data you can get from SKAN 4, Tier 3 is where you want to be on postback 1, which will give you full Source Identifier data and maximum first postback conversion values. Getting there requires that you achieve high levels of Crowd Anonymity in a campaign through a large number of installs.
That buys you:
Maximum data in your Source Identifier
4 digits of data
Plus a source app notification: essentially, a publisher ID telling you where the ad was shown
Maximum data in your conversion values
64 possible values, which Apple calls a “fine” conversion value
If you only achieve lower levels of crowd anonymity, you will receive less source identifier data and less conversion data:
Tier 0 returns no data at all
Tier 1 returns minimal data
Source Identifier: 2 digits only, not 4 (similar to SKAN 3)
Conversion values: 3 possible conversion values only, not the full 64 (similar to postbacks 2 and 3 in SKAN 4)
Tier 2 returns a very useful amount of data:
Source identifier: 4 digits (but omits the source app)
Conversion values: 64 values of fine conversion data
For postbacks 2 and 3, everything is much simpler, but that simplicity comes at the cost of less data. Postbacks 2 and 3 are always only one of 3 values each. Basically, you can use any values you choose for your P2 and P3 values, as long as there are only 3. Think along these lines:
0, 1, 2
Bad, OK, Good
Window-shopper, Buyer, Subscriber
Swimming in complexity already? Freaking out? Take a deep breath. Don’t worry. Unified Measurement is now here.
The key learning is simple: larger, fewer campaigns will maximize data return. Achieve that and you will (almost) always get all available SKAN 4 data. Also, be aware: Singular will both enrich your data with first-party insights from your own app — your own analytics know when you get an install, engagement, and purchases — plus other data sources with different attribution strategies, and will present your data in a simple, user-friendly, understandable way. The result is that Singular just released Unified Measurement, which significantly expands the data you can get from SKAN without burning any of your SKAN conversion value slots.
But keep in mind, there’s more detail to think about, because we haven’t talked about delivery times yet.
Postback delays and locking conversion values: SKAN 4’s third big update
If every postback arrived precisely at the end of its postback period, Apple’s efforts at ensuring marketing measurement privacy would probably not be very successful. The first postback, for example, can be updated until 2 days after app install. If marketing analytics platforms got the postback immediately, they could simply tie it back to new app user arrivals, and bingo: associate a specific SKAdNetwork postback with a specific app user.
Bye-bye privacy.
So Apple adds random timers, which have changed in SKAN 4:
Postback 3 random timer
24-144 hours, or 1-6 days
These are massive delays, especially for the second and third postback. This is a really big deal, and it means that if marketers use the full postback update window in each case:
Postback 1 could arrive 3 to 4 days after an install
Postback 2 could be 10 to 15 days after an install
Postback 3 could be a staggering 36 to 41 days after an install
But that’s not all. Because this is SKAN 4, we’re not done with the complexity yet. There’s yet another new feature that Apple has introduced in SKAN 4 that can return SKAdNetwork postbacks sooner. It’s called locking conversion values.
If marketers and developers choose, they can lock conversion values as soon as their in-app analytics detect an acceptable level of data.
In other words, if someone installs your retail app and buys an item immediately, you could lock the conversion and prepare a postback to be sent right away. In a game, if they play 5 levels on day 0, you could do the same. Don’t forget, however, each postback still has to wait for the random delay to expire: between 1-2 days on postback 1, and between 1-6 days for postbacks 2 and 3.
(If Apple didn’t require this, advertisers could lock all postbacks regardless of value at some point and then, as above, tease out which postbacks relate to which new app users.)
This means that in a scenario where you get great engagement and activity basically immediately and you lock the postback, you could achieve the following postback arrival periods:
Postback 1 could arrive 1 to 2 days after install
Postback 2 could arrive 4 to 5 days after install
Postback 3 could arrive 8 to 14 days after an install
Have you spotted the core challenge here?
There’s a huge diversity between earliest possible and latest possible postback delivery times … which is poison for being able to measure and evaluate cohorts of new users. Essentially, marketers could see a potential diversity between earliest and latest possible postback delivery of:
Postback 1: from 1 to 4 days
Postback 2: from 3 to 13 days
Postback 3: from 8 to 41 days
Remember this delta.
That potential diversity in postback delivery dates will become significant for how you approach your SKAN 4 strategy, as you’ll see later in the section on making the transition from SKAN 3 to SKAN 4. Quick hint: it makes cohort measurement MUCH harder.
Web to app support: SKAN 4’s fourth big update
It’s not universal across all browsers — it only works in mobile Safari — and it’s not terribly comprehensive yet, but SKAN 4.0 does enable web to app measurement via the SKAdNetwork for Web Ads API.
The benefit for marketers is clear: web ads can be cheaper than in-app ads, and web onboarding experiences can be richer, more immersive, and more engaging than a standard app listing page in the App Store.
There are a bunch of steps to make it happen: the entity serving the SKAdNetwork-attributable link needs to be registered as an ad network with Apple, the link needs to be configured properly, and there must be an endpoint to provide a signed web ad impression, but there are some strong possibilities here in both web-to-app user acquisition.
(Note: for owned platforms such as your own website or landing page, you can simply use Singular deep links for full measurement and analytics capability.)
It’s possible we’ll see more updates for web to app support in SKAN 5.
Conversion value decreases: SKAN 4’s fifth big update
Finally: bear in mind that in SKAN 4, unlike SKAN 3, conversion values can go up AND down.
In SKAN 3, if you were updating a conversion value before the postback timer period clock ran up, it could only go up. Now in SKAN 4, you can also decrement conversion values.
This seems minor, but it’s a big deal for 2 reasons:
It’s a complete mind-shift from SKAN 3
It enables much more flexibility around the value of newly acquired users
Every app has flows that successful (ROI-returning) app users follow. And every app has flows that unprofitable users follow. The challenge in SKAN 3 is that sometimes the first few stages of user engagement and activity can look very similar for both groups. If that’s the case for you, in SKAN 4 you can decrease conversion values during the postback timer periods and supply yourself with valuable data for decision-making.
Example:
You run a subscription app
Some users sign up and provide long-term revenue
Some users sign up but cancel their subscriptions after the trial period
If you can find differences between those groups (and you might have multiple subgroups within each) you can include that data in your SKAN 4.0 postbacks
That data can help you value cohorts, estimate LTV, and optimize ad budget allocation
Preparation: getting ready for the SKAN 3 to SKAN 4 transition
OK. You’ve either read or skimmed through 1,800 words of how SKAN 4 works, or you skipped down here right away. What do you need to do to prepare for the transition from SKAN 3 to SKAN 4?
We’ve put together a detailed SKAN 4.0 readiness checklist which you can check out. But in short, here’s what you need to do:
1: Update the Singular SDK in your app
Sure, it’s obvious, but it also requires communication, preparation, and action on the part of your product team: schedule an update to the Singular SDK in your app. As of November 2022, the Singular SDK has been SKAN 4 ready.
And don’t worry: it’s SKAN 3 backwards compatible, so there’s no worry or risk of damage to existing SKAdNetwork implementations or attributions on legacy campaigns. You can safely update.
2: Talk to your acquisition and monetization partners
Find out where they are in their SKAN 4 transition plans. If they’re already moving forward now, you need to catch up. You can get a good sense of where major user acquisition ad partners are in their SKAN 4 transition plans at our SKAN 4 adoption dashboard.
All that is actually needed to generate SKAn 4 postbacks is this:
iOS 16.1 device (and up)
Ad network encodes SKAN 4 click
These are getting pretty common. Most iOS users have updated to iOS 16, and many ad partners are sending at least some of their postbacks as SKAN 4 postbacks. What that means is that if you haven’t set up a SKAN 4 model in your Singular dashboard, you’re going to be missing some data. (Note: it’s pretty easy … click a button and choose some settings.) In particular, you won’t get any data for coarse conversion values: there’s no model prepared to receive that data.
So have the conversation and get started.
3: Talk to your web partners
If you currently run ads on the web or are now considering it thanks to SKAN 4, chat with those ad partners as well.
Get details on their timetables and anything you might need to do to integrate or work together.
4: Share your source identifier hierarchies
Part of the reason you want data from SKAdNetwork is to know what’s working.
Part of the reason ad networks need data from SKAdNetwork is essentially for the same reason: so that they can optimize campaign targeting, delivery, and volume in near real-time to deliver the best results for marketers. Share what you’ve encoded into the SKAN 4 source identifier digits, so they know when they’ve succeeded, know when they’ve failed, and can act appropriately in each circumstance.
Singular makes this easy and automatic: talk to your customer success manager for any details or clarification you might need.
5: Plan your coarse conversion value strategy
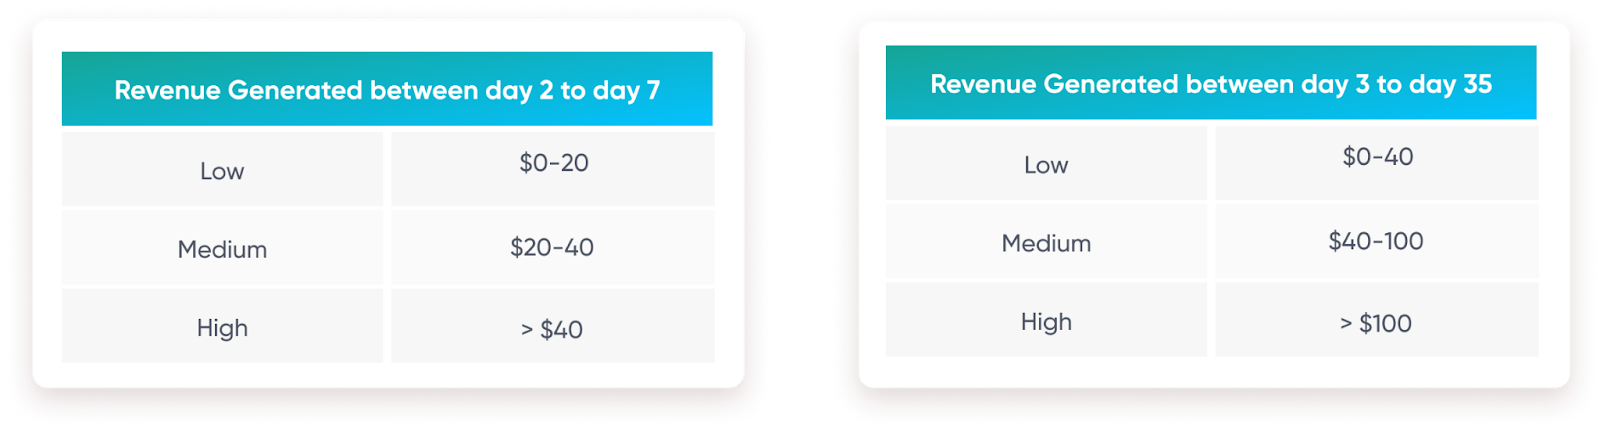
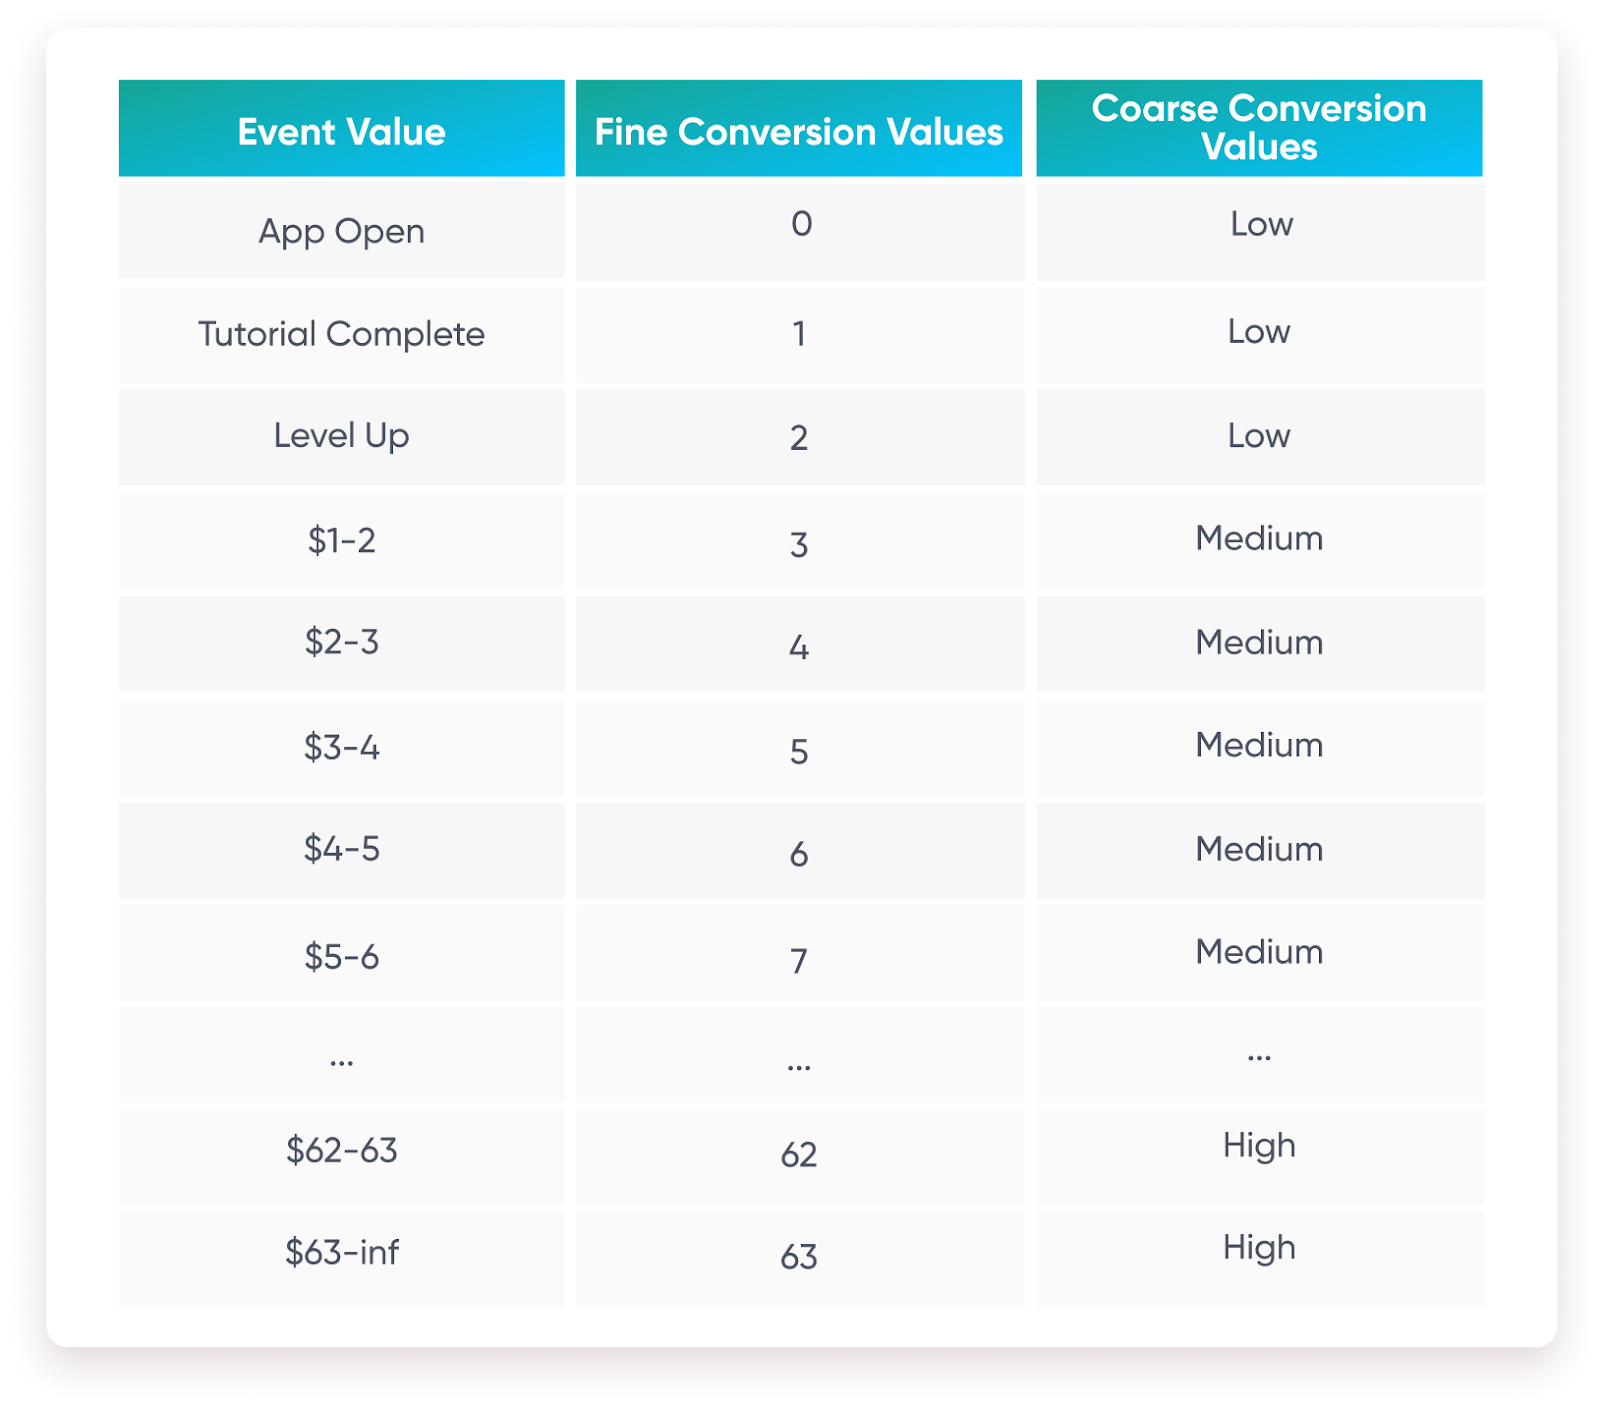
In some cases, due to low install volume, all you’ll get for postback 1 is a coarse conversion value. And for postbacks 2 and 3, that’s all it’s possible to get. Decide how to use coarse conversion values and what events or revenue amounts to encode to each of the 3 coarse values: low, medium, high:
Something we’ve see work: align your coarse conversion value strategy with your fine conversion value strategy, so that whatever data you get back — whether it was from fine or coarse — is coherent and actionable.
A coherent strategy between the 2 possible conversion payloads will ensure that your coarse conversion postbacks will be comparable and speaking the same language as your fine conversion postbacks, though of course they will be less specific.
Here’s an example with a mixed event/revenue model:
With a simpler revenue-only model, decide which revenue ranges in your fine conversion values should count as “low” in your coarse conversion values, and do the same for both “medium” and “high.”
6: Build a framework to evaluate users at each of the 3 postback stages
The good news is that Singular will enhance reporting at each stage with SKAN Advanced Analytics, modeling for missing data due to insufficient crowd anonymity, and enriching cohort reporting for revenue and ROI at each stage.
Even better: you’ll get confidence intervals so you know how much you can trust the modeled data: critical if you’re making significant budgeting decisions. And now with Unified Measurement augmenting SKAN data with MMP data and first-party data, SKAN in general is significantly more valuable as a measurement method.
Add that to the extra information you can get from SKAN 4, and it’s a world of difference from the first few months of using SKAN 3.
Implementation: building your SKAN 4 transition strategy
OK. You’ve learned, you’re prepared, and you’re ready to begin making the transition.
Wait just a moment. You may have all the technical details down pat, but there are a few strategic questions to answer before you flip the switch.
1. Building your conversion value models
Decide what data you need from each of the 4 possible postbacks you’ll be getting.
As I stated above, postback 1 fine and coarse conversion values should be aligned so that your post-install conversion data is compatible and makes sense. Postbacks 2 and 3 should be deep-funnel events that take place between D2-D35 or high-value conversions that will provide the most critical possible insight about the value of each cohort.
Possible models include:
Revenue
Conversion events
Engagement
Funnel
Mixed models
Conversion Events and Revenue
Engagement and Revenue
Funnel and Revenue
Custom events/revenue model
Bear in mind that most mobile experts don’t expect to get this right immediately. Don’t let the desire for perfection shackle you. Do what seems right, and you’ll be able to update it later without a long, painful transition period. (See model migration below.)
One other note: Singular already offers optimized SKAN conversion model recommendations in many situations. This feature literally ranks SKAN conversion models for effectiveness, analyzing your app, your postbacks, and your goals, and suggests the optimal conversion strategy. With always-on SKAN conversion model optimization checking in the background, you’ll get notified if there are potentially more accurate models to try.
2: Test, because Singular gives you easy model migrations
Model migration has historically been extremely challenging in SKAdNetwork. The problem has been that when you migrated to a new model, you suffer from data gaps as the old model ages out and the new one phases in. In SKAN 3, that could be weeks. Under SKAN 4, it could be a significantly more extreme challenge due to the very long possible postback time periods, plus random delays.
You could literally be waiting for a month and a half to have entirely present and clean data for the new model.
But not anymore.
The good news is that with Singular’s SKAN Advanced Analytics, you can migrate seamlessly and quickly, getting accurately modeled data on the same day you transition.
3: Decide whether you’ll use conversion locking or not
Remember what we said about postback timing and conversion locking? There is a massive range between the earliest to latest delivery times in SKAN 4. That massive diversity is poison to your ability to generate accurate modeled cohorts.
As mentioned earlier, SKAN 4 postbacks from the same campaign and from the same day could be separated by as much as:
Postback 1: up to 4 days
Postback 2: from 3 to 13 days
Postback 3: from 8 to 41 days
That’s why Singular’s recommendation to not use conversion locking. Your app is unique, your needs are unique, so your mileage may vary, of course, but in general, the cost of getting conversion value payloads in early postbacks is extremely high.
The challenge is that you have limited clarity on what day the conversion was locked, which creates a lot of uncertainty around the estimated install date. The result of that is cohorts are much harder to accurately model and your understanding of campaign value suffers. Sticking with the standard conversion windows for each of the postback periods buys you the certainty that each conversion was locked at the same time. Yes, there are still random timer delays, but 1 unknown is better than 2.
4: Choose when to set up your SKAN 4 models in Singular
You could literally be getting SKAN 4 postbacks right now. In fact, you almost certainly are, even before setting up your SKAN 4 models in your Singular MMP dashboard. This does result in missing data, so you should implement your new conversion model strategies now to make sure you’re getting all possible data.
The good news: a SKAN 3 click from an ad network that hasn’t yet encoded SKAN 4 clicks or a pre-iOS 16.1 device will be handled properly by Singular.
The challenge:
If you start getting SKAN 4 postbacks before you configure a SKAN 4 model, you’ll start seeing SKAN 4 data. However, you won’t get any data for coarse conversion values, because they haven’t yet been created and encoded into a model. You will see 4-digital source identifiers, if your campaigns achieve high levels of crowd anonymity.
Another challenge: transitioning.
Singular has created “transition mode” for the inevitable period in which you’ll be getting both SKAN 3 and SKAN 4 postbacks. In transition mode 1, you can start getting SKAN 4 postbacks, but because you don’t have a SKAN 4 model set up, you won’t get coarse values or postback 2 or 3. In transition mode 2, you will have set up a SKAN 4 model, and both SKAN 3 and SKAN 4 will work. However, while in transition mode 2, SKAN 4 conversions for the first postback period will be limited to 24 hours using conversion locking, so that all your data (SKAN 3.0 and SKAN 4) is equivalent and makes sense.
This is operable via a toggle mode, so you can turn transition mode — and which version of transition mode — on or off as you choose.
The key decision you’ll have to make upon chatting with your ad partners is deciding when you’ll only accept SKAN 4 data and therefore will not invest in any subsequent SKAN 3-only campaigns. For example, if you use 10 user acquisition ad networks but only 5 are fully updated for SKAN 4, you might choose to run in transition mode. If, on the other hand, 8 are fully updated for SKAN 4 and only 2 are not, you might decide to go full steam ahead on SKAN 4 and pause campaigns with the laggard ad networks until they complete their SKAdNetwork 4 build-out and configuration.
Running SKAN 4: what to expect in your Singular SKAN dashboard
Assuming you’ve worked through all of the above, prepared, strategized, and transitioned, you should end up in a happier place than you were with SKAdNetwork 3. Even if you used SKAN Advanced Analytics to achieve close to 90% accurate D7 revenue.
For SKAN 4, Singular will display a coherent view of the data from all the postbacks that you are getting, providing a single number for revenue, installs, and events for each campaign.
That’s thanks to a modeling layer which takes in all postbacks, including those with null conversion values, coarse conversion values (low, medium, high, or whatever you’ve chosen), and detailed fine conversion values. Singular’s technology also takes into account activity, engagement, and purchases in your own first-party data from your app, and then provides a modeled view of the data. Thanks to Unified Measurement you’ll also get Singular’s incredibly accurate modeling of actual installs and revenue, based on SKAN, MMP data, and your first-party data.
This campaign view will be aligned to the conversion models that you’ve set up for your SKAN 4 reporting, and will show what each campaign ID has achieved. That will include D1, D7, and D35 revenue, which is now more accurate than under SKAN 3 thanks to the additional data from SKAN 4.
With more data, you’ll also be able to set up SKAN 4 to provide deeper granularity for geo-based reporting:
With modeled data from each potential postback and your own in-app data, you’ll also be able to see cohort revenue. In fact, you’ll get 35-day cohorts in iOS thanks to Unified Measurement.
All of this is possible because Singular’s SKAdNetwork solution enriches campaign names, decodes conversion values, models missing data, and provides extremely accurate data estimates. All of which appears alongside your cost and percentage of installs that you’ve received conversion values for.
Get help?
We know this is complicated and new to most mobile marketers. Some haven’t had the chance to become SKAN 3 experts yet, and we’re already moving to SKAN 4, with the prospect of similar challenges on the Android side next year as Privacy Sandbox kicks into gear there.
These are massive delays, especially for the second and third postback. This is a really big deal, and it means that if marketers use the full postback update window in each case:
Postback 1 could arrive 3 to 4 days after an install
Postback 2 could be 10 to 15 days after an install
Postback 3 could be a staggering 36 to 41 days after an install
But that’s not all. Because this is SKAN 4, we’re not done with the complexity yet. There’s yet another new feature that Apple has introduced in SKAN 4 that can return SKAdNetwork postbacks sooner. It’s called locking conversion values.
If marketers and developers choose, they can lock conversion values as soon as their in-app analytics detect an acceptable level of data.
In other words, if someone installs your retail app and buys an item immediately, you could lock the conversion and prepare a postback to be sent right away. In a game, if they play 5 levels on day 0, you could do the same. Don’t forget, however, each postback still has to wait for the random delay to expire: between 1-2 days on postback 1, and between 1-6 days for postbacks 2 and 3.
(If Apple didn’t require this, advertisers could lock all postbacks regardless of value at some point and then, as above, tease out which postbacks relate to which new app users.)
This means that in a scenario where you get great engagement and activity basically immediately and you lock the postback, you could achieve the following postback arrival periods:
Postback 1 could arrive 1 to 2 days after install
Postback 2 could arrive 4 to 5 days after install
Postback 3 could arrive 8 to 14 days after an install
Have you spotted the core challenge here?
There’s a huge diversity between earliest possible and latest possible postback delivery times … which is poison for being able to measure and evaluate cohorts of new users. Essentially, marketers could see a potential diversity between earliest and latest possible postback delivery of:
Postback 1: from 1 to 4 days
Postback 2: from 3 to 13 days
Postback 3: from 8 to 41 days
Remember this delta.
That potential diversity in postback delivery dates will become significant for how you approach your SKAN 4 strategy, as you’ll see later in the section on making the transition from SKAN 3 to SKAN 4. Quick hint: it makes cohort measurement MUCH harder.
Web to app support: SKAN 4’s fourth big update
It’s not universal across all browsers — it only works in mobile Safari — and it’s not terribly comprehensive yet, but SKAN 4.0 does enable web to app measurement via the SKAdNetwork for Web Ads API.
The benefit for marketers is clear: web ads can be cheaper than in-app ads, and web onboarding experiences can be richer, more immersive, and more engaging than a standard app listing page in the App Store.
There are a bunch of steps to make it happen: the entity serving the SKAdNetwork-attributable link needs to be registered as an ad network with Apple, the link needs to be configured properly, and there must be an endpoint to provide a signed web ad impression, but there are some strong possibilities here in both web-to-app user acquisition.
(Note: for owned platforms such as your own website or landing page, you can simply use Singular deep links for full measurement and analytics capability.)
It’s possible we’ll see more updates for web to app support in SKAN 5.
Conversion value decreases: SKAN 4’s fifth big update
Finally: bear in mind that in SKAN 4, unlike SKAN 3, conversion values can go up AND down.
In SKAN 3, if you were updating a conversion value before the postback timer period clock ran up, it could only go up. Now in SKAN 4, you can also decrement conversion values.
This seems minor, but it’s a big deal for 2 reasons:
It’s a complete mind-shift from SKAN 3
It enables much more flexibility around the value of newly acquired users
Every app has flows that successful (ROI-returning) app users follow. And every app has flows that unprofitable users follow. The challenge in SKAN 3 is that sometimes the first few stages of user engagement and activity can look very similar for both groups. If that’s the case for you, in SKAN 4 you can decrease conversion values during the postback timer periods and supply yourself with valuable data for decision-making.
Example:
You run a subscription app
Some users sign up and provide long-term revenue
Some users sign up but cancel their subscriptions after the trial period
If you can find differences between those groups (and you might have multiple subgroups within each) you can include that data in your SKAN 4.0 postbacks
That data can help you value cohorts, estimate LTV, and optimize ad budget allocation
Preparation: getting ready for the SKAN 3 to SKAN 4 transition
OK. You’ve either read or skimmed through 1,800 words of how SKAN 4 works, or you skipped down here right away. What do you need to do to prepare for the transition from SKAN 3 to SKAN 4?
We’ve put together a detailed SKAN 4.0 readiness checklist which you can check out. But in short, here’s what you need to do:
1: Update the Singular SDK in your app
Sure, it’s obvious, but it also requires communication, preparation, and action on the part of your product team: schedule an update to the Singular SDK in your app. As of November 2022, the Singular SDK has been SKAN 4 ready.
And don’t worry: it’s SKAN 3 backwards compatible, so there’s no worry or risk of damage to existing SKAdNetwork implementations or attributions on legacy campaigns. You can safely update.
2: Talk to your acquisition and monetization partners
Find out where they are in their SKAN 4 transition plans. If they’re already moving forward now, you need to catch up. You can get a good sense of where major user acquisition ad partners are in their SKAN 4 transition plans at our SKAN 4 adoption dashboard.
All that is actually needed to generate SKAn 4 postbacks is this:
iOS 16.1 device (and up)
Ad network encodes SKAN 4 click
These are getting pretty common. Most iOS users have updated to iOS 16, and many ad partners are sending at least some of their postbacks as SKAN 4 postbacks. What that means is that if you haven’t set up a SKAN 4 model in your Singular dashboard, you’re going to be missing some data. (Note: it’s pretty easy … click a button and choose some settings.) In particular, you won’t get any data for coarse conversion values: there’s no model prepared to receive that data.
So have the conversation and get started.
3: Talk to your web partners
If you currently run ads on the web or are now considering it thanks to SKAN 4, chat with those ad partners as well.
Get details on their timetables and anything you might need to do to integrate or work together.
4: Share your source identifier hierarchies
Part of the reason you want data from SKAdNetwork is to know what’s working.
Part of the reason ad networks need data from SKAdNetwork is essentially for the same reason: so that they can optimize campaign targeting, delivery, and volume in near real-time to deliver the best results for marketers. Share what you’ve encoded into the SKAN 4 source identifier digits, so they know when they’ve succeeded, know when they’ve failed, and can act appropriately in each circumstance.
Singular makes this easy and automatic: talk to your customer success manager for any details or clarification you might need.
5: Plan your coarse conversion value strategy
In some cases, due to low install volume, all you’ll get for postback 1 is a coarse conversion value. And for postbacks 2 and 3, that’s all it’s possible to get. Decide how to use coarse conversion values and what events or revenue amounts to encode to each of the 3 coarse values: low, medium, high:
Something we’ve see work: align your coarse conversion value strategy with your fine conversion value strategy, so that whatever data you get back — whether it was from fine or coarse — is coherent and actionable.
A coherent strategy between the 2 possible conversion payloads will ensure that your coarse conversion postbacks will be comparable and speaking the same language as your fine conversion postbacks, though of course they will be less specific.
Here’s an example with a mixed event/revenue model:
With a simpler revenue-only model, decide which revenue ranges in your fine conversion values should count as “low” in your coarse conversion values, and do the same for both “medium” and “high.”
6: Build a framework to evaluate users at each of the 3 postback stages
The good news is that Singular will enhance reporting at each stage with SKAN Advanced Analytics, modeling for missing data due to insufficient crowd anonymity, and enriching cohort reporting for revenue and ROI at each stage.
Even better: you’ll get confidence intervals so you know how much you can trust the modeled data: critical if you’re making significant budgeting decisions. And now with Unified Measurement augmenting SKAN data with MMP data and first-party data, SKAN in general is significantly more valuable as a measurement method.
Add that to the extra information you can get from SKAN 4, and it’s a world of difference from the first few months of using SKAN 3.
Implementation: building your SKAN 4 transition strategy
OK. You’ve learned, you’re prepared, and you’re ready to begin making the transition.
Wait just a moment. You may have all the technical details down pat, but there are a few strategic questions to answer before you flip the switch.
1. Building your conversion value models
Decide what data you need from each of the 4 possible postbacks you’ll be getting.
As I stated above, postback 1 fine and coarse conversion values should be aligned so that your post-install conversion data is compatible and makes sense. Postbacks 2 and 3 should be deep-funnel events that take place between D2-D35 or high-value conversions that will provide the most critical possible insight about the value of each cohort.
Possible models include:
Revenue
Conversion events
Engagement
Funnel
Mixed models
Conversion Events and Revenue
Engagement and Revenue
Funnel and Revenue
Custom events/revenue model
Bear in mind that most mobile experts don’t expect to get this right immediately. Don’t let the desire for perfection shackle you. Do what seems right, and you’ll be able to update it later without a long, painful transition period. (See model migration below.)
One other note: Singular already offers optimized SKAN conversion model recommendations in many situations. This feature literally ranks SKAN conversion models for effectiveness, analyzing your app, your postbacks, and your goals, and suggests the optimal conversion strategy. With always-on SKAN conversion model optimization checking in the background, you’ll get notified if there are potentially more accurate models to try.
2: Test, because Singular gives you easy model migrations
Model migration has historically been extremely challenging in SKAdNetwork. The problem has been that when you migrated to a new model, you suffer from data gaps as the old model ages out and the new one phases in. In SKAN 3, that could be weeks. Under SKAN 4, it could be a significantly more extreme challenge due to the very long possible postback time periods, plus random delays.
You could literally be waiting for a month and a half to have entirely present and clean data for the new model.
But not anymore.
The good news is that with Singular’s SKAN Advanced Analytics, you can migrate seamlessly and quickly, getting accurately modeled data on the same day you transition.
3: Decide whether you’ll use conversion locking or not
Remember what we said about postback timing and conversion locking? There is a massive range between the earliest to latest delivery times in SKAN 4. That massive diversity is poison to your ability to generate accurate modeled cohorts.
As mentioned earlier, SKAN 4 postbacks from the same campaign and from the same day could be separated by as much as:
Postback 1: up to 4 days
Postback 2: from 3 to 13 days
Postback 3: from 8 to 41 days
That’s why Singular’s recommendation to not use conversion locking. Your app is unique, your needs are unique, so your mileage may vary, of course, but in general, the cost of getting conversion value payloads in early postbacks is extremely high.
The challenge is that you have limited clarity on what day the conversion was locked, which creates a lot of uncertainty around the estimated install date. The result of that is cohorts are much harder to accurately model and your understanding of campaign value suffers. Sticking with the standard conversion windows for each of the postback periods buys you the certainty that each conversion was locked at the same time. Yes, there are still random timer delays, but 1 unknown is better than 2.
4: Choose when to set up your SKAN 4 models in Singular
You could literally be getting SKAN 4 postbacks right now. In fact, you almost certainly are, even before setting up your SKAN 4 models in your Singular MMP dashboard. This does result in missing data, so you should implement your new conversion model strategies now to make sure you’re getting all possible data.
The good news: a SKAN 3 click from an ad network that hasn’t yet encoded SKAN 4 clicks or a pre-iOS 16.1 device will be handled properly by Singular.
The challenge:
If you start getting SKAN 4 postbacks before you configure a SKAN 4 model, you’ll start seeing SKAN 4 data. However, you won’t get any data for coarse conversion values, because they haven’t yet been created and encoded into a model. You will see 4-digital source identifiers, if your campaigns achieve high levels of crowd anonymity.
Another challenge: transitioning.
Singular has created “transition mode” for the inevitable period in which you’ll be getting both SKAN 3 and SKAN 4 postbacks. In transition mode 1, you can start getting SKAN 4 postbacks, but because you don’t have a SKAN 4 model set up, you won’t get coarse values or postback 2 or 3. In transition mode 2, you will have set up a SKAN 4 model, and both SKAN 3 and SKAN 4 will work. However, while in transition mode 2, SKAN 4 conversions for the first postback period will be limited to 24 hours using conversion locking, so that all your data (SKAN 3.0 and SKAN 4) is equivalent and makes sense.
This is operable via a toggle mode, so you can turn transition mode — and which version of transition mode — on or off as you choose.
The key decision you’ll have to make upon chatting with your ad partners is deciding when you’ll only accept SKAN 4 data and therefore will not invest in any subsequent SKAN 3-only campaigns. For example, if you use 10 user acquisition ad networks but only 5 are fully updated for SKAN 4, you might choose to run in transition mode. If, on the other hand, 8 are fully updated for SKAN 4 and only 2 are not, you might decide to go full steam ahead on SKAN 4 and pause campaigns with the laggard ad networks until they complete their SKAdNetwork 4 build-out and configuration.
Running SKAN 4: what to expect in your Singular SKAN dashboard
Assuming you’ve worked through all of the above, prepared, strategized, and transitioned, you should end up in a happier place than you were with SKAdNetwork 3. Even if you used SKAN Advanced Analytics to achieve close to 90% accurate D7 revenue.
For SKAN 4, Singular will display a coherent view of the data from all the postbacks that you are getting, providing a single number for revenue, installs, and events for each campaign.
That’s thanks to a modeling layer which takes in all postbacks, including those with null conversion values, coarse conversion values (low, medium, high, or whatever you’ve chosen), and detailed fine conversion values. Singular’s technology also takes into account activity, engagement, and purchases in your own first-party data from your app, and then provides a modeled view of the data. Thanks to Unified Measurement you’ll also get Singular’s incredibly accurate modeling of actual installs and revenue, based on SKAN, MMP data, and your first-party data.
This campaign view will be aligned to the conversion models that you’ve set up for your SKAN 4 reporting, and will show what each campaign ID has achieved. That will include D1, D7, and D35 revenue, which is now more accurate than under SKAN 3 thanks to the additional data from SKAN 4.
With more data, you’ll also be able to set up SKAN 4 to provide deeper granularity for geo-based reporting:
With modeled data from each potential postback and your own in-app data, you’ll also be able to see cohort revenue. In fact, you’ll get 35-day cohorts in iOS thanks to Unified Measurement.
All of this is possible because Singular’s SKAdNetwork solution enriches campaign names, decodes conversion values, models missing data, and provides extremely accurate data estimates. All of which appears alongside your cost and percentage of installs that you’ve received conversion values for.
Get help?
We know this is complicated and new to most mobile marketers. Some haven’t had the chance to become SKAN 3 experts yet, and we’re already moving to SKAN 4, with the prospect of similar challenges on the Android side next year as Privacy Sandbox kicks into gear there.