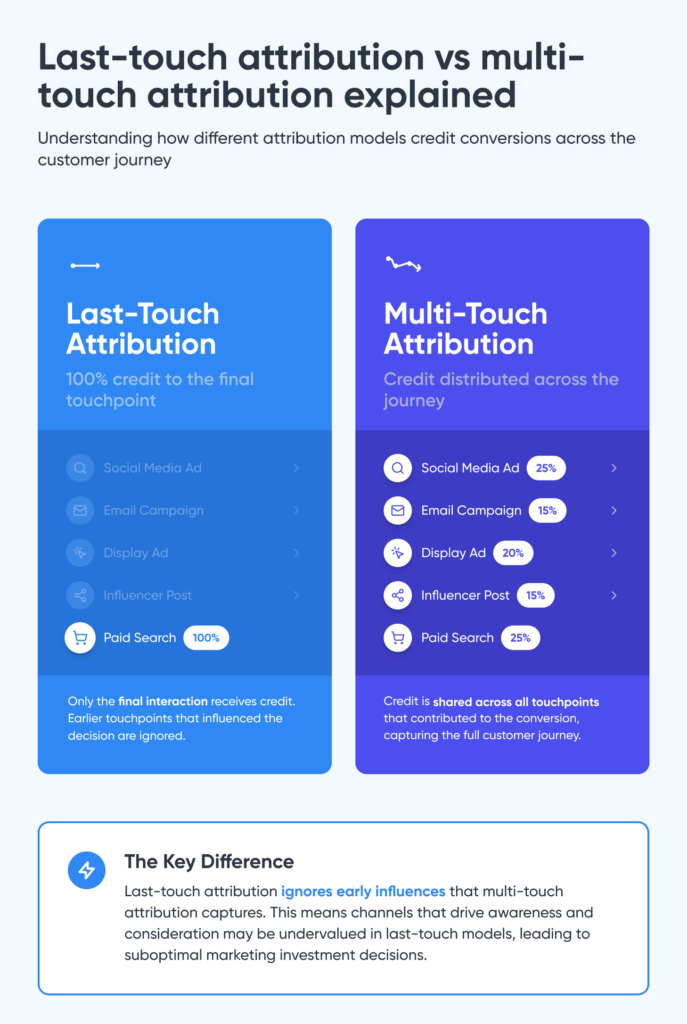
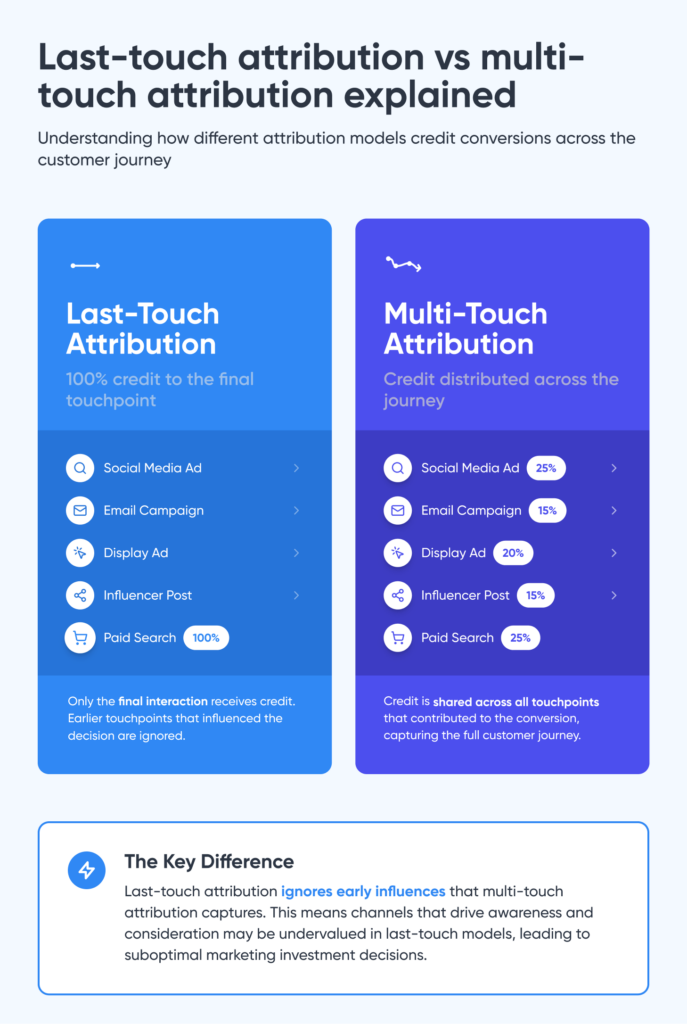
Last-touch attribution tells you who closed the deal. Multi-touch attribution tells you who made it possible.
Most mobile marketers still evaluate channel performance through last-touch attribution.
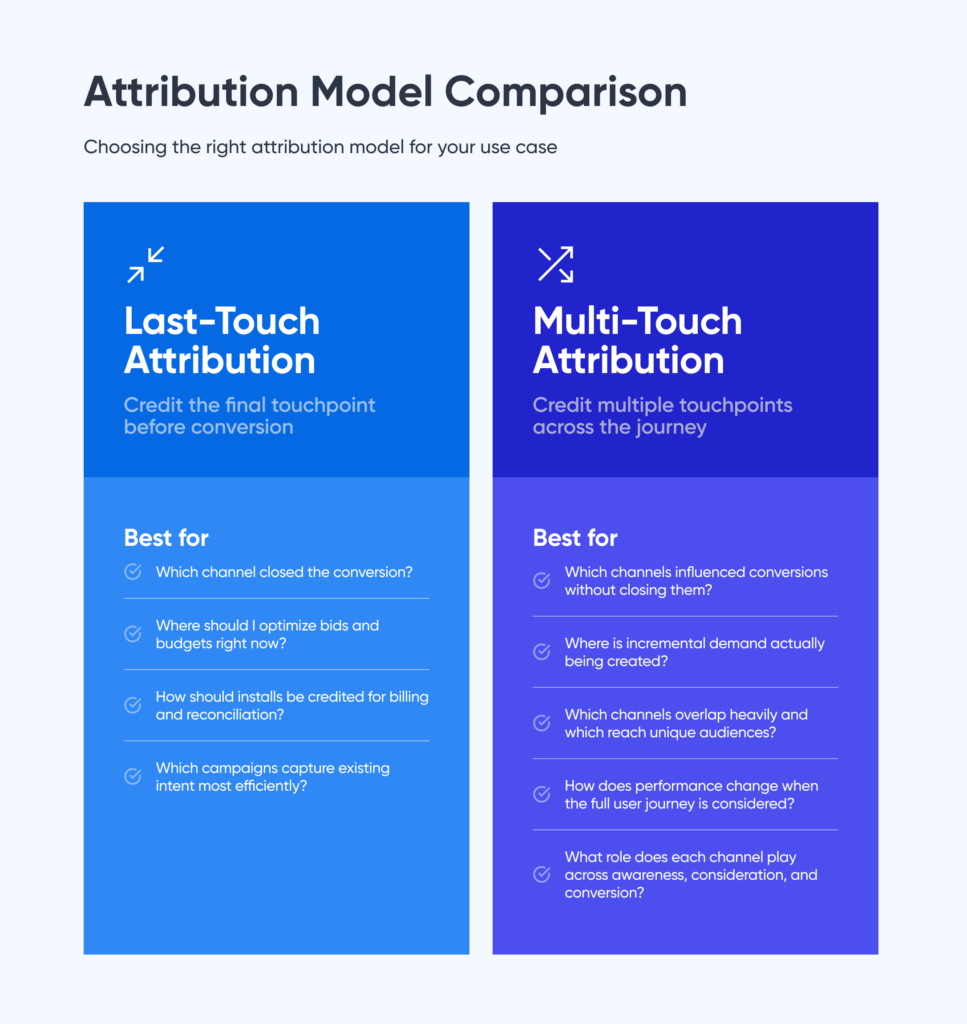
And to be fair, the last touch is extremely useful. It tells you:
- Which channel closed the conversion
- Where installs are credited
- How campaigns should be optimized in real time
But modern user journeys rarely involve just one interaction.
Users discover apps through one channel, research through another, and install after a final reminder somewhere else. When that happens, last-touch attribution often undervalues channels that influence the journey along the way.
That’s exactly why marketers are increasingly combining last-touch attribution with multi-touch attribution (MTA).
Instead of crediting just the final interaction, MTA analyzes the entire conversion path, assigning partial credit to every meaningful touchpoint.
And when you evaluate channel performance through that broader lens, the story can change dramatically.
Our latest data analysis of Snapchat advertising performance is a perfect example.
What our data shows about Snapchat’s role in the install journey
Singular’s data science team analyzed global mobile advertising performance data from Q4 2025 to better understand how different channels contribute to installs across the full user journey.
The results highlight something marketers often suspect, but don’t always see in last-click reporting:
Snapchat plays a much larger role in driving installs than last-touch attribution typically shows.
Here are the key findings.
Snapchat shows one of the highest assist rates in the industry
Our analysis shows that Snap averages a 51% assist rate across campaigns.
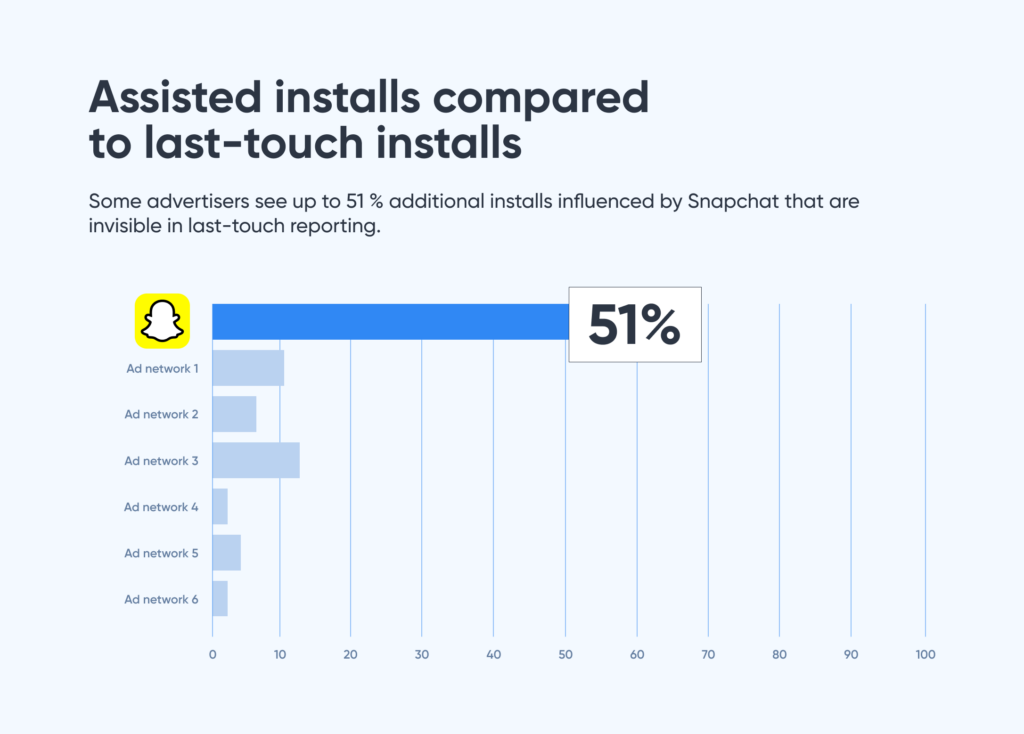
That means for every 10 installs directly attributed to Snapchat, Snapchat also assisted roughly 5 additional installs that were ultimately credited to another channel.
These are called assisted installs, cases where a channel influenced the user but didn’t receive final attribution credit.
High assist rates typically indicate a channel is playing a discovery or influence role earlier in the funnel, rather than simply capturing existing intent. Which checks out since Snapchat is both helping users discover apps before another channel closes the install and driving conversions.
And if you only look at last-touch reporting, that influence is largely invisible.
Snapchat reaches highly incremental audiences
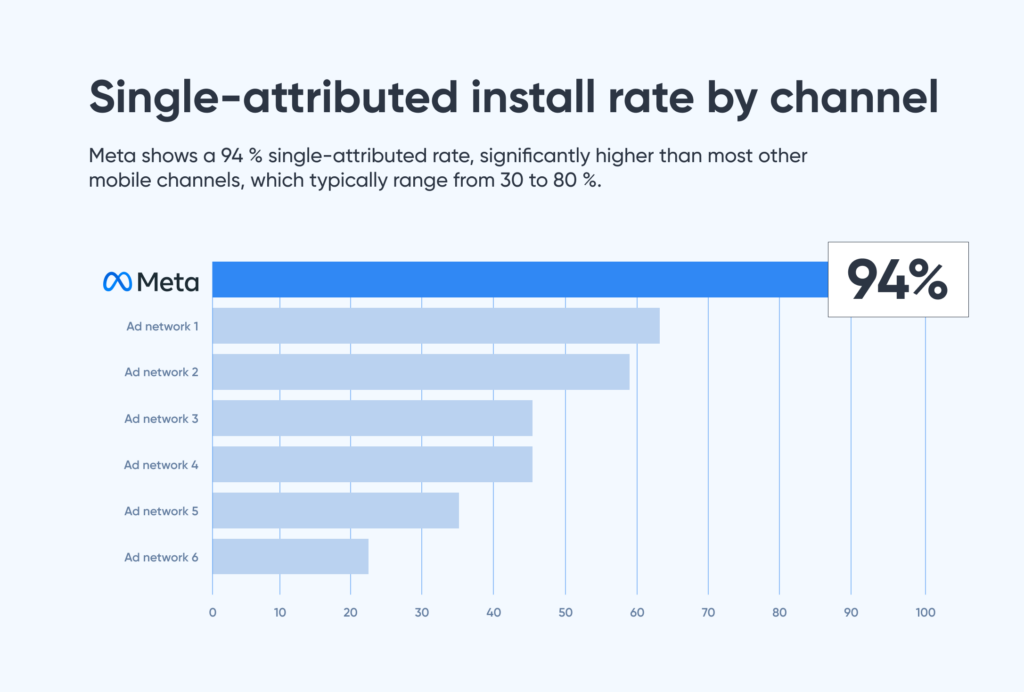
Another signal of Snapchat’s value appears in its Single-Attributed Install Rate.
Our analysis shows Snapchat with an 84% single-attributed rate.

Single-attributed installs occur when the install was attributed to one channel and no other advertising touchpoints were recorded in the journey.
This usually indicates unique audience reach.
For comparison, most mobile ad channels typically show 30%–80% single-attributed installs.
Snapchat sitting at 84% suggests that when Snap drives an install, that user is often not being reached by other networks at all.
For marketers, that usually signals true incremental demand creation, not just credit capture.
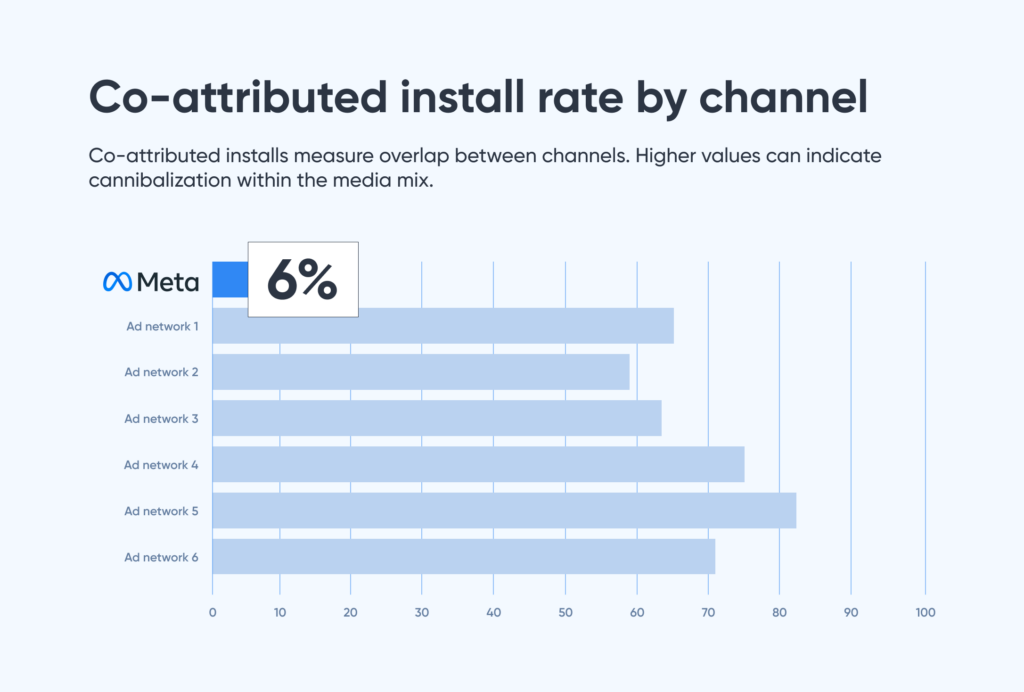
Low co-attribution suggests minimal channel cannibalization
The third metric we analyzed is co-attributed installs.
These occur when a channel receives the final attribution credit, but another channel influenced the user earlier in the journey.
High co-attribution rates can indicate overlap between networks, or cases where one channel frequently captures credit for installs driven by another.
Snapchat showed a very low 16% co-attributed rate in our analysis, suggesting its campaigns are less likely to cannibalize value created by other channels.
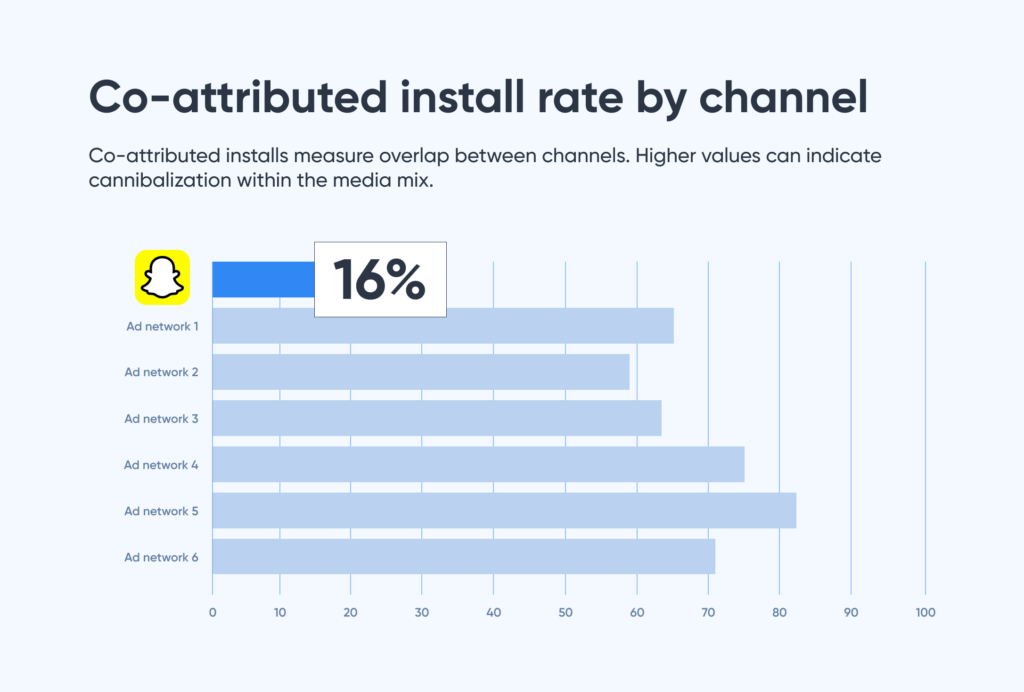
Many mobile channels can reach co-attribution levels as high as 70%.
Combined with its strong single-attribution rate, this paints a consistent picture:
Snapchat campaigns frequently reach users that other networks are not touching.
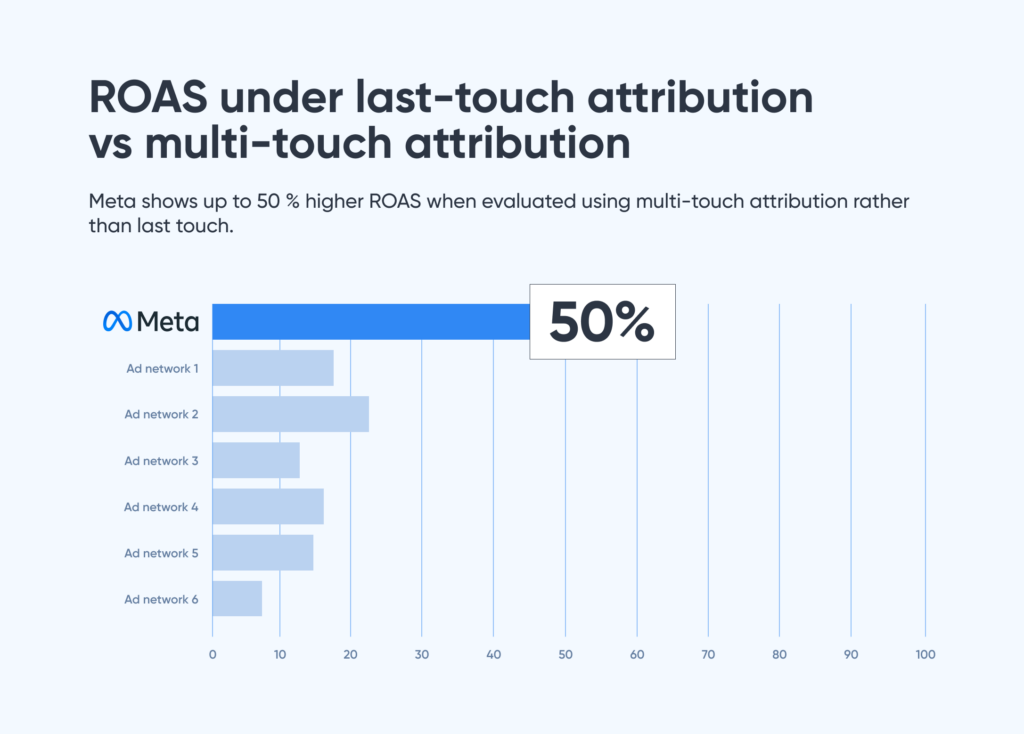
Multi-touch attribution reveals stronger ROAS from Snapchat campaigns
Finally, and perhaps most interesting, when we evaluated the same campaigns using MTA instead of last-touch attribution, Snapchat showed 20% higher ROAS on average.
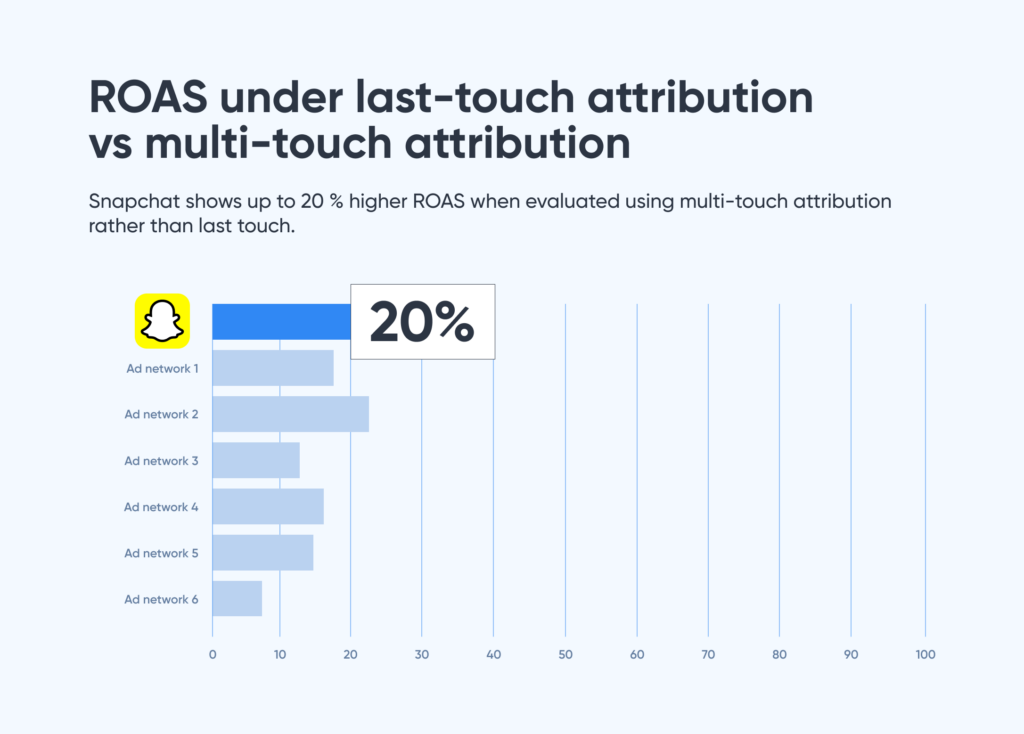
This is because MTA accounts for the entire user journey, not just the final interaction.
Singular’s model evaluates performance across three key signals:
- Single-attributed installs → high incremental value
- Co-attributed installs → lower incremental value
- Assisted installs → partial contribution
By weighting these interactions across the funnel, MTA recalculates metrics like CPI, CVR, and ROAS.
This provides a more realistic picture of channel contribution than last-touch attribution alone.
And in Snapchat’s case, the model consistently shows stronger performance when the full journey is considered. Marketers solely relying on last-click attribution run the risk of missing Snapchat’s channel impact, which can stunt their growth and spend efficiency within their current media mix.
Why discovery platforms often look undervalued in last-touch attribution
Not all advertising channels play the same role.
Some channels capture existing intent.
Others create it.
Intent-capture channels, like search, frequently appear strong under last-touch attribution because they often appear at the final moment before conversion.
Discovery-driven platforms like Snapchat often influence users earlier in the funnel, which means their holistic impact may not appear in last-touch reporting.

That doesn’t mean they’re underperforming. It simply means the measurement framework isn’t capturing their true influence across the journey.
This is exactly why many marketers are adding multi-touch attribution analysis alongside last-touch reporting.
Singular gives marketers both last-touch and multi-touch attribution out of the box
The reality is that marketers rarely need to choose one attribution model over another.
Each model answers different questions.
Last-touch attribution is excellent for:
- Operational reporting
- Campaign optimization
- Reconciliation and billing
Multi-touch attribution is better for:
- Understanding channel influence
- Evaluating incrementality
- And ultimately, making smarter budget allocation decisions that take into account full-funnel performance
That’s why Singular provides both.
Singular’s attribution platform includes:
- Last-touch attribution reporting
- Multi-touch attribution modeling
- Advanced Assist metrics across channels and campaigns
These capabilities are available to all Singular customers out of the box, with no additional add-on required.
Learn more about how Singular’s marketing attribution platform helps marketers measure performance across the full user journey by checking out this article recapping Singular’s MTA & Advanced Assists solutions.
The bottom line
Modern mobile marketing is no longer a single-touch journey.
Users discover, research, compare, and convert across multiple platforms and devices.
When measurement only credits the final click, marketers risk undervaluing channels that:
- Introduce new users
- Influence consideration
- Expand audience reach
Multi-touch attribution doesn’t replace last-touch reporting. It completes it.
And as this Snapchat analysis shows, once marketers look beyond the final click, they often uncover a very different story about where growth is actually coming from.
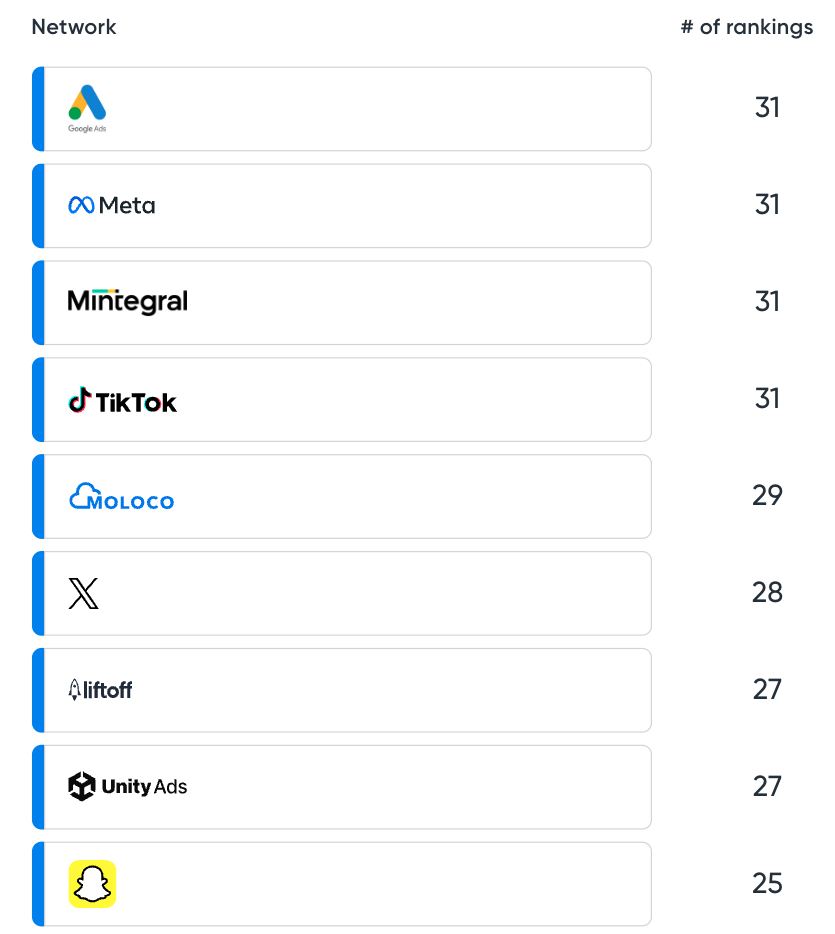
See how Snapchat ranks in the ROI Index 2026
The insights in this analysis are part of a much bigger picture. In the Singular ROI Index 2026, Snapchat appears across 25 ROI leaderboards, reinforcing its ability to drive both incremental reach and measurable performance across the funnel.
The full report goes beyond any single platform, giving you a comprehensive view of which ad partners are actually delivering results today, across both last-touch and multi-touch attribution.
If you’re looking to:
- Test new partners that can expand your reach
- Improve overall ROAS with a more diversified media mix
- Benchmark your performance against what’s working across the industry
Download the full, free ROI Index 2026 to see which partners are driving real impact and where you can unlock your next phase of growth.
FAQs
The Singular ROI Index is an annual mobile advertising performance benchmark built on trillions of impressions, billions of clicks, and billions of installs across thousands of ad networks and millions of campaigns worldwide. It ranks ad networks by verified ROI performance across OS splits, verticals, and regional markets.
Multi-touch attribution (MTA) is a measurement model that distributes conversion credit across every advertising touchpoint in a user’s path to install, not just the final click. It captures the discovery, consideration, and influence channels that last-touch models ignore.
Last-touch attribution assigns 100% of conversion credit to the final ad a user clicked before installing. Multi-touch attribution distributes credit across the full conversion path. Singular’s 2026 analysis found this difference produces up to 20% higher measured ROAS on Snapchat.
MTA Uplift measures the increase in a channel’s attributed contribution under multi-touch attribution compared to last-touch. A high MTA Uplift score indicates a platform whose impact on the user journey extends well beyond the final click.
Exclusive Reach measures installs where a single channel was the only advertising touchpoint in the conversion path. It indicates truly unique audience delivery: users that channel reached and converted with no assist from any other platform.
Platforms appearing across all three MTA metrics (Exclusive Reach, Assist Power, and MTA Uplift) include Snapchat, Meta, TikTok, Reddit, Liftoff, Moloco, and Mintegral.
Yes. The ATT disruption era is over. Scaled iOS leaderboards in the 2026 index show consistent performance across gaming and non-gaming verticals. Performance on iOS is now determined by attribution modeling sophistication, not platform instability.
The full report is available at singular.net/roi-index-2026.But modern user journeys rarely involve just one interaction.
Users discover apps through one channel, research through another, and install after a final reminder somewhere else. When that happens, last-touch attribution often undervalues channels that influence the journey along the way.
That’s exactly why marketers are increasingly combining last-touch attribution with multi-touch attribution (MTA).
Singular’s data science team analyzed global mobile advertising performance data from Q4 2025 to better understand how different channels contribute to installs across the full user journey.
The results highlight something marketers often suspect , but don’t always see in last-click reporting:
Snapchat plays a much larger role in driving installs than last-touch attribution typically shows.
Here are the key findings.