


Why this report matters now
And what you will do differently because of it
The data on creative performance tells a different story than most teams expect.
Over the past year, growth teams have dramatically increased creative output. The median advertiser now launches 13 new creatives per week. The top 25% of advertisers launch 53 or more (this is where the top quartile begins, not where it ends).
Top spenders maintain active portfolios of 5,000 to 10,000 creatives simultaneously. By almost every signal, the industry has converged on a shared belief: more creative is the answer to creative performance challenges.
But as output has scaled, a more fundamental question has gone largely unanswered: is all of this production actually translating into better performance? The data in this report has a surprising answer, and it changes how creative strategy should work.
This report is not about why creative matters. If you want to start there, read Winning with Creative first. This report picks up where that report left off: it is about what the data shows when you look at how creative performance actually works at scale, where the value concentrates, and how to build operational speed around the metrics that move results.
What you will learn
The new production baseline, and what separates the top quartile from the median
NewForm
How many ads it actually takes, and why Meta’s algorithm settles for “good enough” unless you force it further.
Why more creatives doesn’t necessarily mean better performance.
CRAFTSMAN+
How a live, unscripted moment, like a World Cup substitution, becomes a creative advantage instead of a missed window.
Where portfolio value concentrates, and how fast.
Liftoff x GameRefinery
The two motivational gaps quietly draining performance, and how to close them before your next brief.
Your vertical’s real CTR, CVR, and CPM benchmarks, and how to use them before a campaign launches, not after.
The five moves that separate optimizers from producers
MobileAction
Why the App Store product page is a creative surface now, not just a listing.
SplitMetrics
How to test for the motivation behind a click, not just the audience segment.
Start with the baseline. How much creative are growth teams actually producing, and where has the industry floor landed?
1. The creative production floor has risen
Most teams know output needs to go up. Fewer know where they actually sit relative to the field.
The new industry baseline: 13 creatives per week
Across Social, Search, and Display, the median advertiser now launches 13 new creatives per week, with an overall average of approximately 10. That is the midpoint of what active growth teams are doing. Worded differently, this has become the new competitive floor.
The distribution around that median tells a more important story.
3
new creatives / week
– bottom 25%
13
new creatives / week
– median
53+
new creatives / week
– where the top 25% starts
What the quartiles actually look like
- Bottom quartile (up to 3 new creatives per week).
These teams run creative as an occasional exercise rather than owning it as a dedicated function. A small set of proven assets runs continuously, often without systematic testing or refresh cadence. Creative decisions are reactive, triggered by performance drops rather than by planned iteration cycles. - Median advertiser (13 per week).
These teams have established a consistent testing cadence where creative is a recurring workflow. There is some dedicated creative support, whether internal or through an agency, and new assets are launched on a reasonably predictable schedule. This is the competitive baseline for active performance marketers in 2026. - Top quartile (53 or more per week).
This is the entry point to the top quartile rather than a typical figure, and output climbs steeply above it, particularly in verticals like Gaming, where weekly counts commonly run into the hundreds. Teams at this level have built creative production as a systematic operational function. These teams typically combine in-house creative capacity with agencies, AI-assisted production tools, or structured testing frameworks that generate variation at speed. Creative velocity is a managed metric, not an output of individual effort. - The gap between the bottom quartile and the top is not a matter of team size or ambition. It reflects a fundamental difference in how creative is organized and resourced. The question this report explores is whether that gap in volume translates into a gap in performance.
What this means for you
If your team is producing fewer than 13 new creatives per week, you are operating below the competitive median. If you are above it, the more important question is what that output is achieving. The following sections address this directly.
Volume by channel and vertical: strategy, not just output
Creative volume is not uniform across channels or verticals. The figures below represent average weekly output per advertiser within each vertical and channel type. They reflect the combined effect of each vertical’s conversion dynamics, CPM economics, and the creative formats that drive performance in that context.
| Vertical | Social (avg new/week) | Search (avg new/week) | Display (avg new/week) |
|---|---|---|---|
| Gaming | 12 | 11 | 17 |
| Finance | 18 | 14 | 18 |
| Entertainment | 13 | 10 | 14 |
| Shopping | 18 | 8 | 6 |
| Health & Fitness | 11 | 2 | 6 |
| Education | 23 | 3 | 25 |
| Travel | 6 | 12 | 3 |
Education leads Social output at 23 new creatives a week, and tops Display at 25. These are vertical averages for the median advertiser, not the 53+ top-quartile figure. Education teams test across awareness and performance channels at once, because the path from impression to install takes more consideration than most verticals require.
Travel breaks from the Social-heavy pattern elsewhere in the dataset: the lowest average Social output at 6 per week, and the highest Search output at 12. Travel users search with intent, and creative that meets a specific query beats broad Social placements, so volume follows where that intent actually shows up.
Gaming’s Display output of 17 per week is the highest in the dataset. Gaming advertisers use Display as an active testing ground, not a passive awareness channel, running standard video alongside playable ads and interactive end cards. Performance varies enough between formats to justify that volume.
Finance and Shopping both run high Social output at 18 per week. Both have long conversion journeys, where Social storytelling carries the consideration phase before the user is ready to act elsewhere.

Pro-tip
Singular’s Creative IQ tracks output velocity by channel automatically, flagging when a channel’s refresh rate is falling behind before performance starts to drop. See Creative IQ.
These numbers establish what teams are producing. What the data shows next about whether that production is driving better performance is where the real story begins.
PARTNER CONTRIBUTION

NewForm tested tens of thousands of creatives across nearly 100 clients. Their findings:
Each dollar must be spent learning or earning. You’re either scaling a creative that works or testing a hypothesis. There isn’t anything else to performance marketing.
Principle 1: Learn or earn
Every dollar in a Meta account is either scaling something that already works or testing a hypothesis about something that might. There is no third bucket. Treating a testing campaign like a scaling campaign, or the reverse, is where most budgets quietly leak.
Principle 2: Trust the algo, but know how it works
Meta’s ad delivery has stayed remarkably stable through nearly two decades of platform changes and world events, which is a real achievement built on machine-learning models making millions of decisions a second. That stability has a side effect worth understanding before you fight it.
Predictions from a system like this are inherently probabilistic, and small shifts in the data compound in ways that are hard to trace back to a single cause. The practical result is a system that is excellent at exploiting audiences already working for you, and cautious about taking unproven bets elsewhere.
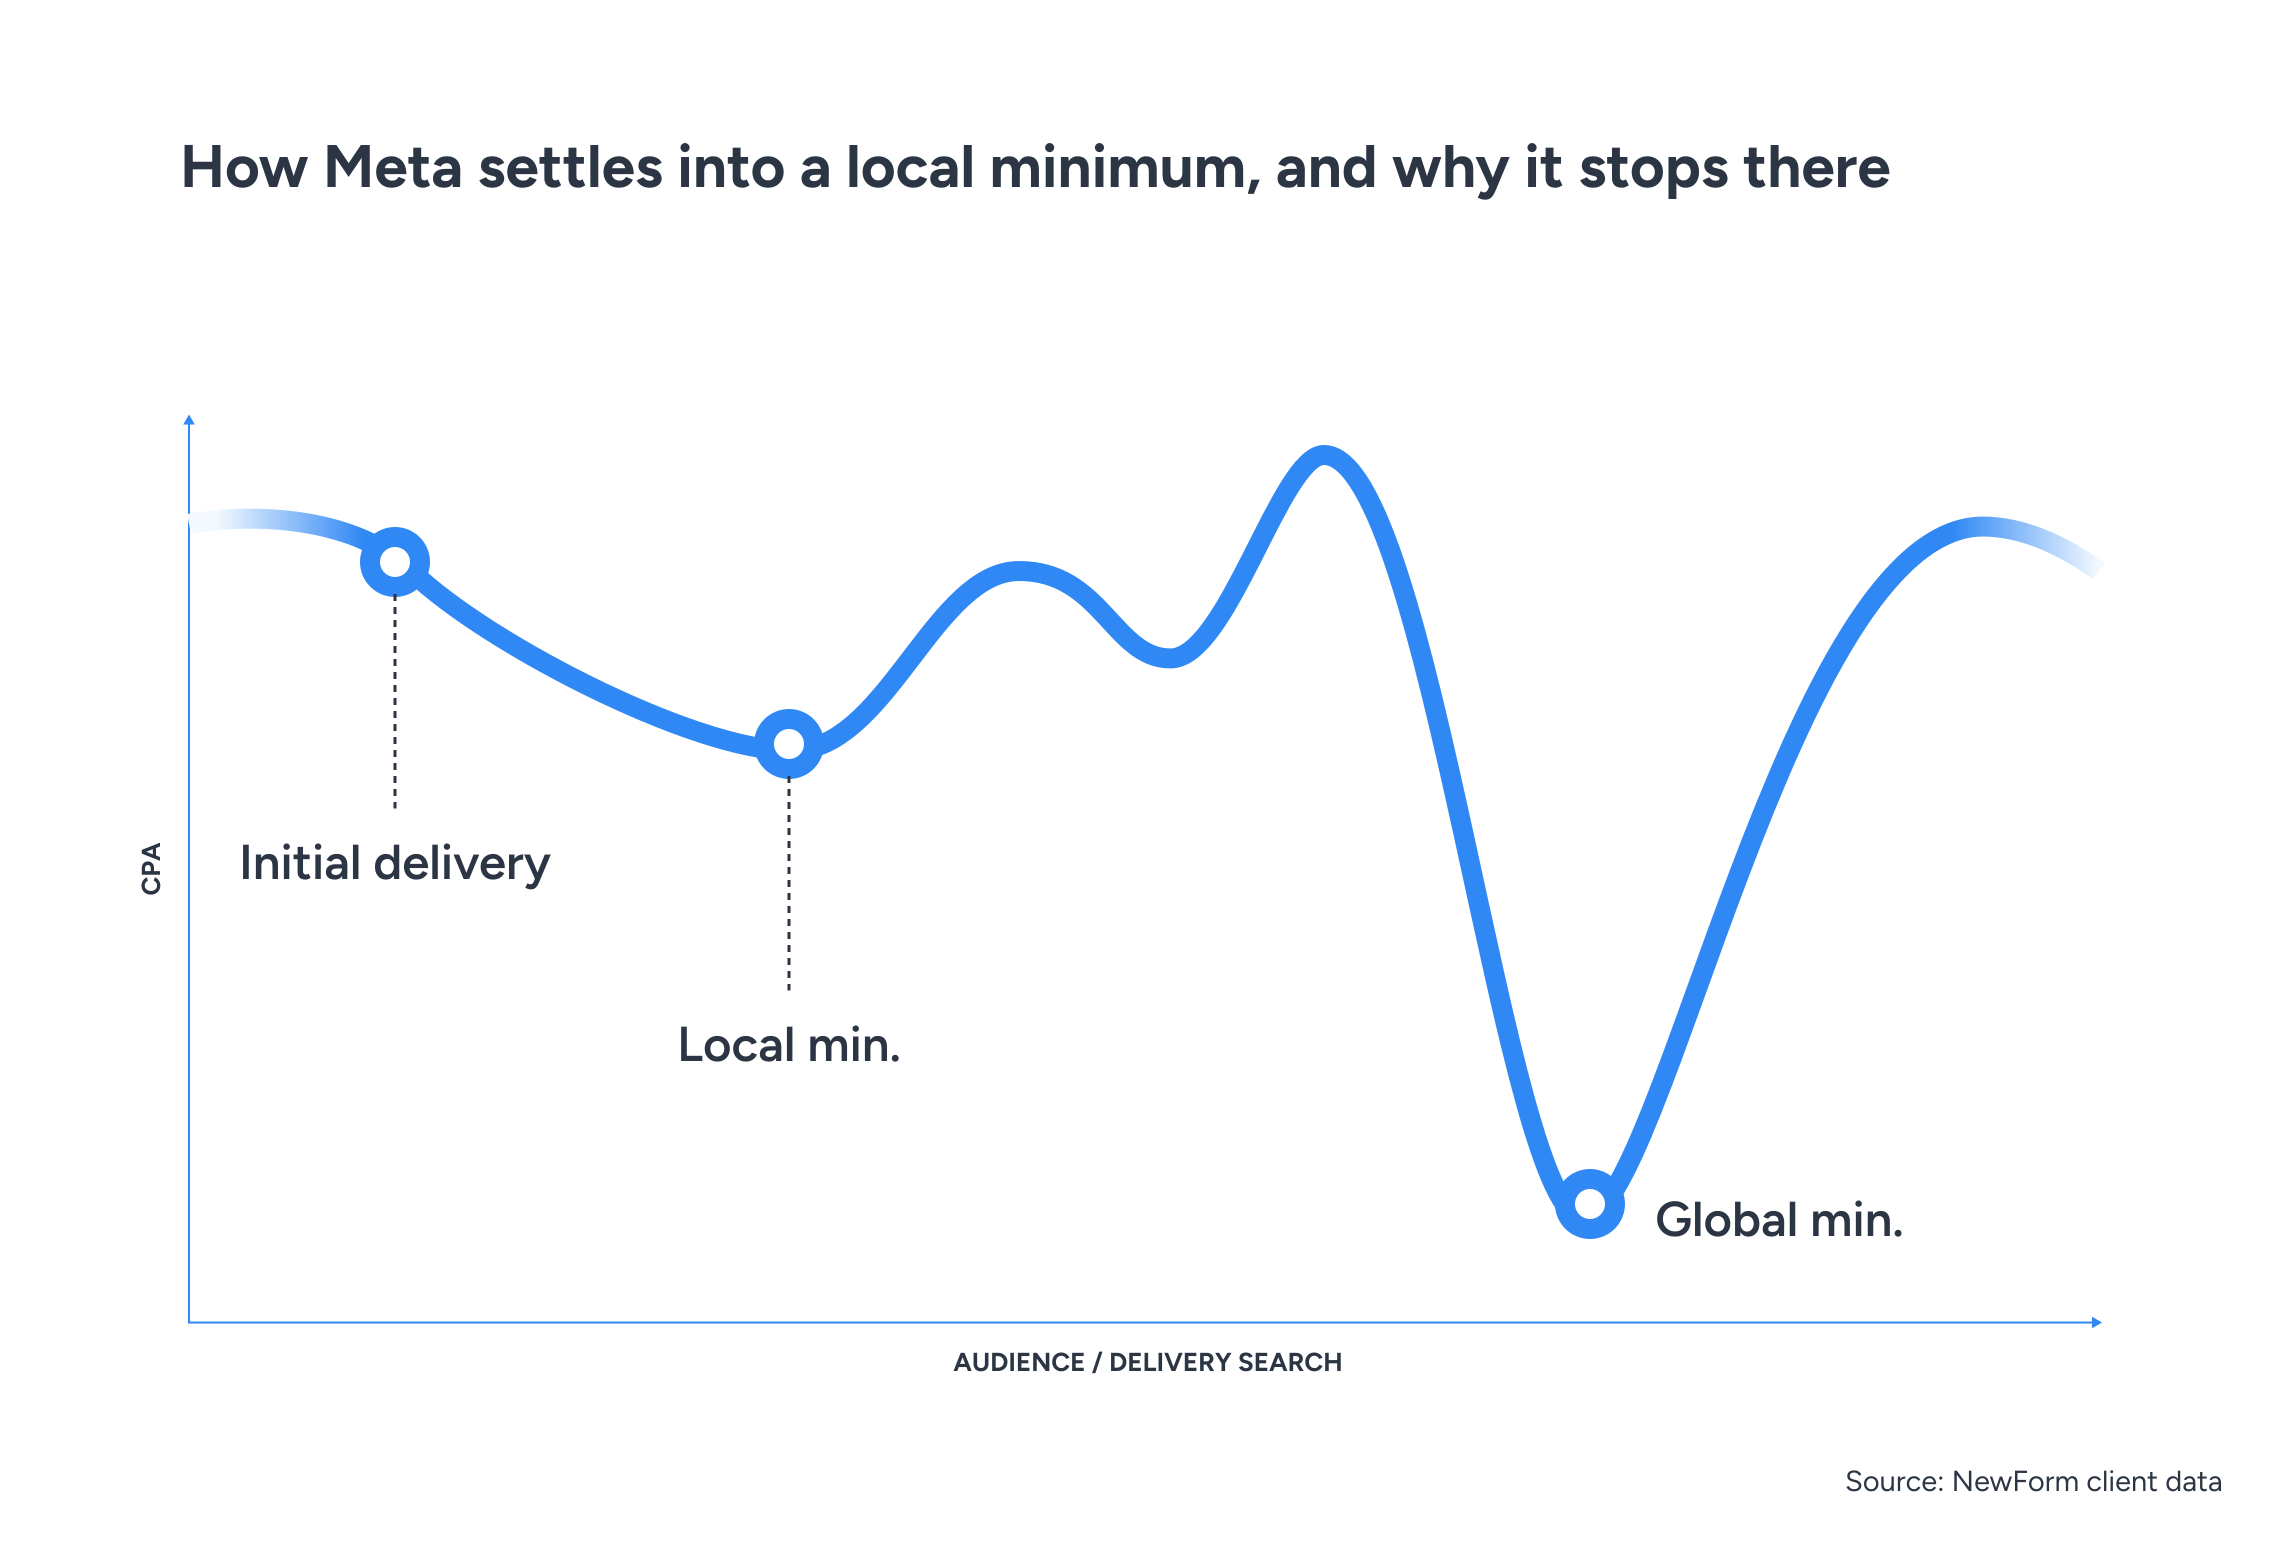
Launch a creative and the algorithm places it somewhere in the audience space, then optimizes from that initial delivery point down to the nearest local minimum CPA. What it will not do on its own is climb back out of that hole to go searching for a deeper, better minimum elsewhere in the graph.
Meta will always test small budgets against new audiences in the background, but it structurally favours the stable equilibrium it has already found. Left alone, an account converges on “good enough” rather than “best available.”
Principle 3: Force spend on new creative
Since the system will not go looking for the deeper minimum on its own, the account has to force it there with fresh creative and real budget behind it.
- Separate testing and scaling campaigns. Once a creative wins, graduate it into the scaling campaign using Post ID, which keeps its existing likes and comments intact instead of restarting from zero social proof.
- Fund each new concept properly. Meta’s own learning-phase guidance points to roughly 50 or more conversions before a placement has enough signal to judge; that is not a hard rule, but it is what the statistics need to say anything reliable.
- Optimize for the lowest down-funnel event you can actually afford to test on, provided it clears in the first few days post-install, ideally on D0. A delayed event starves the algorithm of the signal it needs to learn.
Why fund testing at roughly 10x the target CPA? Because most ads miss their CPA target rather than hit it. In NewForm’s data, the average ad runs at more than double its target CPA. A budget that size gives the system room to test through the misses and still land on the ones that work.
10x
CPA target per day – minimum test budget per concept
~2x
CPA target – where the average ad actually lands
Source: NewForm client data – mean 223.9% of CPA target, median 177.4%, across all ads analyzed.
How many ads should you make
Creative fatigues at about 3 to 4% week over week. There’s a sharp jump in CPC from week 1 to week 2 as the initial delivery settles, then a steadier climb after that.
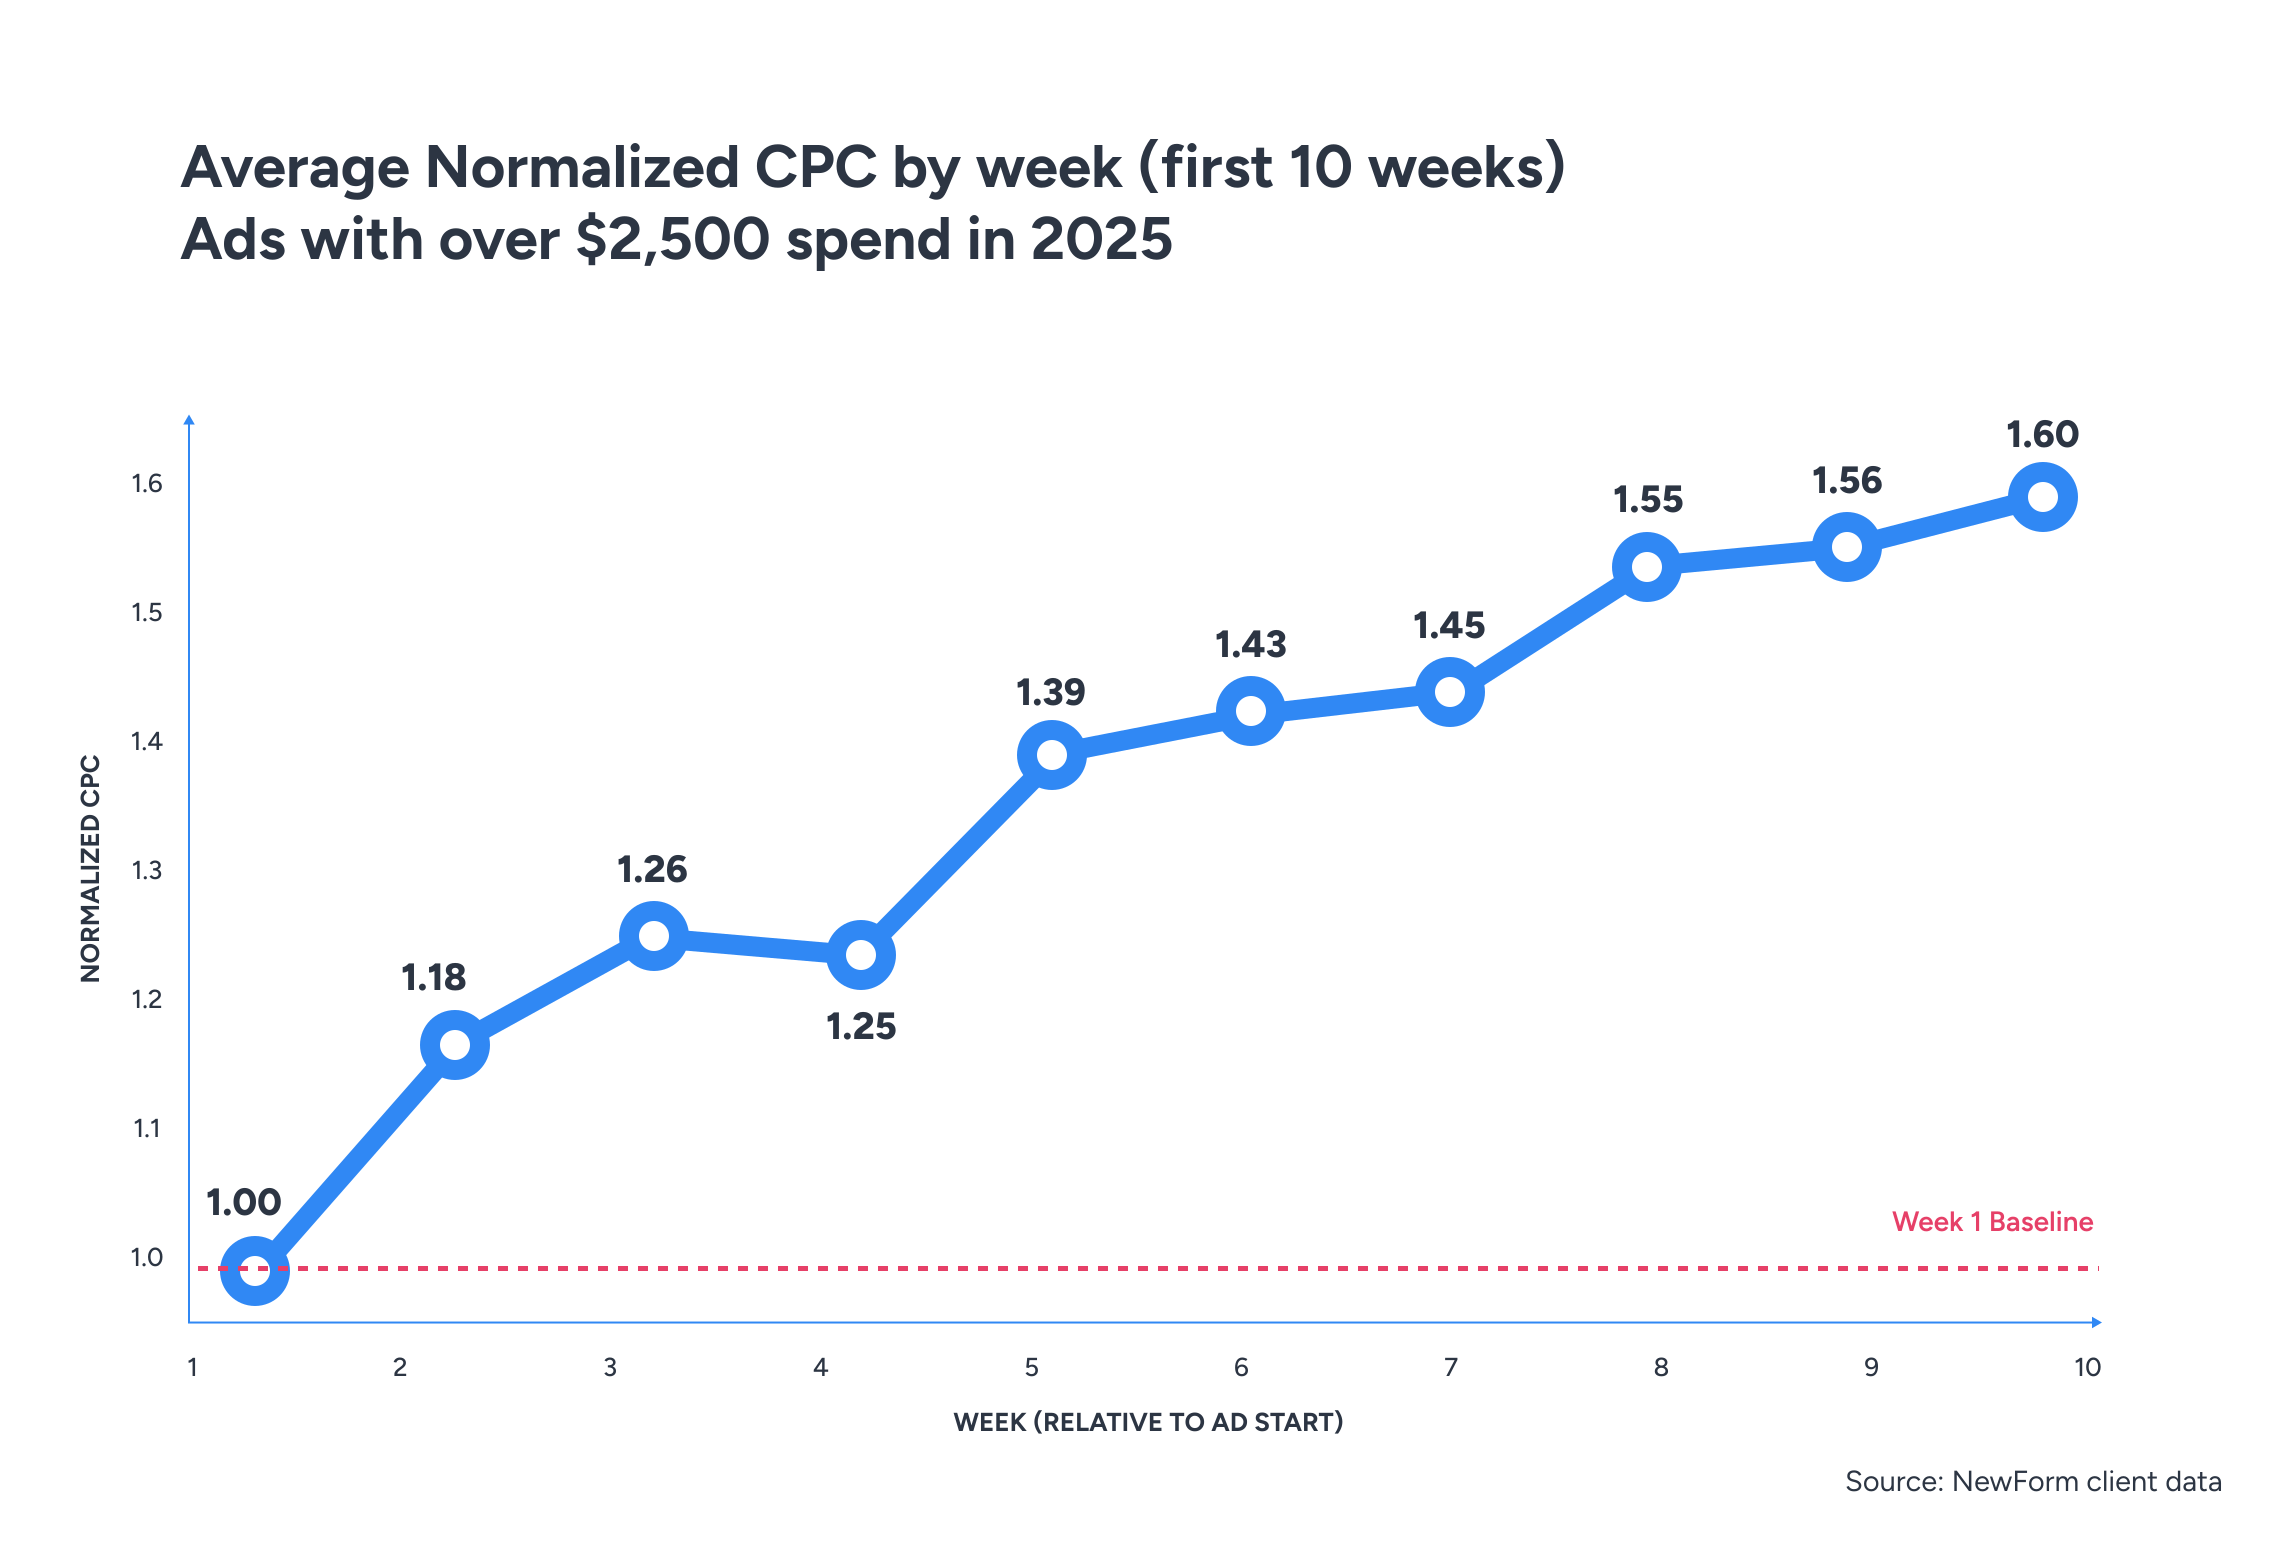
By week 10, CPC has risen to about 1.6x its week-1 baseline. The average winner runs at roughly 60% of KPI target, which means a creative that started strong is, by week 10, performing right at the baseline and needs to be turned off before it crosses it.
Where the minimum volume floor sits depends on the spend tier, as covered in Section 01, which provides that range.
Concepts vs variations
Not every ad needs to be a new concept. Meta’s stochastic nature means a small change, a different hook, a different opening frame, can swing performance on its own, so a single execution is not a fair test of whether the underlying idea works.
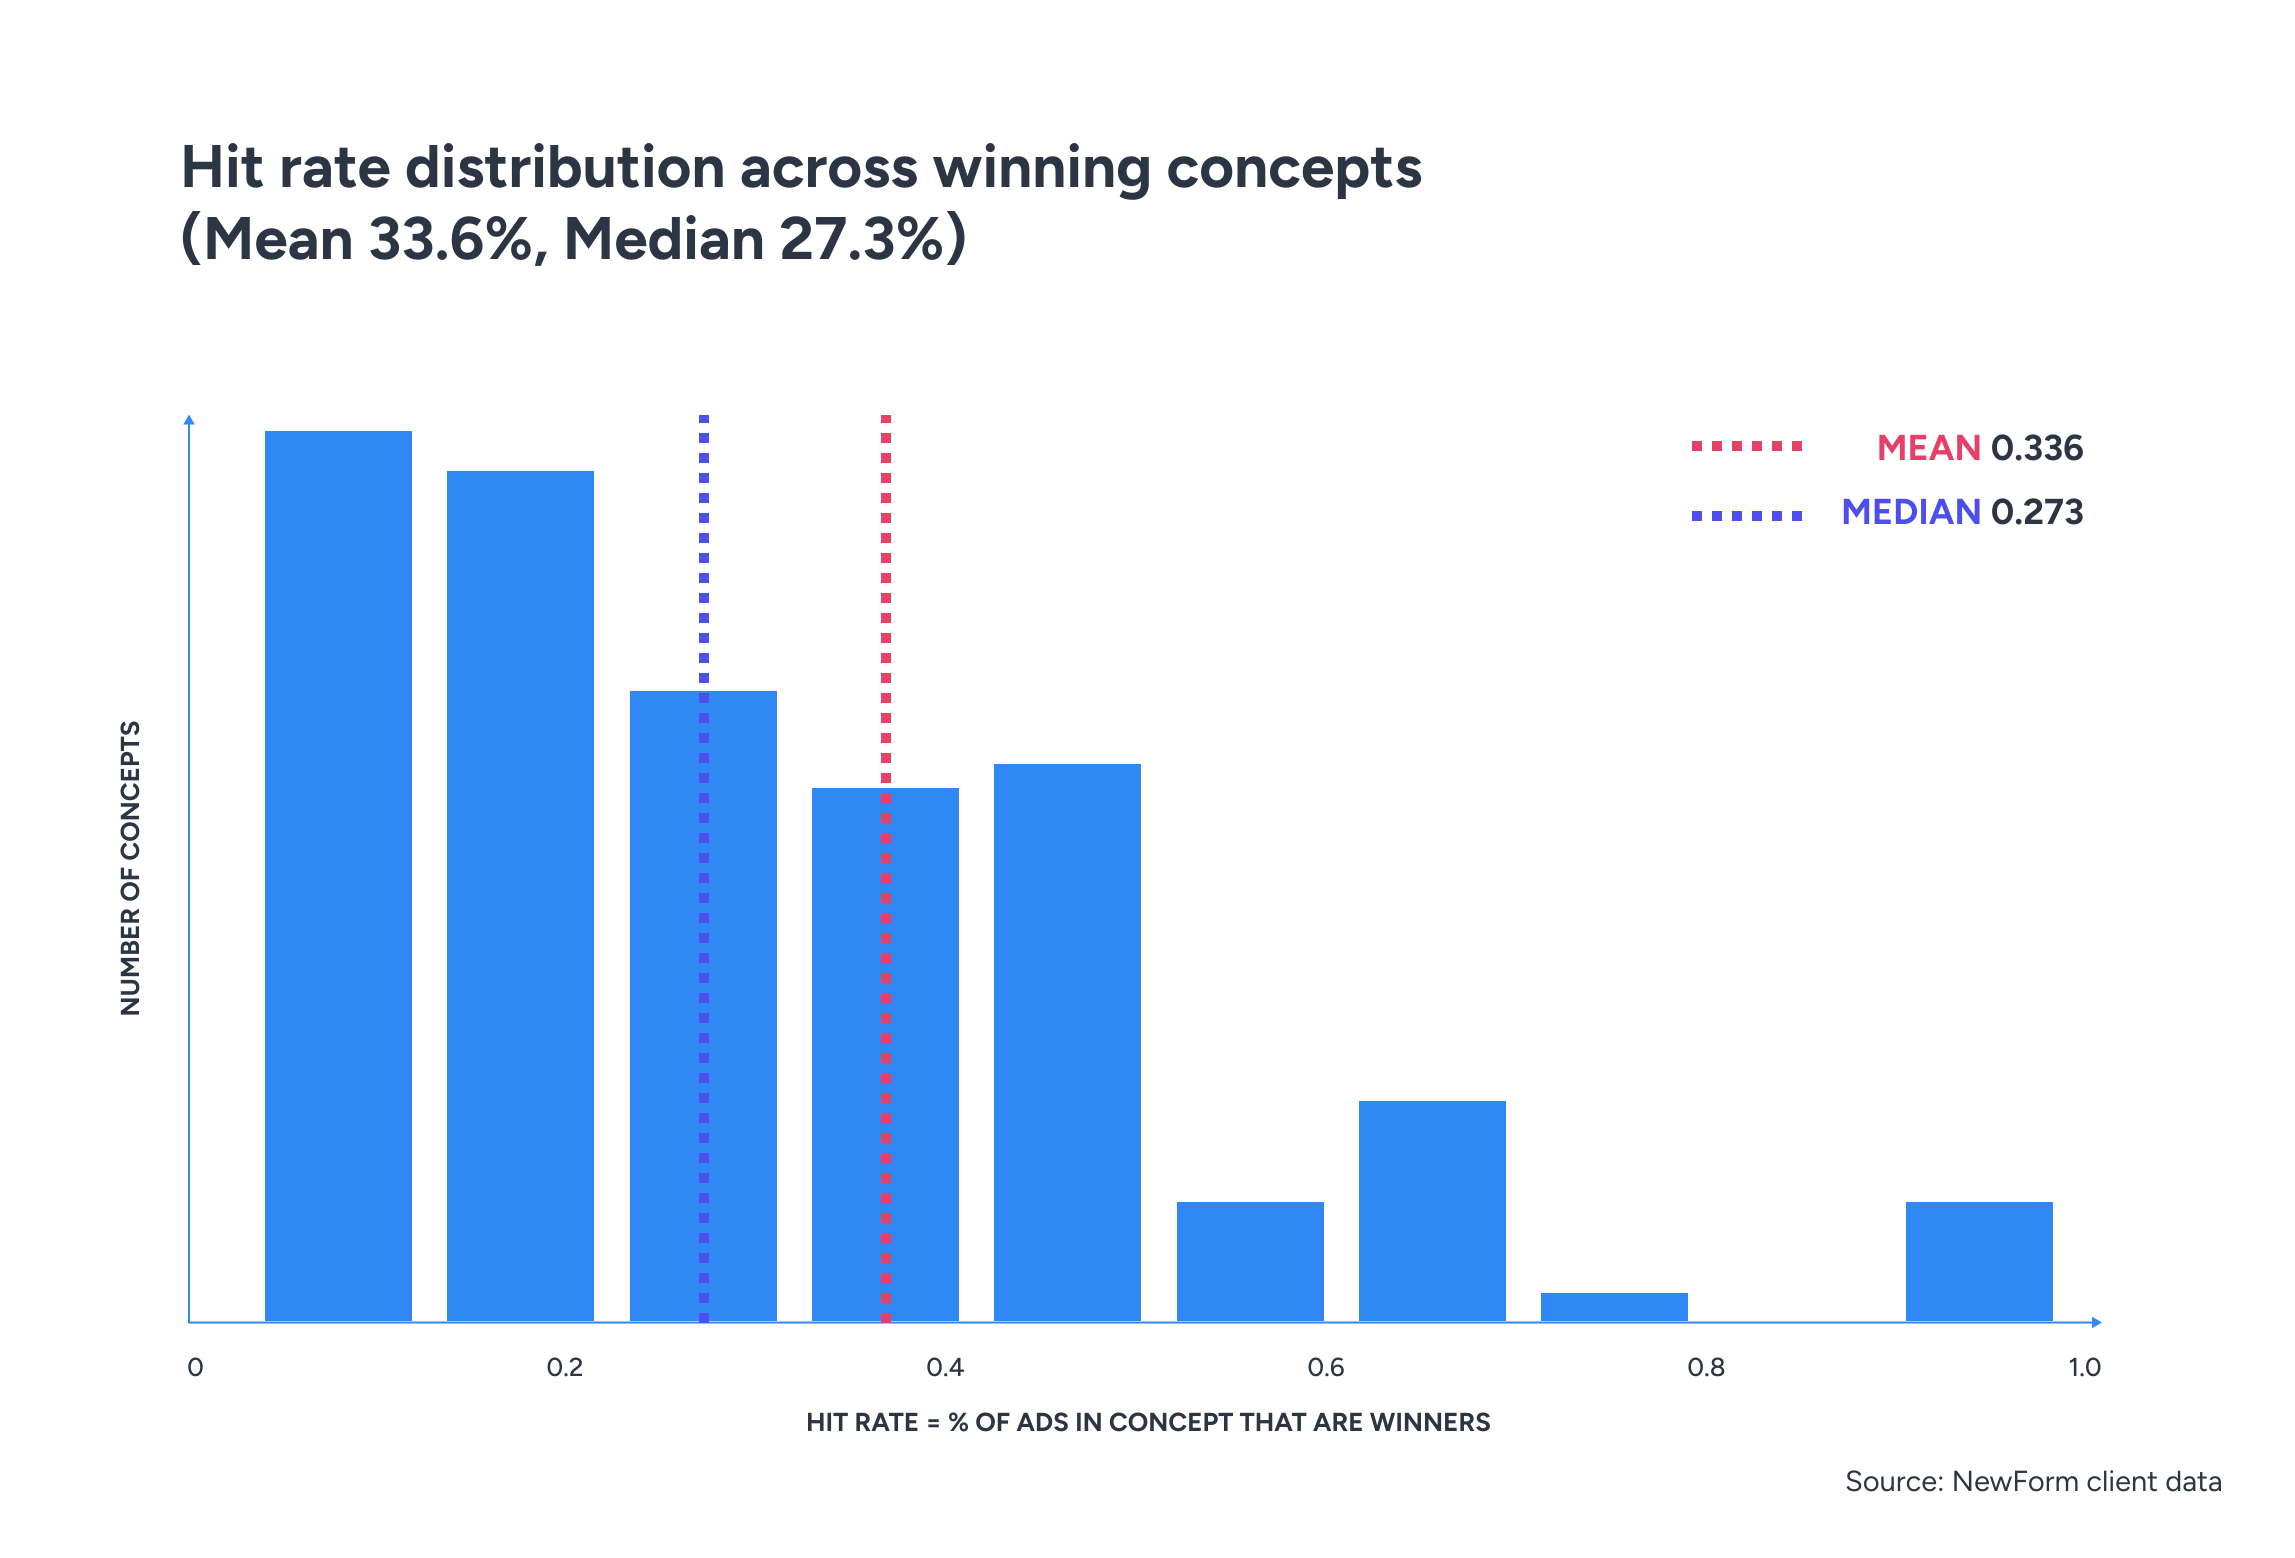
The average concept that does win only wins with about a quarter to a third of its variations. Run just one execution of a good concept and there is roughly a 75% chance you never see it win at all. Two variations still leaves about a 56% chance of missing it entirely.
| Variations tested | Chance of missing a winning concept |
|---|---|
| 1 | ~75% |
| 2 | ~56% |
| ~10 | ~10% (captures 90% of winners) |
Aim for around 10 variations per concept once you have a system for producing them; in the early days, fewer is fine while you’re still learning what’s out there. The point of a variation isn’t volume for its own sake, it’s making sure a good idea doesn’t die because of one bad hook.
Set your expectations on winners
In NewForm’s own client data, the single best ad in a typical account carries 11.5% of spend on its own, and concentration builds fast from there.
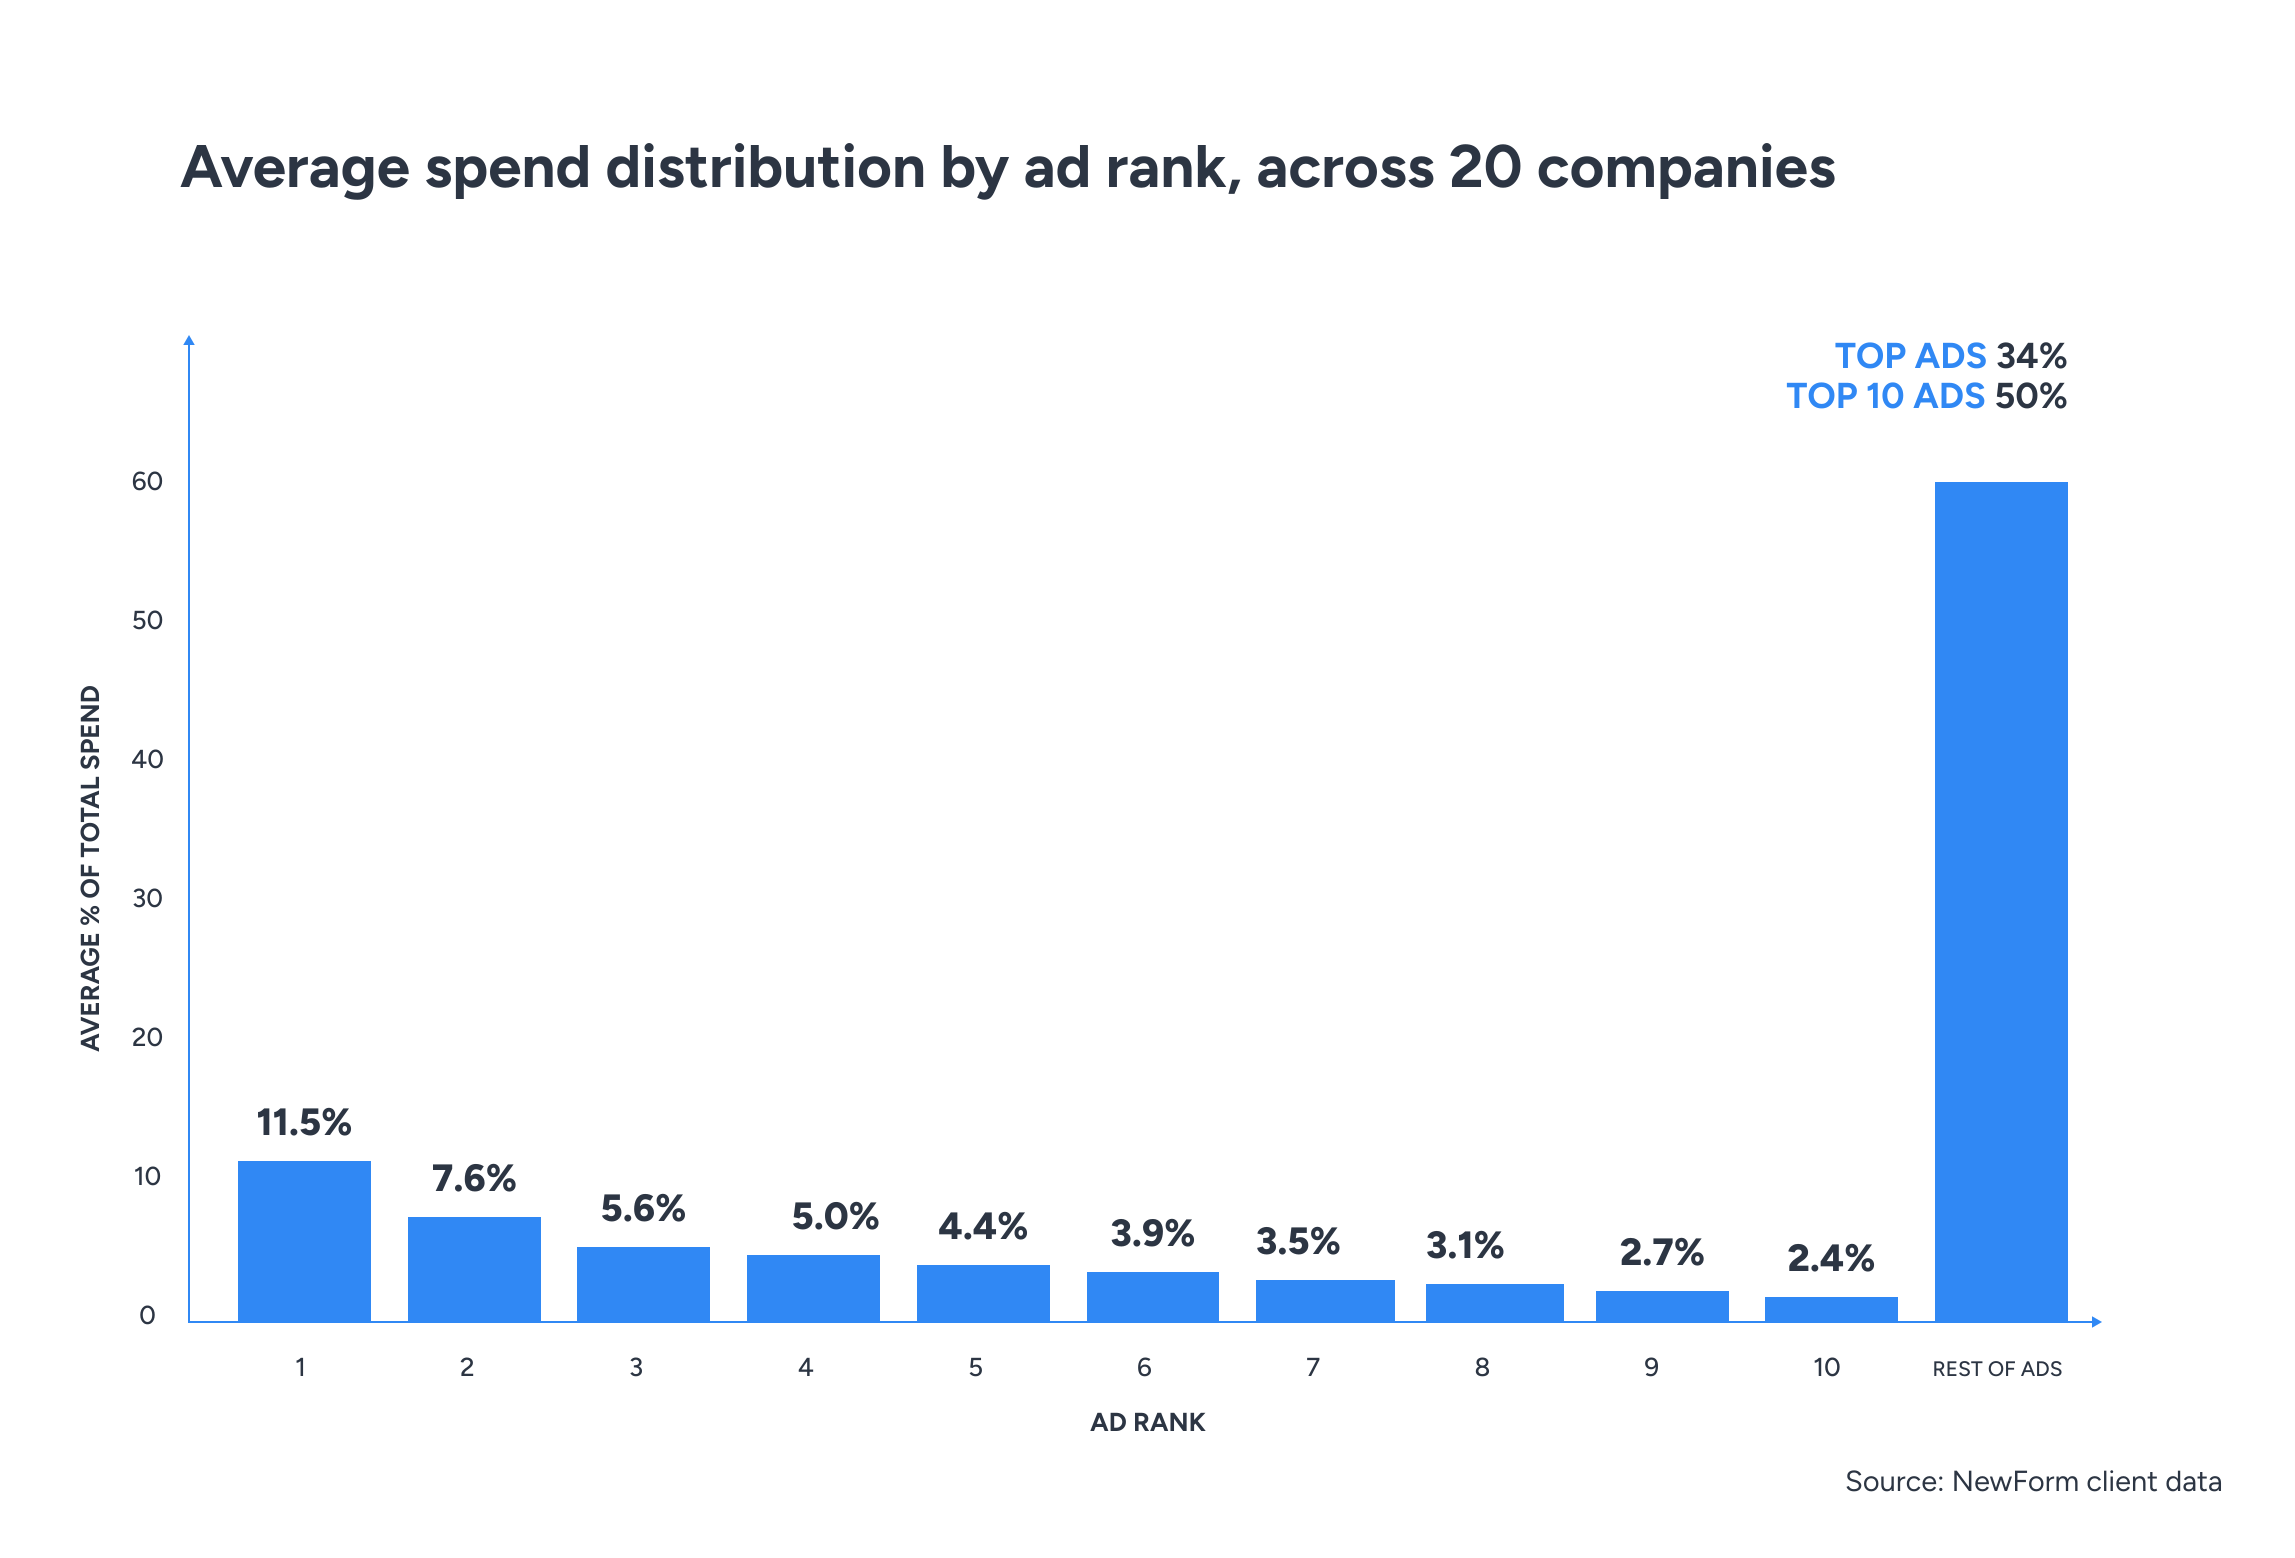
34%
of spend goes to the top 5 ads in an account
~50%
of spend goes to the top 10 ads in an account
Hit rate also drops as accounts scale, a separate cut of the data from the concept-level hit rate above, this one measured across all ads at each spend tier.
9.8%
hit rate – accounts under $300k/mo
7.8%
hit rate – accounts $300k–$1M/mo
3.7%
hit rate – accounts over $1M/mo
Source: NewForm client data, 10k+ ads analyzed.
Combined with the fact that only about a third of winners go on to scale well, NewForm puts the realistic odds at a high-spend account at around 1 in 100 creatives becoming a true scale winner. Treat it as a planning number, not a formula.
1 in 100
realistic odds at high spend
TRAP QUESTION FOR YOUR TEAM
When a concept dies, was it the idea that failed, or just the one version you tried?
2. More creative doesn’t necessarily mean better performance
Volume is how high-spend advertisers sustain delivery at scale. On its own, it is not what improves performance.
Scale and creative volume move together sharply
The first pattern in the data looks familiar: as advertiser spend increases, active creative counts scale with it. The relationship is steep.
| Advertiser tier | Daily spend | Active creatives in market |
|---|---|---|
| Small advertisers | Less than $1,000/day | Up to 30 |
| Scaling advertisers | $1,000 to $10,000/day | ~370 (13x more than small tier) |
| Large advertisers | $10,000 to $100,000/day | ~1,100 |
| Top spenders | More than $100,000/day | 5,000 to 10,000 |
Scaling advertisers run 13x more active creatives than small advertisers. Large advertisers run roughly 37x more. Top spenders maintain portfolios of 5,000 to 10,000 active creatives at any given time.
That relationship is consistent and sharp enough that it is easy to read causality into it: bigger advertisers run more creatives and perform better, so creative count must be what drives performance.
The data tests that assumption directly.
The core finding: creative volume alone doesn’t move performance
Creative volume on its own doesn’t govern CTR, CVR, or ROI at the advertiser level. Two advertisers with similar portfolio sizes can sit at very different performance levels, and what separates them is how that volume is funded and how quickly winners get identified, not the count itself.
Scaled in step with the spend behind it, volume does contribute. More creative gives the algorithm more candidates to test, more inventory to replace fatiguing assets, and more format variation across audience segments. At high spend levels, these are not optional; they are what keep delivery efficient.
The reason top spenders run massive creative portfolios is not that volume drives results. It is that volume is the infrastructure required to sustain delivery at their budget level without fatigue eroding the efficiency of the entire account. Volume is the floor under performance, not the ceiling above it.
McKinsey’s research on the most creative companies finds the same pattern at the organizational level, as their analysis shows in “Creativity’s bottom line: How winning companies turn creativity into business value and growth” (McKinsey Digital), top-performing companies do not simply produce more. They build the systems to recognize what resonates and act on that signal faster than competitors who are still iterating without a feedback loop.
The strategic reframe
Creative volume is necessary infrastructure at scale, and it earns its keep when spend scales with it. What it cannot do is answer the question underneath it: which creatives in the portfolio are already winning, and are they getting the spend they have earned?
Pro-tip
Singular’s Creative IQ side-by-side performance comparison isolates the actual delta between creatives running simultaneously. That delta, not portfolio averages, is where the signal lives. See Creative IQ.
Volume sets the floor. Inside it, where does the value actually concentrate? The data is specific, and the answer reframes how every creative portfolio should be managed.
PARTNER CONTRIBUTION

Capturing the live moment: what the FIFA World Cup 2026 can teach every creative team about relevance.
More playables in the market doesn’t mean more high-performing playables. Relevance scales.
The live moment
There is a moment in every major sporting event that media buyers dread and creative teams have learned to use: the injury substitution. A key player goes down, the odds shift in seconds, and millions of people are already in their sports betting app with a thumb hovering.
A rich-media interactive ad with dynamic capabilities can update its embedded odds in real time to reflect what just changed on the pitch. Or on the court. Or on the field.
This is not a hypothetical. The data already exists to prove it.
The proof
Across a 3-month window in CRAFTSMAN+ platform analytics, a single event-specific sports betting interactive ad tied to March Madness ran head-to-head against its evergreen equivalent, in the same account, over the same period, with identical creative quality.
442x
reach – 659k sessions vs 1.5k for the evergreen ad
3.4x
capture rate – 5.7% vs 1.7%
1,453
users captured – 38k vs 26
One variable separated them. The event-specific ad was built for a live moment.
Across the top 4 sports betting interactive ads from the last 90 days, the top performer, the one with real-time data integration, saw a 20% increase in CTR.
20%
CTR lift from real-time data integration
The opportunity
The FIFA World Cup 2026 is not a standard tentpole window. It runs 39 days across three host countries and every major time zone, and it generates emotional volatility on a predictable schedule: substitutions, red cards, penalty shootouts, shock results.
Each one of these is a potential activation window. The question is not whether your creative is in-market during the World Cup. It is whether it is built to respond to what happens inside it.
The playbook
1. Build the formation before the whistle blows:
Variant testing is planned into production before launch, not bolted on after. Know your lineup before kickoff.
2. Score against yourself first:
The only benchmark that matters pre-campaign is your own best performer. If your event-specific unit isn’t generating multiples of your evergreen baseline, it isn’t ready.
3. Win the first two seconds:
The value proposition is fully communicated before the user decides whether to engage. No setup. No wind-up. Just the offer, the moment, the CTA.
4. Keep your creative team on side:
AI accelerates production. It does not replace strategy. The teams with the best creative output are running a genuine hybrid of designers and strategists, driving ideation, and AI handling execution.
5. Kickoff at the right moment:
A red card. A penalty miss. An upset result. These are your real media windows. Map your deployment to what happens on the pitch, not just what’s on the media plan.

The future of the sports betting app industry is the integration of dynamic, real-time odds inside interactive ads. When a live game changes, a key player comes off, a goal goes in, the interactive ad should change with it. Your interactive ad becomes a live artifact of the moment the viewer is already inside.
Alex Merutka
CEO, CRAFTSMAN+
3. 10% of your creatives are doing 90% of the work
The value in your portfolio is already there. The question is how fast you find it before it fades.
Spend follows winners, and the concentration is extreme
Platform algorithms identify high-performing creatives within hours of launch and shift budget toward them immediately. The result is consistent across every portfolio in this dataset: the top 10% of creatives capture between 75% and 95% of total spend.
| Portfolio size | Spend captured by top 10% of creatives |
|---|---|
| Up to 100 active creatives | ~75% |
| 1,000 or more active creatives | More than 90% |
Two things are worth noting. First, the concentration is extreme even at smaller portfolio sizes: 75% of spend flowing to 10% of assets means the remaining 90% of creatives are sharing one quarter of the budget.
Second, the concentration gets more severe, not less, as portfolio size grows. Advertisers running 1,000 or more creatives see more than 90% of spend flowing to the top decile.
Running more creatives does not spread spend more evenly. It concentrates it further. Every additional creative added to the portfolio increases the competition for algorithm attention, and the winners keep winning with an increasingly dominant share. Large portfolios are filtering operations: producing many creatives to surface the few that platforms will scale.
The performance gap between top and median creatives, quantified
| Channel | CTR gap: top 10% vs median | CVR gap: top 10% vs median |
|---|---|---|
| Social | 2.5x to 3x higher | ~2x higher |
| Search | 2.5x to 3x higher | ~2x higher |
| Display | Up to 9x higher | ~4x higher |
On Social and Search, a typical advertiser’s top 10% of creatives outperform the median by 2.5 to 3x on CTR and approximately 2x on CVR. That is not a marginal efficiency gain.
Tripling CTR on a Social campaign is the kind of result that moves quarterly acquisition numbers. And for most advertisers, that result is already sitting in their portfolio in assets that either are not receiving proportional spend, or that are being allowed to fatigue past their peak window without being identified and extended.
On Display, the gap reaches up to 9x on CTR and approximately 4x on CVR. Display inventory sits at $0.8 average CPM, well below Social and Search.
A top-decile Display creative delivering 9x the engagement of the median at identical cost is one of the clearest efficiency opportunities in the dataset. In a channel often treated as low priority, creative execution is almost entirely the variable that determines outcomes.
The opportunity hiding in plain sight
The value in your creative portfolio is already there. Most advertisers could double their blended CTR by moving spend from underperforming creatives toward winners already running.
The constraint is how quickly the team identifies which 10% it is. Shortening that identification window from weeks to days is the single highest-leverage move in creative available at any spend level.
Pro-tip
Singular’s Creative IQ automatically surfaces performance outliers and flags fatigue signals across your full portfolio. For teams still relying on weekly reporting cycles to identify winners, the lag between a creative reaching peak performance and the scaling decision is a measurable cost.
Instabridge, along with brands like DoorDash, Instacart, Robinhood, Bolt, and many more, used Singular’s Creative IQ to identify viral creatives across global markets and scaled them faster than their previous manual analysis process allowed. The result was a material reduction in the lag between a creative reaching peak performance and the decision to scale it. Read the full case study.
Creative IQ is a time-saving, creative-unlocking tool. I can find top performers, scale what works, and my team delivers faster and better creatives than ever.
Wanbing Zhu Andresson
Head of Performance Marketing, Instabridge
Knowing the value is concentrated is the first step. Knowing whether your creatives are actually winning requires a benchmark. What does strong performance look like in your specific vertical and channel?
PARTNER CONTRIBUTION

Knowing a creative won is not the same as knowing why. Why is what you can repeat.
Standard performance data tells you what’s resonating. It doesn’t tell you why, or how to replicate it before the window of opportunity closes.
Why some creatives win (and some don’t)
Maybe the ad sold the game’s mechanics to the right user. Maybe it aligned to a Live Event window. Maybe it tapped a motivational driver competitors haven’t saturated yet.
| Layer | What it captures | Why it matters |
|---|---|---|
| Core motivations | What the game fundamentally delivers: mastery, strategy, social play, exploration | Defines the audience the game is actually built for |
| Event motivations | Spikes from Live Events, limited-time modes, seasonal content | Creates time-limited acquisition windows beyond the core audience |
| Creative motivations | What the ads actually communicate | Does not always match what the game delivers – this gap is where churn starts |
Each points to a different next move, and without knowing which, the follow-up to a winner is usually more of the same. Three motivational layers sit underneath every creative decision in gaming.
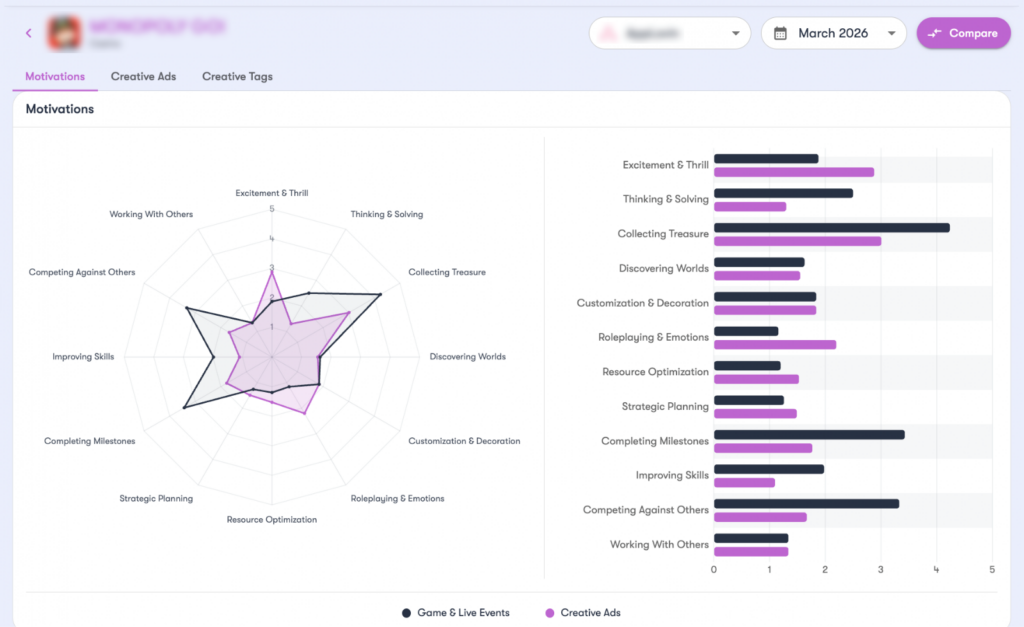
When ad messaging does not reflect the full motivational range of a game, whole audience segments go untouched. Testing different alignments opens the door to players from adjacent genres who would convert if the creative spoke to them. Source: Liftoff Intelligence
The two gaps draining performance
Map motivational alignment across a portfolio and two patterns show up consistently, both invisible in standard performance reporting.
Blind spots – motivational drivers performing strongly in the genre that are missing from your mix:
- Competitors running these angles capture the players your mix isn’t reaching.
- Every test cycle that skips them is spend committed to a lane you already know.
- Audience segments receptive to these drivers go unaddressed in your creative rotation.
Misalignments – ads that promise an experience the game doesn’t deliver:
- CTR looks strong but downstream metrics tell a different story.
- Players install and leave because the game didn’t deliver what the ad promised.
- Retention and LTV take the hit while creative reporting shows nothing wrong.
Both compound over time, especially when teams run variations of one winning concept for months, narrowing motivational coverage with every iteration.
Source: Liftoff Intelligence
Close the gap-to-brief lag
Closing a creative gap used to mean a full brief, a production cycle, and a review cycle, and by launch the opportunity had often passed. The market doesn’t wait that long anymore.
53+ / week
where creative output for the top 25% of advertisers starts
Days, not weeks
from motivational signal to a competitor acting on it
| Old workflow | Faster workflow |
|---|---|
| Performance data flags underperformance | Motivational gap identified before spend is committed |
| Creative team briefed from scratch | Production-ready brief auto-generated from gap data |
| Full production and review cycle | GenAI concept ready to test immediately |
| Concept in market weeks later | Gap to testable concept in the same workflow |
Pro-tip: AUDIT BEFORE YOU BRIEF
Check motivational coverage before the next production sprint. The highest-value tests are often drivers already working in your genre that your mix doesn’t cover yet.
Most teams are one algorithm change away from their best creative becoming their worst. What worked last quarter may have nothing to do with what works next quarter if you do not understand the motivational signal underneath it. At Liftoff Intelligence, that is exactly what our creative intelligence tool was built to do, not just surface winners, but explain why they win so teams can build the next one with confidence.
Brendan Fraher
VP of Intelligence, Liftoff
4. Your vertical, your benchmarks, your edge
Optimization without benchmarks is just iteration. These are the numbers your creatives need to beat.
Why global averages are the wrong benchmark
A 1.5% CTR on Social looks different depending on the vertical. In Finance, where the Social CTR benchmark sits at 0.9%, that number represents a strong performer. In Entertainment, where Search CTR reaches 3.5%, the same number signals underperformance.
Without vertical-specific reference points, creative teams optimize against the wrong bar, declaring winners that would be median in a better-informed comparison, and cutting creatives that are actually performing well for their context.
The benchmarks in this section are designed for pre-launch calibration, not just retrospective reporting. Before a creative test goes live, set the vertical-specific pass/fail threshold. Use the benchmark as the target, not the result.
Channel benchmarks: the structural differences
| Channel | Avg CTR | Avg CVR | Avg CPM |
|---|---|---|---|
| Social | 1.3% | 8.8% | $3.2 |
| Search | 2.7% | 9.2% | $3.9 |
| Display | 4.0% | 2.7% | $0.8 |
- Search delivers roughly 2x the CTR of Social because the user is in-market. High-intent queries produce higher engagement regardless of creative quality. On Search, the creative’s job is to capture intent that already exists, not to create it. Creative that matches the specific query context converts; creative that misses it does not, regardless of how strong it tests on Social.
- Display reaches 4.0% CTR but converts at only 2.7% CVR because Display audiences are not in-market. Display functions as a broad awareness and consideration channel. At $0.8 average CPM, it is the most cost-efficient channel for reach. Measuring Display creative on post-click CVR applies the wrong metric to an awareness-stage placement.
- Social is the primary conversion channel for most performance verticals, with 8.8% CVR and significant CPM investment. Creative quality on Social has the most direct and immediate impact on blended acquisition efficiency. It is where the 2.5x to 3x performance gap between top and median creatives translates most directly into dollar-level differences in cost per install.
Vertical benchmarks: the complete reference
The table below covers CTR, CVR, and CPM for Social, Search and Display across all tracked verticals. These are the numbers your creatives are competing against in each vertical and channel combination.
| Vertical | Channel | CTR | CVR | CPM |
|---|---|---|---|---|
| Gaming | Social | 1.2% | 18.0% | $4.2 |
| Gaming | Search | 2.9% | 17.0% | $3.5 |
| Gaming | Display | 2.7% | 4.2% | $0.6 |
| Finance | Social | 0.9% | 3.9% | $1.6 |
| Finance | Search | 1.8% | 9.4% | $3.2 |
| Finance | Display | 1.7% | 0.4% | $0.6 |
| Entertainment | Social | 1.0% | 4.1% | $3.4 |
| Entertainment | Search | 3.5% | 11.9% | $5.5 |
| Entertainment | Display | 5.2% | 4.3% | $1.7 |
| Shopping | Social | 1.4% | 2.1% | $1.5 |
| Shopping | Search | 2.4% | 1.6% | $2.4 |
| Shopping | Display | 1.6% | 0.3% | $0.9 |
| Health & Fitness | Social | 1.3% | 7.3% | $8.1 |
| Health & Fitness | Search | 2.5% | 5.6% | $7.0 |
| Education | Social | 0.9% | 7.9% | $3.6 |
| Education | Search | 1.6% | 14.1% | $5.4 |
| Travel | Social | 1.0% | 9.4% | $2.8 |
| Travel | Search | 2.0% | 5.8% | $3.5 |
**Display benchmark data is not available for Health and Fitness, Education, and Travel verticals.
Six insights that change how you optimize
Gaming CVRs are in a different category from every other vertical: 18.0% on Social and 17.0% on Search. The frictionless install-to-activation funnel gaming apps offer compresses the conversion path to the point where even moderate-CTR creatives convert at high rates.
This makes Gaming the most forgiving vertical for creative testing. Teams in Gaming should prioritize volume and speed of iteration over refinement of individual assets. Getting a creative into market fast matters more here than getting it perfect before launch.
Health and Fitness carries a CPM cost that turns the performance gap into a financial calculation. At $8.1 on Social and $7.0 on Search, inventory in this vertical is the most expensive in the dataset.
At those CPMs, the difference between a top-decile and a median creative is not a percentage-point efficiency variation, it is a materially different cost per install. In Health and Fitness, slow winner identification is not just suboptimal, it has a measurable weekly dollar cost that compounds across every day a fatigued creative continues running at scale.
Finance reveals the most important channel allocation insight in the dataset: Search CVR of 9.4% versus Social CVR of 3.9%, a 2.4x gap. That gap is the largest Social-to-Search CVR difference across all verticals, and it is not a coincidence.
Finance users who encounter a Social ad are in early-stage consideration. They are building awareness, comparing products, and mapping options. They are not yet ready to install. The same user, when they return to Search with a specific query, converts at 9.4%.
The implication is a specific creative strategy: Social creatives in Finance should be designed to plant intent and build brand familiarity rather than drive direct conversions. Search creatives should be designed to capture the intent that Social created. These are two distinct creative jobs in a sequential funnel, and conflating them with a single CVR target produces the wrong optimization decisions for both channels.
Education’s Search CVR of 14.1% is the second-highest of any vertical-channel combination in the dataset. At a Search CPM of $5.4, this represents one of the more accessible high-intent acquisition environments available.
Education users who search for apps in that category are actively evaluating options with high specificity. Creative that matches that intent closely converts at rates that make Search a materially underinvested channel for most Education teams relative to its actual performance.
Entertainment achieves a Display CTR of 5.2%, which is 30% above the 4.0% Display average. Entertainment sits at the intersection of visual content and discovery behavior: users encounter Entertainment ads in a browsing mindset that is inherently receptive to compelling video or visual creative.
That makes Display an unusually high-CTR channel for this vertical. Teams that have deprioritized Entertainment Display based on low average Display CVRs are making a category error. The channel is working. The question is whether the post-click journey is designed for the longer consideration path.
Shopping has the lowest Search CVR in the dataset at 1.6%, while running a 2.4% Search CTR. The gap between clicks earned and conversions recorded is the widest of any vertical, and it is not a creative failure.
Shopping users use ads as discovery and comparison triggers. They tap, browse, compare alternatives, and return to install on a delayed timeline that standard 1-day or even 7-day attribution windows miss entirely. This means Shopping creative performance is systematically undercounted in most reporting.
A Shopping Social creative with 2.1% CVR is not underperforming. It is building a retargeting audience and seeding purchase intent that converts later and elsewhere. The right creative success metric for Shopping is the quality and size of the retargeting pool generated, and the 14-day attributed conversion rate, not the immediate post-click install rate.
Using benchmarks in practice
The right benchmark is always vertical and channel-specific. Set it before the campaign launches. A Gaming Social creative below 15% CVR is underperforming. A Finance Social creative above 5% CVR is strong.
Vertical benchmarks are only useful if they anchor the test design, not if they are applied as post-hoc justification for decisions already made.
Pro-tip
Singular’s Report Hub lets you slice performance data by vertical, channel, and creative dimension simultaneously, so you can compare your actual CTR and CVR against the benchmarks in this report in real time. See Singular’s benchmarks.
Benchmarks show where the bar is set. The final question is how to clear it systematically and faster than competitors reading the same data. That is what data-driven creative performance looks like as an operational practice.
5. Producing more isn’t the whole answer. Optimizing faster is.
Five moves that separate creative optimizers from creative producers, each grounded in the data.
The findings across the previous four sections point in one direction: competitive advantage in creative is optimization speed, not production capacity. Here is what that looks like as five operational decisions.
1. Calibrate creative velocity to your spend tier
Creative volume requirements scale with spend. Measuring a small team against the 53+ per week where the top quartile starts is the wrong comparison.
| Spend tier | Active creatives | Priority |
|---|---|---|
| Small (under $1,000/day) | 15–30 | Find your first 2–3 consistent performers before scaling production |
| Scaling ($1,000–$10,000/day) | 200–500 | Weekly refresh as a recurring workflow, not a periodic project |
| Large ($10,000–$100,000/day) | Dedicated infrastructure | Systematize production, tagging, and reallocation; don’t rely on individual analysts |
| Top spenders (over $100,000/day) | 5,000–10,000 | Automate every stage: tagging, fatigue detection, winner ID, reallocation |
2. Reallocate before you create
Before planning the next production sprint, audit the current portfolio: are the top 10% of CTR/CVR performers getting spend proportional to that performance? In most portfolios they are not, and the fix is reallocation, not creation. Most advertisers could double their blended CTR without producing a single new creative, the constraint is analysis speed, not production.
3. Build for faster winner identification, not higher output
Your top 10% is already doing most of the work; the question is how fast you find which 10% it is. Weekly reporting cycles are too slow: a creative that peaks on day 3 and fatigues by day 10 may not be flagged as a winner until day 7 or 8, losing roughly half its efficient window. Shortening that lag from weeks to days is one of the highest-leverage moves available at any spend level.
4. Set vertical benchmarks as pre-launch targets
Use the Section 4 benchmarks as pre-test calibration, not post-campaign comparison: define what CTR and CVR counts as a winner before the test launches. That prevents the most common failure, declaring a creative a winner because it beats others in a portfolio that’s benchmarking below the vertical average.
5. Measure creative performance under more than one attribution model
Last-touch attribution is still the default for creative reporting, practical, but blind to any contribution that doesn’t happen at the moment of conversion. Singular’s analysis of Meta campaigns from the 2026 ROI Index found up to 50% higher ROAS under multi-touch attribution versus last-touch alone, the gap made up of creatives that build awareness, reinforce intent, or assist conversions closing through a different channel.
Some creatives being cut on last-touch performance are contributing more than the data shows. Singular’s multi-touch framework surfaces those assist contributions alongside standard metrics, giving creative decisions a more complete foundation.
The bottom line on creative performance
Production volume is not the competitive advantage. Optimization speed is. Teams that identify top performers faster, reallocate spend toward them before fatigue hits, set vertical-specific benchmarks before campaigns launch, and measure creative contribution across the full funnel will consistently outperform peers running the same volume with less precision.Partner Contribution
PARTNER CONTRIBUTION

The last creative surface in the funnel is the one most teams never optimize.
Treat the App Store product page as creative. Match what the user sees to the journey that brought them in.
The surface got bigger
Strong UA teams treat the product page as creative: screenshots that carry the story from the ad, a listing aligned with the upper-funnel work that drove the tap. What’s changed is how much of it you control, and how far it reaches.
- Custom product pages now surface in organic search results, tied to your App Store Connect keyword field.
- The cap rose from 35 to 70 pages per app, each mappable to a channel, creator, feature, use case, seasonal event, or competitor term.
- New at WWDC 2026: marketing images and videos can appear in product page headers and search results, submitted for App Review independently of an app build. The creative calendar no longer waits for a release.
All these updates let UA teams better match the intent that triggered the tap and reach more targeted audiences.

App Store and Apple Ads have always been keyword and text-centric channels. With marketing images and video now available at the header and in search, the balance of the listing, and of App Store presence generally, shifts toward visuals and away from the text fields that have carried relevance for years.
The payoff, and the open field
Against the default page, custom product pages lifted performance and unlocked spend headroom for one client’s US app.
17%
higher tap-through rate on Apple Ads
12%
higher conversion rate
3x
increase in ad spend / YoY growth
Most of the market hasn’t moved. Around 70% of apps running Apple Ads still use no custom product pages at all.
70%
of Apple Ads apps use no custom product pages
In 2025, developers created roughly 22,600 organic custom product pages across 25 categories, with the top 6 verticals (Games, Utilities, Health and Fitness, Finance, Education, Shopping) taking more than half the volume and the US close to half of all creation in major markets.
| Apple Ads custom product pages | 2025 start | 2025 end |
|---|---|---|
| Impressions | 6.56B | 15.8B |
| Taps | 94M | 271M |
| Downloads | 52M | 129M |
| CPA | $4.58 | $3.07 |
The App Store product page spans paid, organic, and anything you point at it from outside the store. Customize it to the entry point, match it to intent, and run automated A/B tests for further iterations.
Keep in mind
- With iOS 26’s Liquid Glass design, a flat or outdated icon can drag tap-through and conversion. Make sure yours is compatible.
- Close the loop with deep links so each custom product page leads to an in-app destination that matches its promise, holding the thread from tap to first session.
- Continuity at that level lifts activation, because the app opens on what the page advertised.
TRAP QUESTION FOR YOUR TEAM
Every dollar of upper-funnel work lands on one page. Is yours built for the ad that sent them, or the same page for everyone?
PARTNER CONTRIBUTION

Segments tell you who. Motivation layers tell you why, and why is what scales.
Understanding motivations lets you extract more learning from every testing cycle, rather than simply increasing creative output
Finding the motivation layers
Most advertisers organize their creative strategy around segments like beginners versus advanced users, new versus returning users, or broad demographic categories. These groupings are useful for media buying, but they rarely explain why one message resonates and another doesn’t. What sits beneath those segments is more useful: motivation layers, the specific emotional and functional needs a user is trying to satisfy at a given moment. Understanding those layers extracts more learning from every testing cycle, instead of just producing more creative.
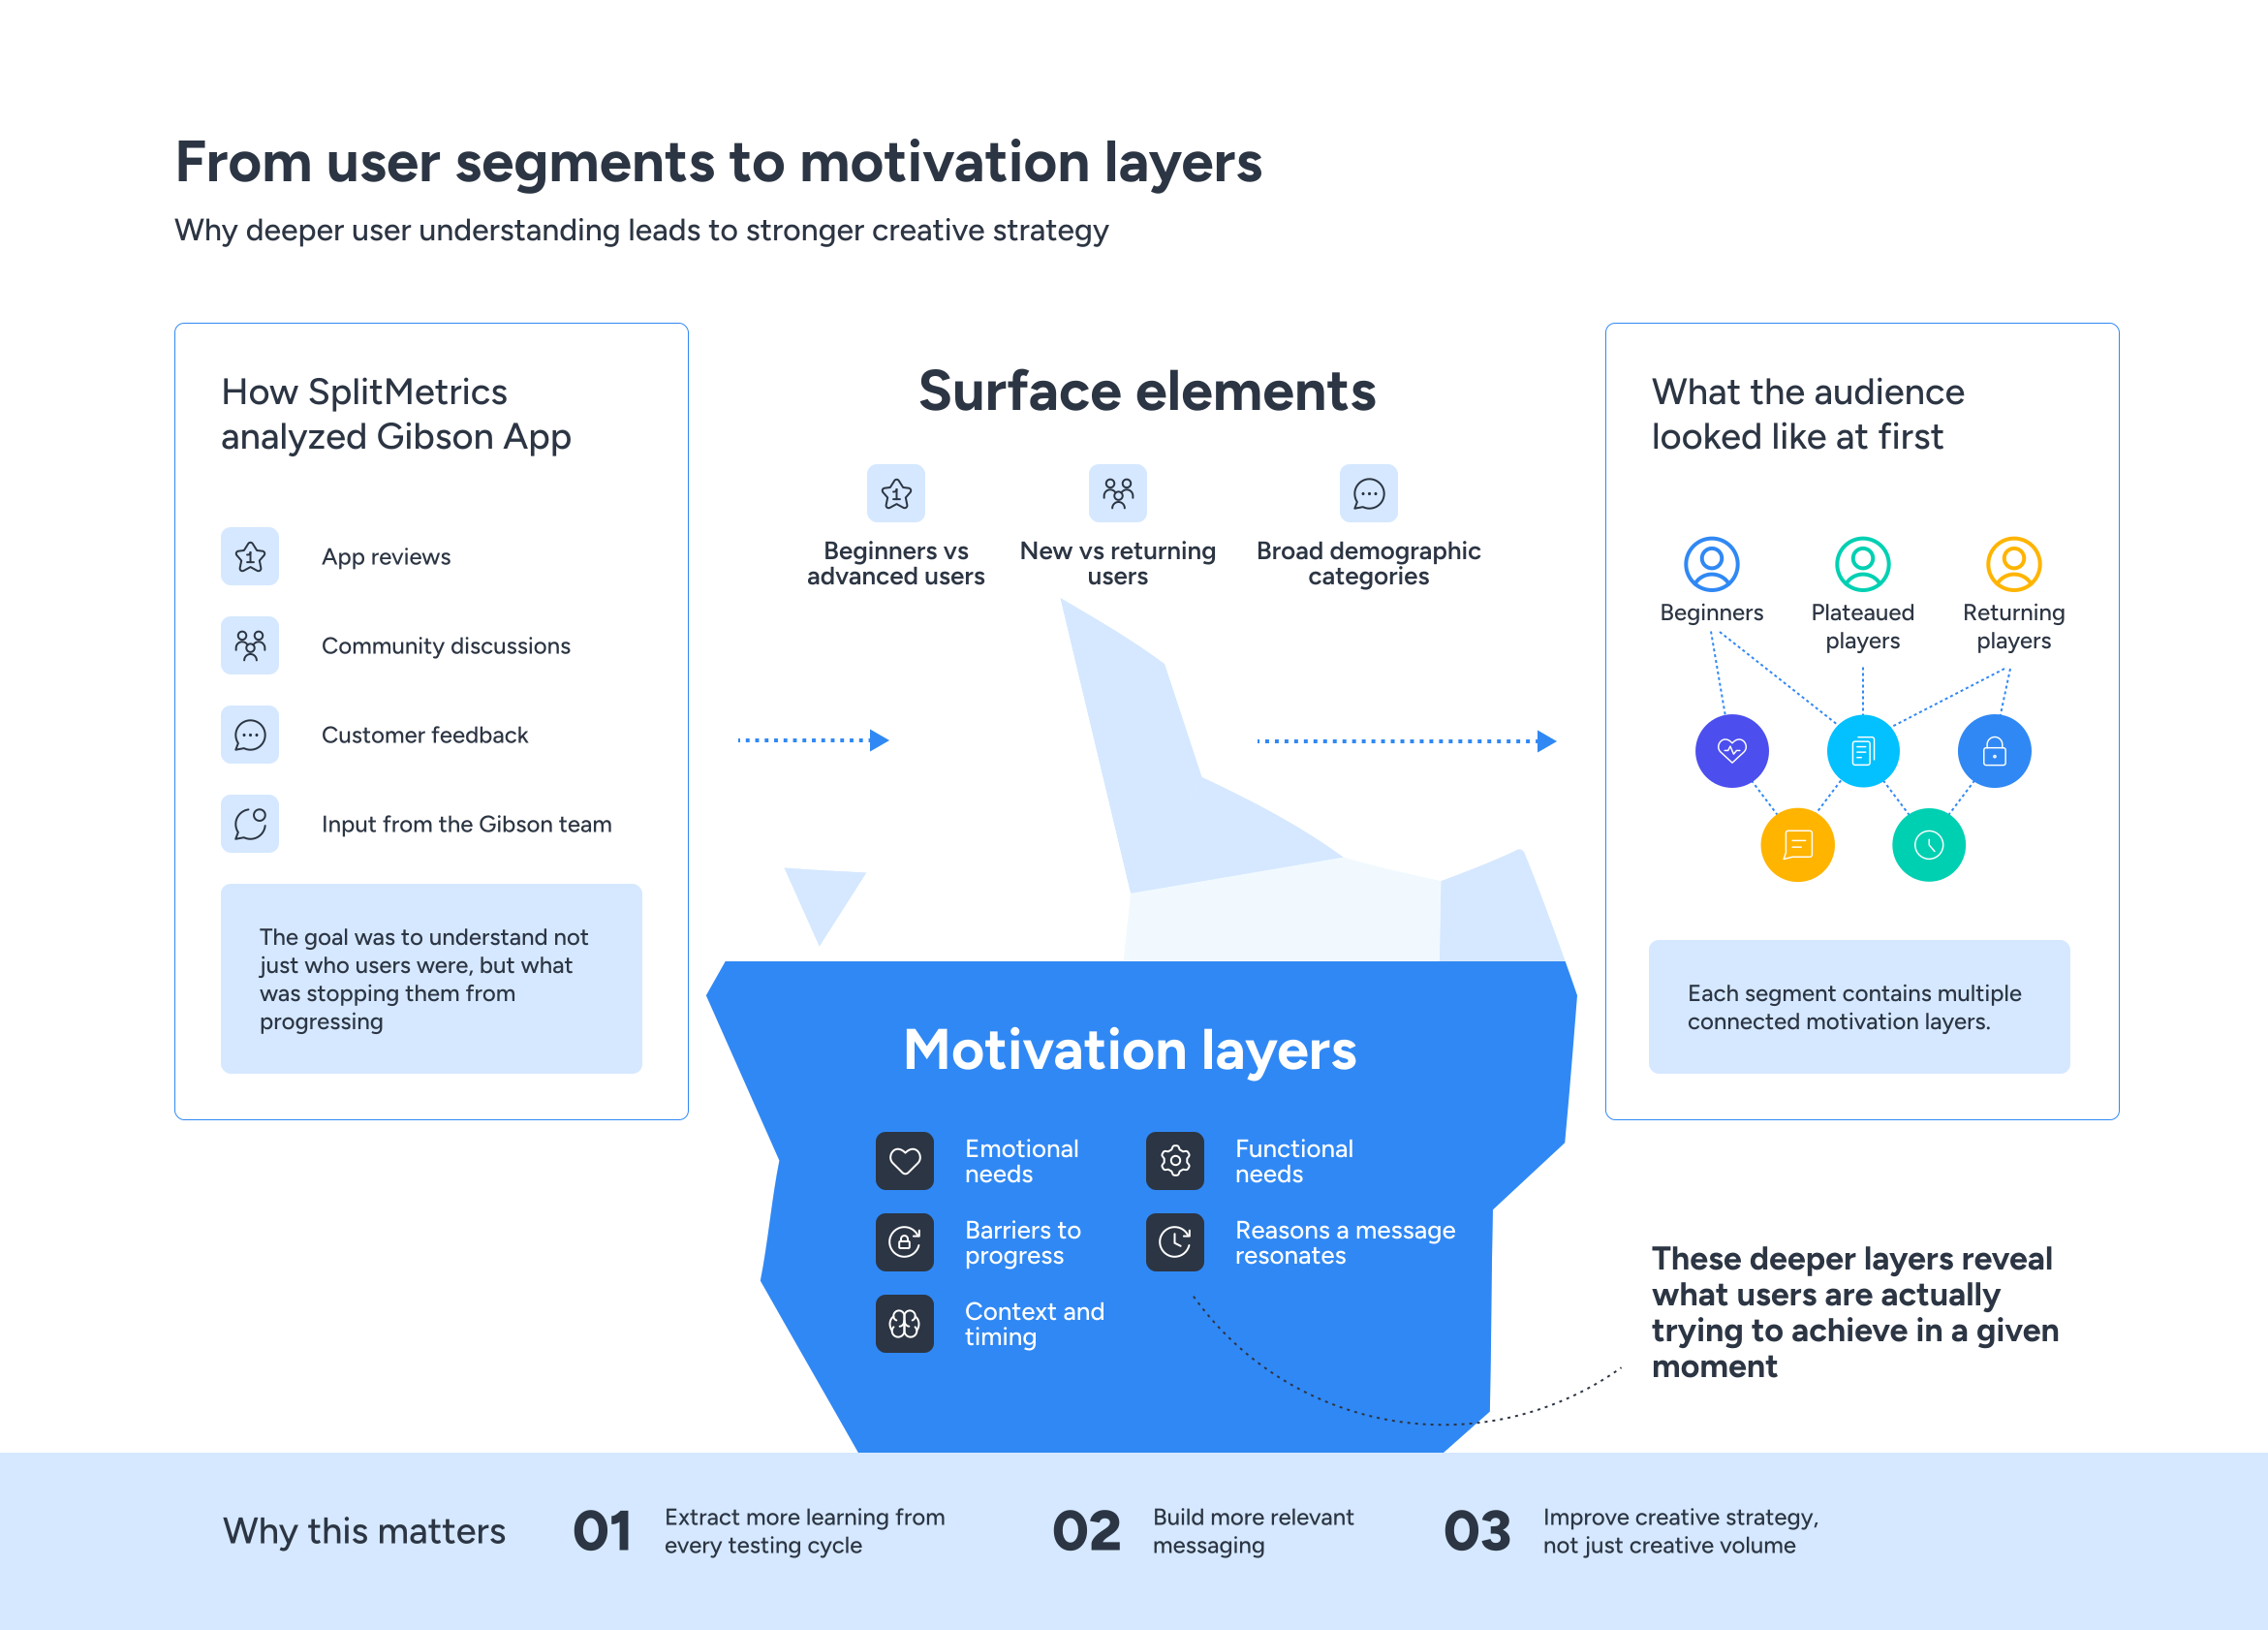
Working with Gibson App, a guitar-learning platform by Zoundio, SplitMetrics analyzed app reviews, community discussions, customer feedback, and input from the Gibson team to understand not just who users were, but what was actually stopping them from progressing. At first, the audience looked straightforward: beginners, plateaued players, returning players. Deeper analysis showed each of those three segments contained multiple motivation layers underneath, once the pain points were treated as connected rather than isolated:
Turn the layers into a testing system
Once the motivation layers were identified, creative development became significantly more structured.
| Motivation layer | Examples |
|---|---|
| Need for Direction | Don’t know what to practice, practice feels random, don’t know where to restart |
| Need for Progress | No clear progress, stuck at the same level, progress feels slower than expected |
| Need for Confidence | Feel untalented, lack confidence restarting, avoid challenging techniques |
| Need for Simplicity | Overwhelmed by information and learning resources |
| Need for Reassurance | Feel it’s too late, don’t want to start from zero, feel they’ve lost previous skills |
| Need for Mastery | Can’t move beyond basics, feel they’ve reached their limit |
Instead of producing disconnected concepts, the team built testing around the framework:
Audience Segment → Motivation Layer → Creative Angle → Hook → Format
Users seeking progress responded to different messaging than users seeking confidence, even within the same beginner audience.
That informed a large-scale program testing learning motivations, music genres including jazz, blues, metal, and country, storytelling approaches, visual and textual hooks, UGC concepts, educational content formats, and platform-native creative styles.
The result
More than 300 creative concepts were tested across Meta, TikTok, and Google Ads. Installs and subscriptions rose 25%, acquisition costs came down, and branded search demand nearly doubled.
25%
lift in installs and subscriptions
300+
concepts tested across Meta, TikTok, Google Ads
~2x
branded search demand – nearly doubled
Growth came from several factors, including Gibson’s own product improvements, but the structured program gave a repeatable system for uncovering motivations and scaling what worked.
The big takeaways
01
More creatives does not necessarily mean better results
02
Median: 13 new creatives/week. Top 25% starts at 53+
03
Top 10% of creatives = 75-95% of spend
04
Winners beat median by 2.5x-9x CTR gap
05
Your vertical is the only real benchmark
06
Last-touch hides up to 50% of true ROAS
Newform
Meta settles for “good enough” unless forced further
CRAFTSMAN+
442x reach from one live moment
Liftoff
Creative gaps are motivational, not visible in data
Mobileaction
The App Store page is a creative now, not a listing
Splitmetrics
Motivation layers beat segments for testing
Methodology
The Creative Benchmark Report 2026 is built on aggregated, anonymized performance data from Singular’s marketing intelligence platform, covering Q1 2025 to Q1 2026. Channel types: Social (major social and video platforms), Search (intent-driven placements), Display (programmatic placements across mobile and web). Verticals covered: Gaming, Finance, Entertainment, Shopping, Health and Fitness, Education, and Travel.
Advertiser tiers: Small (less than $1,000/day), Scaling ($1,000 to $10,000/day), Large ($10,000 to $100,000/day), Top (more than $100,000/day). All creative volume and performance data is aggregated at the advertiser level. Benchmarks represent medians and percentiles unless otherwise noted.
Multi-touch attribution data is sourced from Singular’s analysis of Meta campaigns. McKinsey reference is from: Creativity’s bottom line: How winning companies turn creativity into business value and growth, McKinsey Digital. Industry MTA adoption figure is sourced from published market research current to 2026. All insights reflect actively marketing apps and growth-stage businesses investing in paid user acquisition. Individual campaign results will vary.

SEE ALSO
ROI Index 2026 Report
We analyzed tens of billions in ad spend, billions of installs, and trillions of impressions to help you identify the right media sources for your growth goals across app categories, geographies, and marketing objectives. For the first time, this year’s edition highlights the top ad networks for ROI across both last-touch attribution and multi-touch attribution (MTA), giving you a more complete view of performance.
About Singular
Singular is the #1-rated MMP on G2 and the only platform that unifies your spend, attribution, ROI, and performance into one clear view. With AI-powered tools like Creative IQ and MCP integrations, marketers go from insight to impact in minutes, no engineering required.
Trusted by top brands like Nike, Airbnb, Rovio and LinkedIn, Singular helps you move fast, eliminate waste, and grow smarter.
Learn more at www.singular.net