
Content
- A handful of creatives carry most of your delivery
- Are more creatives always better, or is there a sweet spot?
- Why do some new creatives get little traction in their first week?
- Is creative fatigue one problem or two?
- What should you change in your creative strategy?
- How Singular’s Creative IQ helps you find and scale your top creatives
- Frequently asked questions
Stay up to date on the latest happenings in digital marketing
Summary
-
Focus on Creative Density Over Quantity: Prioritize the ratio of creatives to ad spend (creatives per $1,000) rather than just increasing the number of creatives. Identify the sweet spot where your installs per mille (IPM) peaks to optimize performance without spreading your budget too thin.
-
Differentiate Creative Variety: Ensure that new creatives introduce distinct concepts, hooks, or themes, rather than merely cosmetic changes. Use AI tagging tools to categorize creatives by attributes, helping to identify which variations truly drive performance and prevent redundancy.
-
Monitor Creative Performance: Analyze both reach and quality metrics separately to understand creative fatigue. A decline in impressions with stable quality indicates deprioritization by the network, while a drop in quality with stable reach suggests the creative is losing audience engagement—act accordingly to optimize ongoing campaigns.
Every performance marketer has heard some version of the advice: run more creatives, and your results will improve. It’s intuitive: more variety means more chances to find a winner, avoid fatigue, and keep audiences engaged. But Singular’s analysis of creative-level data across Google Ads, Facebook, TikTok, Liftoff, Moloco, and AppLovin, covering gaming, ecommerce, fintech, gambling, and food delivery advertisers, shows the advice is incomplete at best and misleading at worst. What moves performance is how many creatives you run for every dollar you spend, and how different those creatives are from each other.
The insights below come from Singular’s creative-level reporting, which brings creative data from across ad networks into one unified view. That cross-network view is the foundation of Creative IQ, Singular’s AI-powered creative analytics, which shows UA teams which creatives carry their delivery and why.
A handful of creatives carry most of your delivery
Picture a campaign “running 90 creatives.” It sounds like a large creative test, but in practice, 10 to 13 of those creatives usually do the real work. The rest are reporting noise, abandoned variants, or asset-combination artifacts that never got meaningful delivery. The same pattern shows up on every network we examined:
- Google Ads: In campaigns with 100+ assets, about 13 assets carry the campaign. The top asset alone gets roughly 20% of all impressions, and 87% of assets each get less than 1% of that week’s impressions.
- Facebook: Campaigns run fewer assets, around 6 in a typical campaign, and delivery is even more concentrated. In campaigns running more than 6, the top asset gets about a third of impressions, and the top five get roughly 80%.
- TikTok: Campaigns typically run more assets than on Facebook and fewer than on Google Ads, yet delivery concentrates almost exactly as it does on Facebook, with the top five creatives getting roughly 80%.
Keep making creative, but treat raw creative count as a vanity metric. What matters is how many creatives actually get delivery, because that is how many ideas your creative testing really covers. Our Creative Benchmark Report 2026 found the same pattern in spend: the top 10% of creatives captured 75% to 95% of total spend. It also includes CTR, CVR, and CPM benchmarks across 7 verticals and 3 channels. You can get it here and benchmark your creative performance for free.
Are more creatives always better, or is there a sweet spot?
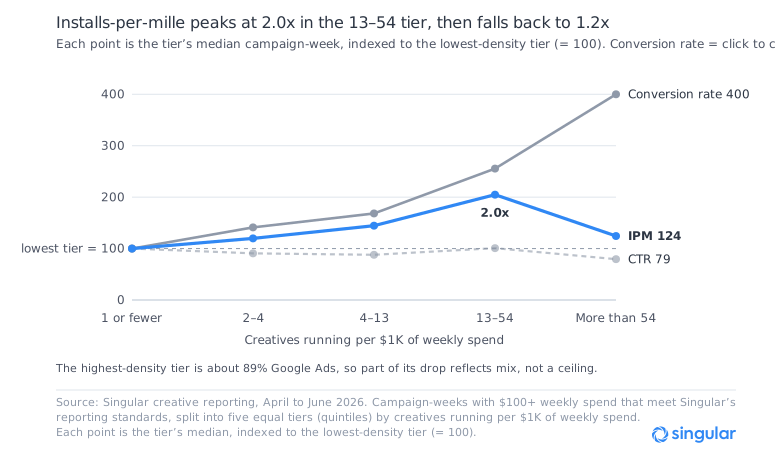
More creatives helps up to a point, and that point depends on your budget. Ten creatives on $500 a week works out to 20 creatives per $1,000 of spend, while the same ten creatives on $50,000 a week is 0.2 per $1,000.
We call this ratio, creatives running per $1,000 of weekly ad spend, creative density. Big-budget campaigns naturally run more creatives, so raw count can’t tell you whether gains come from creative strategy or just from being a bigger campaign.
We grouped campaign-weeks into five equal tiers by density: 1 or fewer, 2 to 4, 4 to 13, 13 to 54, and more than 54 creatives per $1,000. From the lowest tier to the 13 to 54 tier, installs per mille (IPM, installs per 1,000 impressions) roughly doubles and install rate climbs nearly 2.6x, while click-through rate (CTR) stays essentially flat. In the highest tier, above 54 creatives per $1,000, IPM falls back to 1.2x the lowest tier. At that point the same budget is spread across so many creatives that adding more stops paying off. Use these tiers as a benchmark, then check which tier your own campaigns fall into and where your IPM peaks.
How do you measure creative variety?
Adding creative only helps when the new creatives are different ideas. A new hook, theme, or format gives the network something new to test. A recolored version or a reworded headline of an existing ad usually doesn’t, because the delivery algorithm has little reason to treat it differently, so it joins the long tail that gets really low impressions. The concentration data is consistent with this, and it suggests that only new angles move the sweet spot.
Telling the difference is where most teams get stuck. Judging whether 50 creatives are 50 distinct ideas, or 5 ideas with 10 cosmetic variations each, means knowing what’s in each creative: the hook, the theme, the call to action, the format, and the audio. Creative IQ’s AI tagging labels those attributes automatically, so you can group your library by concept instead of by file. If most of your delivery sits on one hook type or theme, another variation of it probably won’t help, but a different one might. Once creatives are tagged, you can test which attributes correlate with performance, so your next round of production is a hypothesis instead of a guess.
Why do some new creatives get little traction in their first week?
A slow first week means different things on different networks. On TikTok, a new creative with zero impressions after seven days fits a fast yes-or-no call by the network. On Google Ads, a slow start is normal, and new creatives tend to ramp up gradually.
We looked at how often a new creative gets zero impressions in its first week on each ad network, and how much volume it gets when it does run:
- Facebook, TikTok, and Liftoff look like a “hard gate.” Between 4% and 10% of new creatives get zero impressions in week one. Creatives that get through typically see thousands to tens of thousands of impressions in their first week.
- Google Ads and Moloco look like a “soft ramp.” Under 0.5% of new creatives start at zero, but first-week volume is usually small, and over a third of new Google Ads creatives stay under 100 impressions.
Is creative fatigue one problem or two?
A creative whose impressions are falling may still be one of your best performers, because the network may simply be deprioritizing it. A creative with steady impressions may be quietly losing its audience, which a reach-only dashboard would miss entirely. That’s because creative fatigue is two separate problems. When we tracked individual creatives over their lifespan, a decline in reach (impressions) and a decline in quality (CTR and conversion rate) turned out to be largely independent. They moved together only about 30% of the time. Just as often, one declined while the other held steady or even improved.
To see how this plays out by network, we followed creatives launched after April 1, 2026 through their first 10 weeks live, using data through June 2026. Creative age is the week of a creative’s life, with week 1 as its launch week, and later weeks include only creatives that were still running.
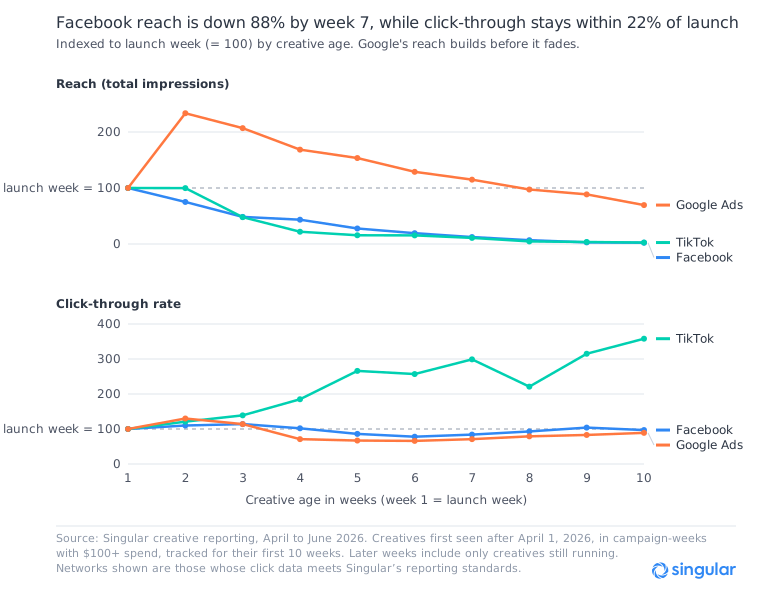
Facebook’s reach is down 88% by week 7, while click-through stays within 22% of launch. TikTok’s reach falls even faster, down 84% by week 5, while the click-through of the creatives that remain more than doubles. That’s survivorship: weak creatives get retired. Google Ads reach builds for weeks, peaking at 2.3x launch in week 2 and staying above launch level through week 7, while its click-through dips about a third in weeks 4 to 6 and then recovers most of it.
We validated the second case, where reach holds and quality erodes, on a live advertiser. Their creatives’ impressions stayed flat while CTR, conversion rate, and cost per conversion all moved the wrong way together. When several quality metrics deteriorate at once while reach holds flat, that’s a far more trustworthy signal than any single metric. The spend attached to those confirmed cases was concentrated in a handful of specific campaigns, not spread evenly across the account.
What should you change in your creative strategy?
- Track creatives per $1,000 of spend. Find the density tier where your IPM peaks, and when you go meaningfully past it, consolidate instead of adding more. A large library running past the point of diminishing returns is wasted production effort.
- Put new production into new concepts. Spend your next creative budget on a different hook, theme, or format. Know what’s in your creatives well enough to tell a new concept from a new coat of paint.
- Check reach and quality separately before you pause a creative. Falling impressions with steady CTR and conversion rate means the network is deprioritizing the creative. Falling CTR and conversion rate with steady impressions means the creative is losing its audience, and that’s the one to replace.
- Judge a quiet first week by network. On Facebook, TikTok, and Liftoff, zero impressions after week one looks like the network’s early call. On Google Ads and Moloco, a slow start is normal, so give the creative more time.
How Singular’s Creative IQ helps you find and scale your top creatives
Each of these findings comes back to the same gap. Most teams can see that a creative is running, but not what’s in it, whether it’s delivering, or which way it’s trending. Creative IQ closes that gap in three steps:
- Score: see what’s really delivering. View your creatives across networks in one place, scored on performance, so you can separate the handful carrying your delivery from the long tail.
- Explain: understand why, and whether your variety is real. AI tagging labels what’s in each creative, so you can see which attributes drive results and whether your library covers different concepts or near-duplicates.
- Act: decide what to scale, consolidate, or retire. With reach and quality tracked side by side, pause creatives whose quality is slipping, consolidate past your sweet spot, and put your next production dollar into a new angle instead of one more variation.
Frequently asked questions
What is creative fatigue?
Creative fatigue is the drop in an ad’s performance after it has run for a while. It shows up in two ways that don’t always happen together: falling reach, where the network serves the ad less often, and falling quality, where fewer of the people who see it click or convert.
How do you know when an ad creative is fatigued?
Watch impressions and quality metrics, such as CTR, conversion rate, and cost per conversion, side by side. Falling impressions on their own often mean the network is deprioritizing the ad. Falling CTR and conversion rate while impressions hold steady is the clearer sign that the creative itself is wearing out, especially when several quality metrics drop together.
How many ad creatives should you run per campaign?
There’s no fixed number, because the right count depends on your budget. Track creatives per $1,000 of weekly spend instead of total creatives, and watch installs per mille (IPM) as that ratio rises. When IPM stops improving, more creatives are spreading the same spend too thin.
Why is my new ad creative not getting impressions?
Ad networks handle new creatives differently. In Singular creative reporting data from April to June 2026, Facebook, TikTok, and Liftoff made a fast call in the first week: 4% to 10% of new creatives got zero impressions, while those that got through typically saw thousands to tens of thousands of impressions. Google Ads and Moloco ramped delivery up slowly: under 0.5% of new creatives started at zero, but over a third of new Google Ads creatives stayed under 100 impressions in week one.
Check how your network treats new creatives before you pause or replace one. Book a Creative IQ demo to find your own density sweet spot, see which creatives carry your delivery, and catch the ones losing reach or quality.
A note on the data: All figures come from Singular creative reporting, April to June 2026, and include campaign-weeks with $100+ in weekly spend that meet Singular’s reporting standards. The highest-density tier is about 89% Google Ads and skews toward a couple of verticals, so its results, including its rising click-to-conversion rate, partly reflect that mix. Launch and fatigue patterns are observed outcomes rather than confirmed mechanics, since networks don’t publish how their delivery algorithms work, and that logic almost certainly changes over time.