Mobile Analytics 101: ARPU versus ARPPU

Are you a mobile marketer? Would you like to get more ROI from your mobile app business by using your data and measurement in your mobile analytics platform better? Then you probably want to understand how Average Revenue per User (ARPU) and Average Revenue per Paying User (ARPPU) can be used to make better investment decisions for mobile user acquisition. In other words, how you can turbo-charge your app install and re-engagement campaigns.

Quick note:

As always, we recommend using ROI (not ARPU or ARPPU) as your key metric for any effort to measure and optimize app marketing. ROI is critically important because it alone tells you in dollars and cents whether what you’re doing makes economic sense. However, ARPU and ARPPU can also be valuable marketing analytics because they provide guidance on appropriate CPIs for planning. They are critical components of ROI calculations. However, you need to use them in context. High ARPU is great. High ARPPU is wonderful. But not so great, and not so wonderful if your cost of user acquisition is higher.

Let’s start with simple definitions of ARPU and ARPPU

ARPU measurement defined

ARPU is one of the most useful measures in mobile analytics. ARPU is your average revenue per user, meaning that ARPU measures total revenue driven by your app divided by your number of app installs. Singular helps you calculate this for all app installs, including paid app installs, organic app installs, or total/paid/organic installs for a particular time period. Plus, you can use Singular to further slice and dice your mobile analytics and measure ARPU data by country, vendor and campaign.

ARPPU measurement defined

ARPPU is similar to ARPU, obviously, but it measures average revenue per paying user. ARPPU is a measure that was originally designed for subscription-based apps, like a game that you pay a fee to use every month. The core idea was to be able to understand the quality of paying game users by eliminating the free or non-revenue users from the math. As you might expect, this measure is particularly valuable for freemium model apps or businesses where a small number of users drive the lion’s share of your revenue. Another place ARPPU is relevant is where you have in-app purchase revenue. ARPPU data tends to be particularly relevant for game businesses that focus on sales of virtual in-app purchase sales (IAPs). Some chose to think of ARPPU as a measure of active users, but it’s literally a measure of active payers.

ARPU measurement and install campaign vendor allocation decisions

As you’re probably already aware, ARPU is a powerful metric for both overall and comparative business analysis. Examining ARPU data across all of your installs, or broad classes of installs like organic versus paid, helps you understand both overall business viability and the quality of your app experience. It also helps you compare different games or apps in your portfolio against each other when deciding where to invest in growth.

ARPU highlights problems and successes quickly and easily. If, for example, you expected to drive a thousand dollars per user per year but your ARPU is running at just $50 a year, you clearly have experience, payment, engagement, or other product problems that need to be addressed immediately.

Of course, some apps are primarily designed not to drive revenue, but rather to improve overall customer experience.

That can be non-game apps for industries like hospitality, where augmenting customer experiences is seen as a way to drive loyalty and brand preference. An example would be a companion app for a hotel. Such apps often have relatively low revenue goals – perhaps to simply break even — or no direct revenue goals. In this case, you can compare your ARPU to your acquisition cost to see if your app is meeting this admittedly modest goal, or you can assign revenue from your core activities to the contribution your app is making.

But ARPU data is primarily used to compare vendors and campaigns to each other and determine the quality of users that you’re getting. By examining ARPU data from different ad networks, for example, you can assess if certain media sources are attracting higher or lower quality users or customers for your app. That knowledge in hand, you can quickly make the appropriate ad spend allocation decisions.

The good news in case you’re now sure how to calculate ARPU or ARPPU: both ARPU and ARPPU are metrics you can get easily in the Singular unified analytics platform.

Real-world example: average revenue per user/per paying user

To make it a little more real, let’s look at an example of how ARPU data can help you make better media allocation decisions.

Suppose you worked with just three media vendors to drive installs for your app. All were using the same creative in the same campaign. Over the course of 90 days, you found the following ARPUs:

Network A is delivering the highest ARPU, at 1.3% above Network B and 155% more than Network C, and clearly both Network A and Network B are attracting a higher quality user than Network C, at least for your business or app. That’s important to know because even if Network C offers a bit lower cost per app install (CPI) than Networks A or B, it may not make up for the difference in revenue per game user. If your cost per install for Network A were $5, then the CPI for Network C would have to be less than $1.95 for it to be as cost effective as Network A.

ARPU is a valuable directional measure to consider for gaming budget allocation. But it needs to be considered in the context of ROI.

If we assume, for example, that Network C charges $4 per install, then putting more money into Network C is far less profitable than putting it into Networks A or B. That’s because the ARPU from Vendor C is far lower. But without ARPU, you might rely on CPI to make your allocation decisions. Many companies do, and end up pouring more dollars into channels and vendors that are actually less efficient at driving revenue on equivalent cost.

Obviously here we are focusing on a component of ROI as a way of comparing relative ROI figures.

In the analysis above we focused on differences between networks’ ARPU. But the same method of analysis can also be used to compare campaigns and creative executions.

Using ARPPU to analyze your game business

ARPPU is most useful for app businesses with revenue coming from a small fraction of total users. The classic example, of course, is a freemium game. ARPPU helps because it assesses your app monetization process and buyer flow. When only a small fraction of users are payers, ARPPU will be far easier for you to see the effects of a new monetization process on existing buyers.

Here’s what we mean.

A 10% improvement in average revenue per payer driven by a better monetization process for an app with 1,000,000 installs but only 30,000 payers would be easy to spot in a test. Half your buyers go through the test process, the other half the control, and the outcome reveals a 10% difference. But if you had used ARPU, you would be dividing the revenue difference across 500,000 installs, and so the impact would seem negligible.

See below:


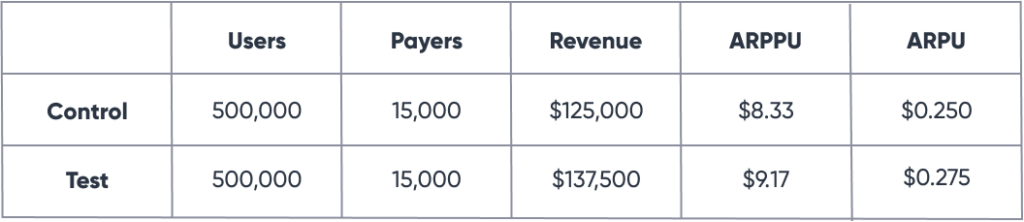
In this example, a 2.5 cent change in ARPU in your test versus the default standard process doesn’t look like much. In fact, you might think nothing really has happened: it’s only 2.5 cents more.

But if you look at ARPPU, the impact of your changes becomes obvious. When you’re just looking at paying users, the difference is almost a dollar. Clearly, ARPPU is useful in certain circumstances for apps with far more users than payers.

===================

Singular helps data-driven marketers connect, measure, and optimize siloed marketing data, providing the vital insights they need to drive ROI. Our unified analytics platform tracks billions of dollars in digital marketing spend to optimize revenue and lifetime value across industries including commerce, travel, gaming, entertainment, and on-demand services.
If you’d like to learn more or see a demo of the Singular unified analytics platform, get in touch.


Market share and the exciting future of Singular

I was recently speaking at a mobile marketing conference in San Francisco and saw a competitor’s booth.

In the booth, the competitor showed the relative market share of the various mobile attribution providers. Predictably, theirs was highest. Other players didn’t show very well, and Singular was one of them.

I loved it. Because they don’t understand what we do.

Playing a different game

Mobile Attribution is a very critical piece in a much larger puzzle.

That’s why we acquired an MMP, re-architected it as part of a holistic solution instead of a point solution, and that’s why we are winning over a massive number of tier one customers.

In fact, Singular has more customers, bar none, in the top 100 grossing apps on Android and the top 100 grossing apps on iOS than any of our competitors. 46% of the top 100 grossing iOS apps are Singular customers (and 50% of the top 50) and 46% of the top 100 grossing Android apps are Singular customers (and 50% of the top 50).

That’s because we offer something different.

Something bigger.

Singular is a marketing intelligence platform. Our mission is to provide actionable insights to our customers, the best scientific marketers in the world.

We do that by solving the massive problem of data explosion and fragmentation in the marketing ecosystem across mobile, web, TV, offline, as well as paid, email, push, organic and any other form of marketing. We go beyond the confines of mobile advertising and mobile attribution, and are the only single pane of glass for all your marketing activity.

Every company in the world needs this.

Looking to the future

Today, we unify the biggest spectrum of more than 2,000 marketing technologies. And it’s just the beginning.

To echo Jeff Bezos, it’s day one.

For us what matters is having the best North Star. And that is the top customers. In every market, the top companies are a constant source of envy and imitation by the up-and-comers and smaller companies.

Since our launch in 2014, and up until this very moment of me typing this, these top customers are the strongest source of influence on our roadmap. That, combined with our vision, is helping us move forward.

We’ve got a lot in the kitchen. You’re going to start hearing more about it in January. Our vision is huge, and we’re well capitalized to make it happen.

For our amazing Singular customers, our sole mission is to be a great, innovative partner that will always put you two steps ahead of the competition. Accept nothing but relentless drive to serve, topped with the whipping cream of world-class innovation.

That is what the best do.

And we aim to serve the best.

Data explosion: The ugly truth facing modern marketing technology stacks

Marketing technology is a fast-growing industry. It’s worth $230 billion each year and growing 20% year over year, Singular CEO Gadi Eliashiv said recently at UNIFY.

But that’s slow growth compare to marketing data itself.

“Marketing data is exploding,” Eliashiv said. “It’s growing much faster than the industry itself.”

Why?

There are more connected people, many with multiple devices. That’s more digital activity, all of which generates more data and more statistics. There are more software solutions for both martech and adtech, and each of them ingests, consumes, and generates additional data.

And with that increased digital activity — more of the customer journey is digital now than ever before — marketers have built more metrics to understand what visitors and users and customers are doing.

The current marketing tech stack for an enterprise can easily include more than 100 martech tools, Eliashiv said. The average enterprise currently has 91 cloud services for marketing, according to Netskope data cited by Kleiner Perkins and “chief martech” Scott Brinker.

This puts huge power in the hands of marketers.

But it’s also a huge problem.

“This creates major challenges for marketers,” Eliashiv says. “The data is siloed, the data is non-standardized, and the data is not actionable.”

If it was only siloed, the solution might be simple, though tedious: logging into multiple dashboards, downloading multiple PDF reports, exporting multiple Excel spreadsheets, and combining them all in an internal BI system, or a monster spreadsheet.

And … doing the same task every single week (unless you want more real-time data, in which case you could do it more often.)

But the data is also non-standardized. Naming conventions differ. Definitions of terms like “viewable” differ. Percentages are on different base figures. Conversions mean different things in different systems. So the data needs to be normalized in order to make sense.

Only then is it truly actionable.

“We make sense of it all,” Eliashiv said. “We built an infrastructure that will collect all the information from every solution possible, and then offer insights on top of it.”

That includes marketing data: what the team is doing, where they’re spending money, and what campaigns are going on across all channels and partners. It includes attribution data, which is simply linking that marketing data with outcomes. And it includes customer data: the KPIs or actions that marketing departments are trying to drive.

“The core challenge for marketers is how you make your data actionable,” Eliashiv says.

“To help marketers succeed in this fragmented space, we’re doing three things: connecting all the data from all the silos, standardizing this information so it is ready for consumption and analysis, and analyzing the information and making it actionable.”

Those three simple-sounding steps?

They take the data explosion — an ugly, inconvenient challenge for many modern marketers — and make it an incomparable asset.

Go deeper: Find out how Lyft and Match accelerate their growth.

How Singular Delivers Blazingly Fast App ROI Analytics

Mobile app marketers need access to increasingly granular data to accurately measure app ROI — which inevitably requires processing huge volumes of data on the fly. This can dramatically slow down database query times, creating bottlenecks for marketers and preventing them from optimizing as quickly and as often as they’d like to. Call it the Catch-22 of modern-day mobile marketing: an ever-increasing need for speed amid an ever-increasing flood of data.

At Singular, the issue came to the fore ahead of our latest analytics offering for marketers, Publisher ROI. Publisher ROI allows marketers to quickly expose a breakdown of an ad network’s inventory by publisher and determine the individual sites and apps driving the best performance.

Early testing of the feature showed that customer queries for publisher-level data required an enormous increase in computing power — to the tune of 50-100X the data normally being ingested and processed for queries in Singular. As we saw query times spike during testing, it became clear that we had hit a major startup milestone: We had outgrown our database technologies.

In order to launch our latest innovation, and continue offering mobile app marketers fast and flexible access to increasingly granular marketing data, we would need to introduce a new data pipeline and datastore — one that was capable of enabling ad-hoc queries on a billion rows with sub-second performance.

In this post, we’ll describe how we rebuilt certain components of our database technologies and dramatically increased the speed of our customers’ queries — in some cases by a factor of 150X.

But before we dive into how we accelerated our customers’ queries, it’s worth giving some background on the evolving needs of mobile app marketers, and the sheer size of the data challenges we face in providing them with an analytics platform as flexible as Singular.

From the early days of Singular, we kept a close eye on the kinds of queries our customers were running in Singular. We tried to spot patterns in order to build systems that anticipated the dimensions a marketer might use in their queries. But we quickly found that there was a huge diversity in the reports and queries customers were running, with countless combinations of different dimensions and metrics.

Think about it in terms of rows in a table. Say you advertise on an ad network that runs your ads on 100 different publishers. You might check the overall ROI of the network — with Singular, that’s just one line of data. To then expose a breakdown of each individual publisher’s performance in order to segment high-performing from under-performing publishers, you would need to render 100 rows of data. Now say you’re running 4 multi-country campaigns and you want to see if certain publishers are performing particularly well in certain Geos — now you’re looking at 400 rows. Want to a break out data by iOS and Android? — that’s 800 rows.

This kind of complexity led to our first conclusion about the database architecture that could support our needs. Because usage of Singular is so diverse, with countless combinations of query dimensions, we needed to support ad-hoc queries, or queries that cannot be determined prior to the moment they are issued. As most data engineers know, databases that are truly optimized for ad-hoc querying are usually not good at updating data after it is ingested. We therefore needed to ingest data into our database in its final form.

Data Ingestion at Singular

At Singular, we run around 10,000 marketing data collection tasks a day. Each collection task is responsible for collecting data for a specific customer from one of its third-party marketing vendors from a window of 1-30 days back. Our ingestion pipeline is distinctive in the volume of data each task collects (granular Facebook stats for 30 days is huge) and because we collect data from vendors who tend to update data retroactively on a regular basis, which requires Singular to constantly swap out old statistics with newly updated data.

Our ingestion pipeline previously loaded data into MySQL and kept running various ingestion logic by querying the data and using updates. After the data was available, the queries triggered by our dashboard and API would hit MySQL as well.

This has been working well for us — that is, until we introduced publisher-level collection and querying. With the large increase in data volume, loading to MySQL became slower, creating bottlenecks in our pipeline. In addition, running analytics queries on this volume of data was simply too slow.

Designing a New Ingestion Pipeline

To support an infinite number of tasks, with an ever-growing size of ingested data, we aimed to build a pipeline that was horizontally scalable (unlike MySQL). The choice of Amazon Simple Storage Service or “S3” to support these dependencies was obvious. We had already been using S3 for backing up our data before inserting it into MySQL. Plus it is horizontally scalable, requires zero ops and offers fast download/upload speed when working within Amazon Web Services.

Thus, our new ingestion architecture relies on S3 with only the metadata stored in MySQL. Instead of querying and updating MySQL, each component of our pipeline receives an S3 file as input and passes on another S3 file containing the data it received together with the new information the component produces.

The end of our pipeline sends the data to an S3 bucket, containing the most up-to-date statistics per customer, marketing source and date. This enables running data collection tasks in parallel, and makes this bucket the source of truth for our system.

Towards a New Datastore

With our data in its final form, ready to be queried in S3, our choice of datastore was super flexible. We had previously built a small abstraction layer between our API and MySQL, which could be adapted to support any query language or schema. Thus, in evaluating new databases, we knew beforehand that the decision wasn’t final, as switching costs were so low. In the end, we selected Druid, an open-source data store developed for the exact need of aggregate queries over marketing analytics data.

Once implemented, we were thrilled with the results: With Druid, queries that once 60 seconds took 1-2 seconds, while queries that once took 30 seconds took less than a second. In certain cases, we saw improvements in database query times as high as 150X compared to the old system.

All these developments bring us to earlier this year, when we began switching on Publisher-Level ROI for select customers in a closed beta test of the feature. The beta would serve as the ultimate stress test for our new architecture.

Granularity & Speed for the Win

As a refresher on Publisher-Level ROI and why it’s so groundbreaking, here’s a little industry background. Ad networks typically purchase inventory consisting of ad slots in hundreds, sometimes thousands, of sites and apps. These sites and apps, known individually as “publishers”, are where marketers’ ads run.

In recent years, mobile app marketers have demanded more visibility into publisher-level performance in order to identify pockets of their most valuable traffic. Networks have responded by providing Publisher IDs in the performance data they expose to marketers. Marketers, in turn, use these Publisher or Site IDs to optimize, increasing spend in high-performing publishers and decreasing spend or “blacklisting” under-performers.

Historically, however, publisher optimization across multiple networks has been an arduous and error-prone process, requiring marketers to toggle between multiple dashboards and manually update unwieldy Excel files. The process is particularly painful for marketers who wish to analyze the performance of publishers not merely by click-through rates or raw install count but rather by the actual quality of those users, as measured by ROI.

Singular automates the process of collecting all your marketing data under one roof, before cleaning and combining the data with revenue and events retrieved from tracking links in order to expose app ROI and other full-funnel business metrics.

But, as we’ve shown here, once ingested, enriched and combined, making publisher-level data fast and flexible is a whole ‘nother beast. Which is precisely why we invested so heavily in our new pipeline and datastore. Mobile app marketers need both granularity and speed — and we’re proud to say that the results speak for themselves.

As we’ve rolled out Publisher-Level ROI to our beta test customers who are now running on our new Druid-based system, customers have reported lightning-fast load times, even with the massive increase in data volume.

And the performance improvements aren’t limited to publisher-level querying. With Singular, similarly data-intensive querying — to expose Campaign, Country, Creative and User-Level performance — is now faster than ever thanks to these advancements in our new database technologies.