Creative analytics
Beat activates thumb-stopping ads at scale with advanced creative analytics
About Beat
Beat creates a new ride experience by connecting thousands of passengers with nearby available drivers in real-time. Through the app, you can request a driver 24/7. Beat is more than an app that takes you from A to B. We exist to build technology for a better urban life, to become part of people’s life by making transportation in the city more affordable, efficient and safe, while providing economic opportunities to anyone. The company was founded in 2011 and is part of the FREE NOW group, the ride-hailing joint venture of BMW and Daimler. Beat is currently available in Greece, Peru, Chile, Colombia, Mexico, Argentina, with plans to expand to more cities in Latin America, and has a Tech Innovation and Engineering Hub in The Netherlands.
Their story
After establishing a launch strategy across new countries in Latin America, Beat’s Content Team needed to translate their USPs into their digital ad experience. Extensive creative testing would be vital to do this effectively.
But creative reporting was becoming a monstrous undertaking due to Beat’s massive ad portfolio.

![]()
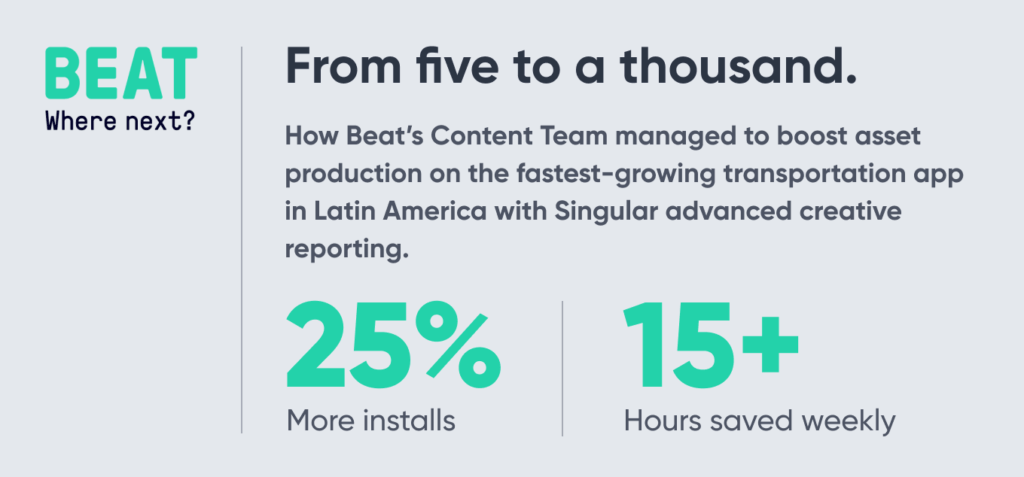
When I joined Beat in 2018, only five pieces of creatives were running per month, and creative testing wasn’t a real thing. Last year we changed this scenario and delivered 1000 pieces of creatives per month. We needed to intensify testing and understand the needs of our audience across LATAM.
Dave Sousa – DM Content Coordinator, Beat
Marketplace x languages x services = 12,000 pieces of creatives annually
Between the need for hyper-localized ads, serving both sides of their marketplaces, and numerous ad formats across dozens of ad networks, creative reporting was quickly becoming a challenge. The team needed an easier, faster way to analyze each of their creatives’ impact on the Beat’s growth goals.
Their solution
Several growth teams at Beat were already using Singular for attribution, cost aggregation, and campaign analytics. The Content Team naturally turned to Singular to help them automate their reporting processes and build their dream dashboard for creative optimization on top of Singular’s marketing data infrastructure.
Thanks to Singular’s ability to join campaign data, like creatives and cost, from all their media sources with attribution data, like conversions, the Content Team was able to go beyond optimizing for installs and improving optimization for the metrics that matter like ROI, CPI, and CPA.
With Singular’s asset rendering, the team was finally able to visualize the actual ad asset, including video assets, and its performance in a side-by-side view, instead of staring at a string of characters in a creative ID or name.
Typically marketers use manual creative tagging to group creatives by attributes, like concept or geo, but at Beat’s scale, that wasn’t going to cut it. With Regex Custom Dimensions, the team was able to programmatically group creatives by an array of variables, including city, campaign type, ad format, and more.
Singular’s Creative Clustering grouped similar creative regardless of minor copy or compression differences with image recognition technology so the team could understand how a given asset was performing across different campaigns and media sources.
With all data collection, aggregation, and tagging automated with Singular, the team was able to load clean, organized creative reporting data directly into their data visualization via the Singular’s ETL and build a completely custom dashboard. All of their creatives, across their many media sources and campaigns, are easily accessible in a single dashboard. Talk about a single source of truth.
Their results
By automating their creative reporting process, the Creative team at Beat can skip tedious tasks and continually elevate their ad experiences. And it’s paying off big time.
The team was able to save countless hours a week, and most importantly, they increased installs by 25% in one unique campaign using playable ads after testing.
Success Metrics

![]()
We managed to work together on the first Beat Creative Report with Singular combining our expertise on creative performance, enhancing the tool to provide a sharp overview of the metrics we needed to analyze, and building a dashboard that resonates with our diverse audience segments.
Dave Sousa – DM Content Coordinator, Beat

Stay up to date on the latest happenings in digital marketing
Simply send us your email and you’re in! We promise not to spam you.

