Table of contents
- Ad spend up … but tariffs are having an impact
- Global ad spend trends
- Revenue vs installs: iOS vs Android
- Hottest genres with the most downloads: global
- iOS-specific metrics: ATT & SKAdNetwork
- Global trends: CPI, CTR, CPM, and IPM
- Platform and geo-specific metrics: CPI, CTR, CPM, IPM
- Ad network share of spend
- Also see: Singular ROI Index 2025
- Contributions from partners

Ad spend up … but tariffs are having an impact
A quarter after the first trillion-dollar year in advertising history, ad spend measured by Singular is up 40.3% year over year, led by Entertainment, which more than doubled year-over-year. Finance, and On-demand verticals are also sharply up. On the other hand, mobile game spend is down, and Shopping verticals are seeing strong headwinds from the global tariff wars.
Welcome to the Singular Quarterly Trends Report for Q2 2025.
- CPI: Cost per install is up
- CTR: Click-through rates are up
- CPM, IPM: So are cost per mille and installs per mille
For ad networks, we see the continued growth of rewarded or incentivized models, with Kashkick, TyrAds, and MAF leading the way for networks gaining spend in Q1. Also growing: Rokt, Reddit, Remerge, Liftoff, and Snapchat. One of the top networks gaining advertisers (Singular customers) is Benjamin, another rewarded ad network.
In this QTR we also take a hard look at why iOS is so incredibly valuable to advertisers: showcasing the vast gulf between installs on Android and monetization on iOS vertical by vertical. The only exception: Utilities apps.
What you’ll find inside:
- Global ad spend trends
- U.S. tariff impacts on e-commerce ad spend
- Changes in ad spend by vertical
- Monetization distortion: why iOS matters so much
- Hottest app genres with the most installs
- iOS-specific metrics around ATT and SKAdNetwork
- Global trends in
- Cost per install
- Click-through rates
- Cost per mille (thousand ad shows)
- Installs per mille
- Platform-specific metrics
- Region-specific metrics
- Ad network share of spend
- Which ad networks are growing
- Best regional and vertical-specific ad networks
- And much more …
Also, we have stellar contributions from our partners, including:
- Aarki
- Appier
- Adikteev
As always, data in this report is based on a significant slice of Singular’s data:
Author: John Koetsier
Data scientist: Gaston Laterza
Global ad spend trends
Global ad spend is up
Global ad spend by Singular customers is up 40.3% year-over-year (YoY). As you’d expect following the holiday quarter, however, spend is down 7.4% quarter-over-quarter (QoQ).
Here’s the data, normalized to Q1 2024 spend:
While Q2 2024 was almost flat with Q1, Q3 and especially Q4 — which was 51% higher than Q1 — saw massive increases. Largely we can attribute that to typical holiday quarter spend, but not completely.
The 40.3% YoY increase in Q1 2025 is clearly a positive for the mobile space: Singular’s customers are among the most savvy performance marketers on the planet, and they only spend when they see return.
Ad spend by vertical: change
More interesting, perhaps is the ad spend data by key verticals.

Here’s a normalized comparison of Q1 2025 to Q1 2024:
- 100% is exactly equal, YoY
- Under 100% is a decline
- Over 100% is an increase
The most obvious result here is that the Entertainment category is exploding. We’re talking streaming, largely, and as we’ve seen very recently, entertainment apps are massive and growing globally.
Entertainment app growth spend in Q1 2025 was more than double the year-ago quarter, up 209%.
That’s huge.
On-demand apps are also growing significantly. Here we see transportation, delivery, and grocery apps, among others. While the growth is masked a little quarter-over-quarter due to monster holiday quarters, Q1 2025 was big for on-demand.
For on-demand, spend was up 56% year-over-year: also pretty impressive.
Gaming was down slightly, while Travel was up 26% year-over-year.
Tariff impact on shopping apps in the USA
Can we attribute the significant drop in Shopping ad spend to the current tariff situation in the United States? After all, we know that a huge amount of e-commerce ad spend, including for app user acquisition, was by Chinese retailers such as Temu and Shein.
Tinuiti data, for example, shows that:
Temu dramatically reduced — and eventually stopped — spending on Google Shopping ads between April 9 and 12, 2025. Shein is following a similar pattern, having cut its Google Shopping ads investment on April 15.
That said, shopping UA was fairly likely to drop anyways after the holiday quarter.
If we look at normalized spend in the Shopping category for everywhere but the United States since Q1 2024, we can see that Shopping ad spend in Q1 2025 is slightly down YoY: just 1.5%. It’s also down 21% QoQ. However, that makes sense: it’s following the holiday quarter.
What about the United States, which is applying tariffs on most other countries, but especially China?
Here’s U.S. e-commerce ad spend, normalized to Q1 2024 data.
Ad spend on shopping apps is down 44.9% YoY and down 45% QoQ.
It’s always nice to get more data from subsequent months and quarters, especially since Q4 2024 was the only quarter up from Q1 of that year (just slightly) but I think it’s pretty clear: tariffs are having an impact.
Global region share of spend
Not surprisingly since Singular is a U.S. company, almost 40% of the ad spend we measure is in the United States. However, other regions are growing quickly, especially countries in LATAM, APAC, and EMEA.
Revenue vs installs: iOS vs Android
There is a clear inverse relationship between downloads and revenue in the mobile ecosystem. Android, which wins the lion’s share of the app installs, accounts for a disproportionately tiny share of the revenue, except for 1 vertical.
Here you can see that massive dichotomy visually:

For example, gaming:
- Android gets 89.5% of the installs
- iOS gets 89.6% of the revenue
Or fintech:
- Android gets 83.6% of the installs
- iOS gets 63.5% of the revenue
In Health & Fitness, Android gets fewer installs than other verticals, “only” 67.6%. But iOS cleans up on revenue with a staggering 92.6%. In our catch-all Other category, Android gets 94.4% of the installs but iOS gets 93% of the revenue.
The only category where this relationship does not hold true is Utilities:
- Android gets 86.7% of the installs
- Android also gets 77.1% of the revenue
Likely reasons:
- Android allows deeper system access that Utilities apps can access and tweak (cleaning caches, UI overlays, etc.)
- Apple bans or limits some categories of Utilities (call blockers, app lockers, or system cleaners)
- Utilities apps can be very heavy on ad load versus subscriptions or IAPs, which are iOS specialties
- Utilities apps can be dominant in emerging markets, where file managers, battery savers, and VPNs are needed, and there are significantly fewer iOS apps in those markets
There is a small caveat to mention here.
Singular measures revenue for our customers in at least 3 ways: in-app purchases, subscriptions, and ad monetization revenue. It’s critical that monetization data be accurate, because that’s how clients measure user acquisition campaign success or failure. However, not all ad networks participate in our Ad Monetization Attribution & Analytics solution, so there may be some missed ad revenue.
All the details for each major vertical:
| Vertical | Platform | Installs | Revenue |
| Gaming | Android | 89.49% | 10.37% |
| iOS | 10.51% | 89.63% | |
| Financial | Android | 86.26% | 36.51% |
| iOS | 13.74% | 63.49% | |
| On-Demand | Android | 86.35% | 26.39% |
| iOS | 13.65% | 73.61% | |
| Travel | Android | 72.86% | 36.26% |
| iOS | 27.14% | 63.74% | |
| Shopping | Android | 73.74% | 17.79% |
| iOS | 26.26% | 82.21% | |
| Utilities | Android | 86.69% | 77.08% |
| iOS | 13.31% | 22.92% | |
| Health & Fitness | Android | 67.55% | 7.37% |
| iOS | 32.45% | 92.63% | |
| Entertainment | Android | 79.70% | 64.64% |
| iOS | 20.30% | 35.36% | |
| Education | Android | 78.29% | 10.93% |
| iOS | 21.71% | 89.07% | |
| Other | Android | 94.44% | 7.02% |
| iOS | 5.56% | 92.98% |
Hottest genres with the most downloads: global
Android games
Puzzle, Simulation, and Action games are the hottest game sub-genres this quarter. In fact, these 3 categories alone make up 76% of all game downloads on Android.
More interesting, perhaps: here are the fastest-growing game categories on Android, year-over-year:
- Match: 171%
- Puzzle: 150%
- Action: 140%
- Sports: 135%
- Kids: 132%
Android apps
On-demand apps for transportation, delivery, and services is by far the hottest category globally for Android apps right now.
iOS games
Simulation and Puzzle are 2 of the hottest game sub-genres on iOS, just like Android. But Sports games beat out Action for third place.
There’s also less consolidation on iOS. Where the top 3 categories on Android take 76% of all installs, the top 3 on iOS take just 63%.
The fastest-growing categories on iOS, year-over-year, are:
- Action: 218%
- Educational: 210%
- Card/Tabletop: 177%
- Simulation: 154%
- Gambling: 136%
iOS apps
The picture is totally different for iOS apps compared to Android apps. Entertainment is by far the largest category for iOS apps, followed by On-demand.
iOS-specific metrics: ATT & SKAdNetwork
Overall ATT opt-in
On the face of it, ATT opt-in rates are nearing historic lows, though it’s challenging to compare this quarter’s data with previous quarters as we’ve changed our measurement methodology.
But don’t panic. There’s reasons for the madness.
First, the specific data points:
- ATT no: 89.5%
- ATT yes: 9.3%
- ATT null: 1.2%
In previous Quarterly Trend Reports, we did not report the null rate. This is mostly devices that are not eligible for tracking or measurement, generally because they are used by children, or are managed corporate devices. Additionally, ATT can show null when apps have not yet asked for tracking permission.
With that out of the way, for every 100 initial iOS app starts, approximately 9 will provide App Tracking Transparency right off the bat.
The rest are not all “no” answers, however.
Some apps do not ask for ATT permission on first open. Instead of trying to hit a home run, they offer coffee. A first date. Maybe dinner. And then, after a few engagements and some retention, or after they get to first base, they’ll pop the question.
So what the data above shows is that on initial app open, most apps — whether they ask for ATT tracking permission or not — do not have ATT tracking permission. These numbers will increase over time, and in future QTRs we’ll try to extract that data for a more full picture of the active iOS ecosystem.
ATT opt-in rates by vertical
ATT opt-in rates vary tremendously by vertical. 3 verticals that are enormously successful at obtaining opt-in permission are:
- On-demand: 18.4%
- Gaming: 26.5%
- Utilities: 33.9%

Shopping, on the other hand, Entertainment, Travel, and Health & Fitness really struggle to get ATT tracking permission:
- Shopping: 2.2%
- Entertainment: 1.4%
- Travel: 2.2%
- Health & Fitness: 4.9%
Why?
Some of these categories are more sensitive than others, like Health & Fitness, with personal data. Others like Shopping might have juicy financial data that people want to protect.
But I suspect the biggest difference is age.
While gamers are all ages, more games are downloaded more frequently by younger people, and they are less likely to care about privacy issues, and more likely to somewhat mindlessly tap through dialogs to get to their games.
SKAN adoption trends
SKAN 4 adoption just kissed the 52% mark on May 7, 2025.
SKAN 3 and SKAN 4 adoption rates, however, are very variable and SKAN 4 percentages often regress. Still, there’s been a very slow upward trend for the past 2 years.
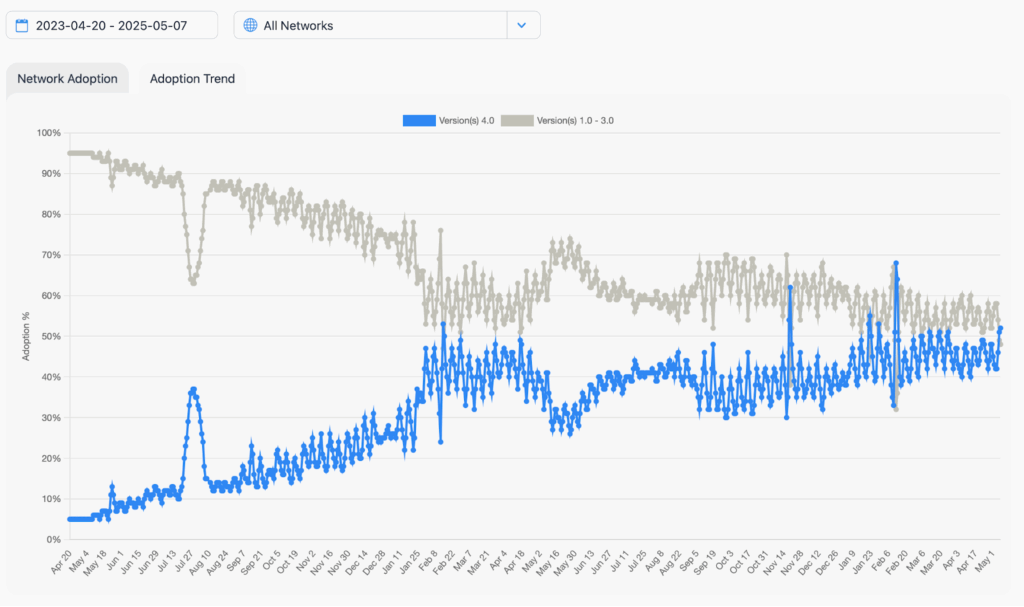
At some point we will likely start to see AAK make an appearance, but it’s arguable whether this — or SKAN itself — will ever be even somewhat as important to mobile marketers as it once appeared to be, back in 2023.
Ultimately, SKAN matters as a deterministic attribution methodology on iOS. But clearly over the past years SKAN has become only part of the measurement mix, not the full meal deal.
Global trends: CPI, CTR, CPM, and IPM
Global CPI was up 10.6% in Q1 2025 to $1.57, calculated YoY.
As you’d expect, CPM was up 14.5% YoY, though down 12.7% QoQ thanks to the holiday hangover.
CTR was massively 37.6% YoY, continuing a 5-quarter trendline and IPM was up slightly at 4%. Why the massive boost in CTR? Most likely it’s the ongoing impact of rewarded ads that frequently open App Store views and landing pages on almost any tap … and sometimes without any tap at all. In other words, it’s manufactured, not real. You can still use CTR as a useful metric, as long as you take it with a rather large grain of salt.
CPI trends
- Q1 2025: $1.57
- Q1 2024: $1.42
- Up 10.6% YoY
- Down 3.7% QoQ
CPI by vertical: Q1 2025
Android apps
Shopping and fintech apps are the most expensive on Android. But Education is the fastest-growing in user acquisition cost: an Education app install was under $0.50 last year, and now it’s at $1.30.
iOS apps
Fintech apps are the heavyweight champions on iOS for UA cost.
A massive app install cost of $48.82 reflects how profitable fintech users/customers can be, especially in the U.S., Europe, and Tier 1 countries.
CTR trends
- Q1 2025: 4.06%
- Q1 2024: 2.95%
- Up 37.6% YoY
- Up 17% QoQ
CPM trends
- Q1 2025: $3.24
- Q1 2024: $2.83
- Up 14.5% YoY
- Down 12.7% QoQ
IPM trends
- Q1 2025: 2.07
- Q1 2024: 1.99
- Up 4% YoY
- Down 26% QoQ
Platform and geo-specific metrics: CPI, CTR, CPM, IPM
Android games by region
Highlights:
- CPI is highest in USA, China, and Japan
- CTR is lowest in China
- CTR is highest in “rest of world”
- Nothing comes close to the U.S. in CPM
- IPM (installs per thousand ads shown) is miniscule in China
- IPM in most of the rest of the world is between 3 to 5 installs
Region legend:

CPI by region
CTR by region
CPM by region
IPM by region
Android apps by region
Highlights:
- Unsurprisingly, the U.S. has the highest CPI
- Japan and Tier 1 West countries are a close second in CPI
- Japan has the highest CTR of any region
- Tier 1 West countries have the lowest CTR
- CPM is the highest in the U.S. at $8.11
- Only Japan and Tier 1 West have even half as much as the U.S
- IPMs are in the 2+ range for U.S., Tier 2 West, Tier 2 East, and Rest of World; everywhere else they are low
Region legend:
CPI by region
CTR by region
CPM by region
IPM by region
iOS games
Highlights
- RPG games have by far the most expensive CPI: $36.50
- Casino is the next closest at $16.69
- The cheapest categories, Kids, Racing, and Board are all sub-$1
- CTR is way up this quarter: over 250%. In-app ads are triggering more and more “clicks” AKA app listing views that get registered in SKAdNetwork as clicks
- CPM is up slightly at 2% YoY, but down 27% from Q4 2024, the holiday quarter
- IPM is down slightly, 4%, YoY: it now takes a few more ads to drive an app install
Note:
- Since we’re just using SKAN data for this, there’s no region breakdown
- However, we have added trend data
CPI by genre
CTR with trend data
CPM
IPM
iOS apps
Highlights
- CPI was down 19.5% YoY for iOS apps, but it’s still a hefty $7.78, driven largely by super-expensive fintech app installs
- Note the massive QoQ drop in CPI … essentially half
- CTR is down slightly YoY, but up from recent quarters (apps don’t have nearly as many rewarded ads with spurious “clicks” driving up CTRs as games)
- CPMs are up 18% YoY, while down 23.6% QoQ
- IPMs are up 47% YoY and 49% QoQ: either ads are significantly better, or people are paying more attention to them
Region information
- Since we’re primarily using SKAN data for this, there’s no region breakdown
- However, we have added trend data
CPI
CTR
CPM
IPM
Ad network share of spend
It’s not a secret. Most of us know the biggest ad networks that are capturing the lion’s share of advertiser’s dollars.

As you can see, it’s pretty much the same cast of characters on both platforms, but a slightly different order.
Perhaps what’s perhaps more interesting than who is currently winning is which ad networks are gaining the largest share of spend …
Android: top ad networks gaining spend
Ad networks gaining the most share of spend by Singular clients, year over year, for Q1 2025, include:
Interestingly, while Google’s DSP DV360 gained share, Google’s main Adwords division actually lost market share year over year.
Note that there’s an explosion of rewarded/incentivized ad networks here, including:
iOS: top ad networks gaining spend
Ad networks gaining the most share of voice, year over year:
Apple Ads (formerly Apple Search Ads) actually lost market share year over year. This is likely due to the industry finding measurement solutions outside of ATT and SKAN, making marketers less dependent on App Store ads.
Note that rewarded and incentivized ad networks are huge on iOS as well, with a similar list of top gainers including Kashkick, MAF, and TyrAds.
Ad networks gaining advertisers
Another way to look at shifts in the adtech ecosystem is to see which ad networks are gaining or losing customers. In other words, where are advertisers moving in search of ROI?
Here are the top gaining ad networks for early 2025 among Singular customers:
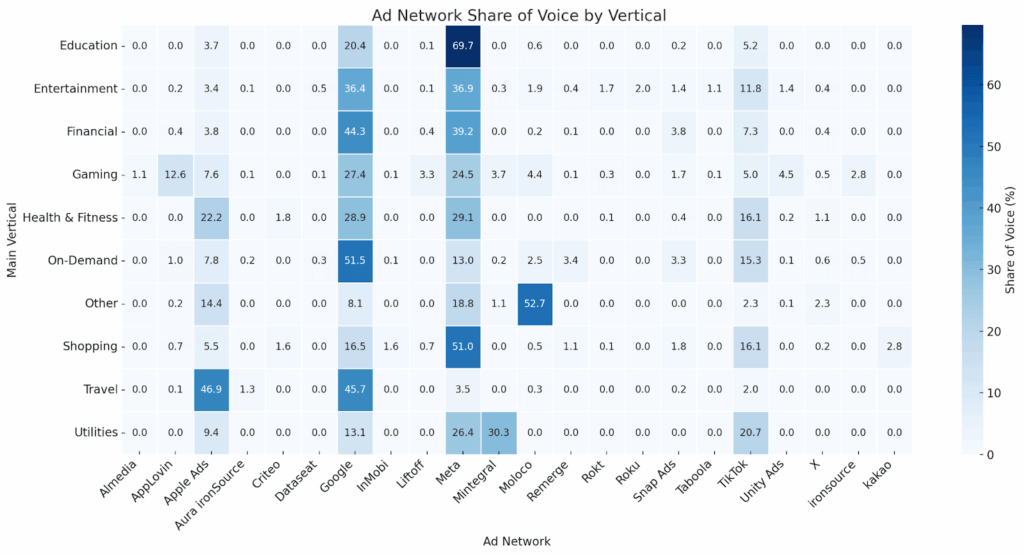
Ad network share of voice by vertical
It’s also interesting to look at ad networks to see what they are especially good at.
While you’d expect the biggest players — Google, Meta, TikTok, and Apple — to dominate in pretty much every category, there are some interesting insights app marketers can find outside these giants.
If we look at which of the top 20 or 30 ad networks have significant share of voice across key verticals, here’s what we see:
As you’d expect, Meta, Google, Apple Ads, and TikTok dominate.
Here’s a heatmap version of that data. Again, Meta and Google show well. But you can also see that …
- Apple Ads is particularly capable in Travel, Health & Fitness, and Other
- Liftoff is strongest in gaming, as is AppLovin and ironSource
- Moloco is the best in “Other,” categories we’re not breaking out here
- TikTok is strongest in Utilities, Health & Fitness, Shopping, and On-Demand
- Roku is — as you’d expect — strongest in Entertainment
Perhaps an easier way of looking at the data: which are the top 5 ad networks per vertical?
Here’s the answer:

So, yes, there’s a lot of dominance by the titans of adtech. But there’s also a few challengers fighting to get into the mix.
Ad network: regional insights
Outside of Google and Meta, here are a few networks that are particularly strong by region. As a reminder, here’s our region legend:


Also see: Singular ROI Index 2025
We recently released the Singular ROI Index 2025, where we dive deeper into ROI by ad networks.
This year’s Index includes:
- Top-performing ad networks by ROI, scale, and growth
- The Singular ROI Quadrant: where value meets volume
- Breakout platforms like Moloco, Liftoff, Reddit, and Apple Search Ads
- First-ever ability to filter results by geo and app categories
- Insights into the rising wave of rewarded ad networks
Based on billions in ad spend, tens of billions of app installs, and trillions of ad impressions, the Singular ROI Index is the longest-running and most comprehensive ROI-focused adtech report for the mobile space.
Contributions from partners
Aarki: stickier apps, stronger profits
A 10% eetention lift can boost profit by 90%
The mobile ecosystem is a rapidly evolving “App Hive,” where users fluidly navigate between apps to meet both functional and emotional needs. Yet, despite consumer spending reaching $127 billion in 2024, app installs have declined by 2.3%, signaling a shift in growth dynamics. Acquiring new users is no longer enough—without sustained engagement, churn erodes profitability.
This is where App Stickiness becomes a critical metric. A mere 10% increase in retention can drive up to a 90% boost in profits, proving that growth isn’t just about bringing in new users—it’s about keeping them engaged.
User acquisition alone doesn’t secure long-term success; it must be reinforced with strategic retargeting to maximize lifetime value and revenue. In today’s app economy, retention isn’t just a performance metric—it’s the new growth currency.
Understanding the App Stickiness Index
The App Stickiness Index measures how effectively an app retains users at key intervals: Day 1, Day 7, Day 14, and Day 30. Apps addressing functional needs succeed in immediate engagement (high Day 1 stickiness) but struggle with retention beyond Day 7.
Apps typically fall into two categories.
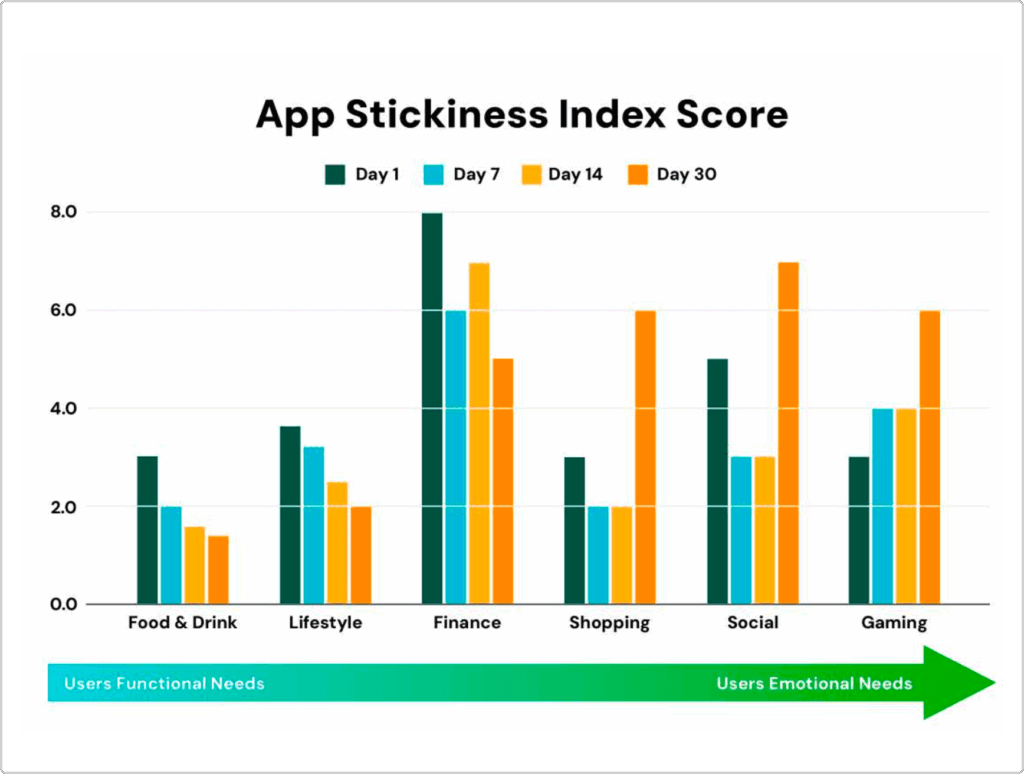
Functional Needs Apps, such as Food & Drink, show impressive early engagement (Day 1, Day 7) in solving immediate needs, but often decline over time.
In contrast, Emotional Needs Apps, like Gaming and Social, may have lower initial engagement but build long-term retention, peaking around Day 30.
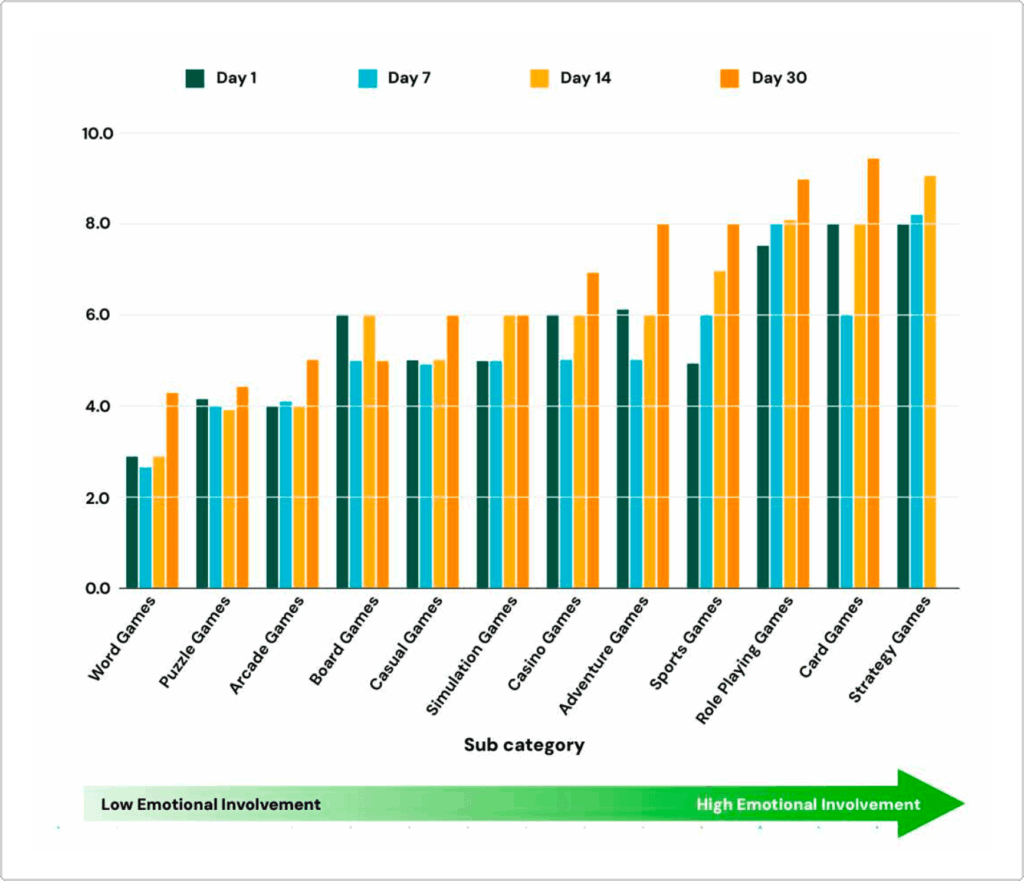
The gaming category offers a particularly fascinating lens into App Stickiness. These apps stand out with high retention rates, but stickiness varies by genre.
- Card & Strategy Games and Role-Playing Games (RPGs) show sustained engagement due to competition, mastery, and long-term progression.
- Adventure, Casino, Board, and Sports Games maintain moderate retention but may see dips due to repetitive content.
- On the other hand, Puzzle, Word, and Arcade Games struggle with retention, as their simpler mechanics often fail to create deeper emotional engagement.
Boosting retention with App Stickiness Insights
The stakes are high. Successful marketers are no longer stopping at user acquisition—they’re building strategies that go beyond the download to drive long-term engagement. In today’s app economy, growth isn’t just about attracting users; it’s about keeping them active.
By leveraging App Stickiness and retargeting, marketers can turn short-term users into loyal customers, maximizing lifetime value and sustaining growth in the App Hive. The future belongs to those who not only acquire users but retain them, ensuring that every install translates into lasting revenue.

Adkiteev: retargeting delivers lift
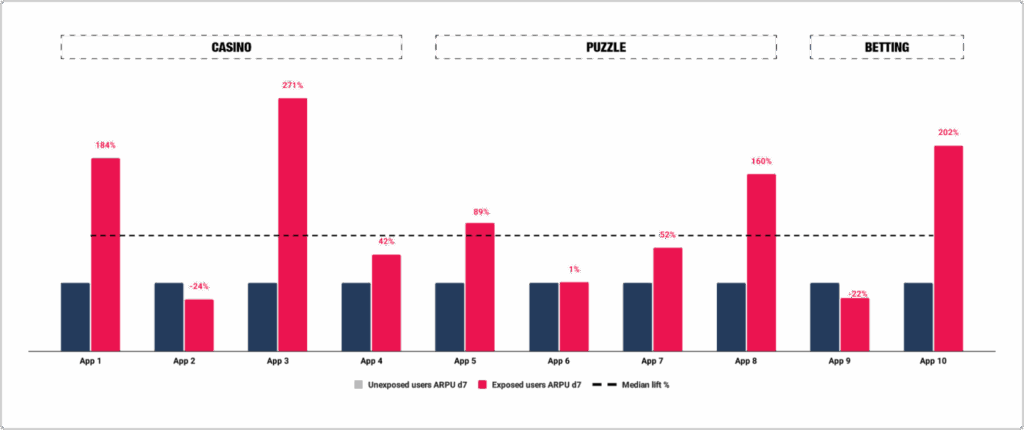
Retargeting delivers 31% median lift in D7 ARPU for casino & puzzle apps
As a retargeting company, Adikteev is focused on helping app marketers increase user value through data-driven engagement strategies. To better understand where and how retargeting delivers the most impact, Adikteev’s team conducted a study across apps in the casino and puzzle categories—two verticals with comparable monetization models and user behaviors.
Adikteev analyzed the impact of retargeting by comparing Day 7 ARPU (Average Revenue Per User) between users exposed to retargeting campaigns and a control group. The results showed that 50% of apps experienced a D7 ARPU increase of over 31%, with a median lift of +31% across all apps. One app achieved a standout gain of +205%. While some apps saw limited or negative impact, the findings underscore the importance of strategic targeting and campaign design based on app genre and user segmentation.
For app marketers, this reinforces that retargeting can be a powerful lever for revenue growth—when applied thoughtfully. Success depends on understanding where retargeting drives real value and continuously optimizing campaigns based on performance data, user behavior, and app-specific dynamics.

Appier: data-driven reengagement
Data-driven re-engagement of inactive game players
The mobile game lifecycle follows three typical phases:

- Soft-Launch (±1 month): Initial player acquisition and gameplay refinement
- Scaling Period (±6 months): Aggressive user acquisition with rapid growth followed by gradual stabilization
- ROI-focused Period (6+ months): Sustainable growth with profitability as the primary metric
During this final phase, industry data reveals a significant shift in performance marketing budget allocation. The traditional 80:20 split between user acquisition and retargeting has evolved to 70:30 or even 60:40, depending on game category. This shift underscores a critical insight: re-engaging inactive users delivers superior ROAS compared to acquiring new ones.
The re-engagement timing dilemma
Performance marketers face a persistent question: When is the optimal moment to re-engage lapsed users? The conventional approach targets users inactive for 7 days, but our data analysis challenges this assumption.
Case study: retention analysis
Working with Spark Info on their hybrid IAP/IAA title “Hunting Sniper,” we conducted comprehensive retention analysis using data from mobile measurement partner like Singular. The results were definitive:

This analysis revealed a clear engagement cliff after just 3 days of inactivity, with recovery probability diminishing rapidly thereafter. This data-backed insight invalidates the 7-day targeting convention and establishes a more effective re-engagement window.
AI-powered churn prediction: the solution
Armed with precise inactivity thresholds, we implemented a real-time churn prediction model that:
- Identifies high-risk users before they reach the critical inactivity threshold
- Triggers targeted re-engagement through premium mobile networks
- Delivers personalized creative content at optimal moments
Measurable performance impact
This approach delivered exceptional results:
- Achieved top-ranking Day 0 ROAS across all marketing channels
- Generated Day 7 ROAS 1.5X higher than target benchmarks
- Demonstrated clear incrementality compared to standard retargeting approaches
Creative Optimization: The Final Performance Lever
Creative strategy significantly amplifies re-engagement effectiveness. Our testing revealed:
- In-banner gameplay videos featuring dynamic highlights and clear CTAs delivered 2.3X higher ROAS
- 30-second landscape videos with immersive storytelling and incentive-driven CTAs achieved 13X higher CTR
Conclusion
The data is clear: optimizing mobile game re-engagement requires challenging conventional wisdom with rigorous analysis. By identifying precise inactivity thresholds, leveraging predictive AI, and deploying targeted creative strategies, performance marketers can transform lapsed users into a significant revenue stream with measurable ROI.
For a complimentary retention analysis of your game title, contact our performance marketing team.
Trends on InMobi DSP in Q1 and early Q2 2025
Across the InMobi DSP platform, multiple advertising verticals witnessed strong and varied growth patterns, reflecting evolving user behavior and responsive campaign strategies.
- Gaming: Contrary to the industry, gaming spends on InMobi in 2024 witnessed a 38% growth through. However, in Q1 we saw normalization in growth and return to industry alignment
- QSR, Shopping, Finance, Sports, News & Magazines: These non-gaming verticals demonstrated steady and sustained growth ranging from 6%-10%, throughout Q1 building on the strong foundation established throughout 2024
- Travel, Music, Education, Auto, Comics: These emerging sectors showed a surge in performance during Q1 2025 and early Q2, pointing to seasonal relevance and expanding user interest
Strategic levers driving growth
- Creative experimentation: Especially in gaming, the use of playables, interactive end cards, and rewarded video formats dramatically improved user engagement. These same creative strategies were selectively applied across non-gaming verticals to drive performance uplift.
- Owned & operated signal utilization & supply optimization: Integration with InMobi Exchange (IX), Glance, and 1weather allowed for better audience matching using app context, device-level signals, and session quality, contributing to higher ROAS and better win rates.
- Machine learning model enhancements: Feature engineering improvements enabled more accurate intent prediction and audience segmentation, particularly benefiting high-intent verticals like travel, education, and auto during seasonal peaks.
- Format innovation (Audio, Native, Carousel): For music and education apps, we introduced video with end cards and native formats optimized for discovery-led journeys. Comic and magazine apps leverage scrollable, rich media carousels to promote visual engagement.
- GenAI led content marketing: For hyperlocal delivery and shopping applications, generative AI was utilized in real-time to create contextually relevant ads which improved the conversions.
Looking ahead: 2025 predictions
Based on current trends, here’s what we anticipate on the InMobi platform in the coming months:
- Gaming is expected to stabilize, with a sharper focus on acquiring high-value users. We foresee playables and rewarded ad formats continuing to lead, as advertisers adopt more nuanced targeting strategies built around LTV optimization and predictive user scoring
- Shopping and QSR should maintain their growth momentum, leveraging location, purchase, and contextual signals to deliver campaigns that drive both immediate conversions and build long-term loyalty
- Education, Music, and Auto categories are likely to experience several growth spurts, as more advertisers on InMobi embrace unified intelligence platforms. We expect these verticals to accelerate optimization by applying learnings from established categories as their own data sets mature
- Travel has the potential to become the next major growth category on our platform, as consumer confidence returns and AI-powered travel planning tools gain traction
These are our working predictions for 2025 at InMobi, and we’re closely watching how these trends evolve across our ecosystem.