
Content
Stay up to date on the latest happenings in digital marketing
Summary
-
Ad Spend Trends: While overall ad spending increased by 40.3% in Q2 2025, the U.S. e-commerce sector faced a significant decline of 44.9% year-over-year due to tariffs affecting retail app growth. Marketing professionals should adjust strategies to navigate this downturn by reallocating budgets towards more resilient sectors like Entertainment and On-demand, which saw substantial increases in ad spend.
-
Shifts in Consumer Behavior: The decline in e-commerce ad spending aligns with major players like Shein and Temu reducing their investments in Google Shopping ads. Brands should focus on understanding the impact of external factors such as tariffs and consider diversifying their marketing channels to mitigate risks associated with economic changes.
-
Emerging App Categories: Notable growth in user acquisition was observed in mobile game categories, particularly Match and Puzzle games on Android and various genres on iOS. Marketers should explore these trending genres for potential investment opportunities and tailor their campaigns to capitalize on the
Ad spend is significantly up in the new Singular Quarterly Trends Report for Q2 2025, but not for the Shopping category in the United States, where we’re seeing a massive slump that correlates with the new tariffs on China and other nations.
We’re releasing the new QTR today.
Singular’s Q2 2025 Quarterly Trends Report: what’s inside?
The Q2 report is the most comprehensive we’ve ever released in this seventh iteration of the Singular quarterly trends report. Here’s a brief overview of what you can expect:
- Global ad spend trends
- U.S. tariff impacts on e-commerce ad spend
- Changes in ad spend by vertical
- Monetization distortion: why iOS matters so much
- Hottest app genres with the most installs
- iOS-specific metrics around ATT and SKAdNetwork
- Global trends in
- Cost per install
- Click-through rates
- Cost per mille (thousand ad impressions)
- Installs per mille
- Platform-specific metrics
- Region-specific metrics
- Ad network share of spend
- Which ad networks are growing fastest
- Best regional and vertical-specific ad networks
- And much more …
Plus, we also have some stellar contributions from data partners for this report, including:
- Adkiteev
- Aarki
- InMobi
- Appier
Ad spend changes: quarterly trends
There has been a ton of activity in the mobile ecosystem in early 2025. A few of the biggest changes include Apple being forced to open up third-party payments and tariffs rocking not just the offline world, but digital commerce as well.
Here are some of the key quarterly trends ad spend changes we see.
Note: this is normalized based on the year-ago quarter, so 100% is flat, under 100% is a drop, and over 100% is an increase.
Mobile game user acquisition spend is down, as is Shopping or e-commerce.
But by isolating US-only data, we can see that e-commerce app user acquisition ad spend is down massively: 44.9% year-over-year and 45% quarter over quarter. Again, this is normalized to the year-ago quarter:
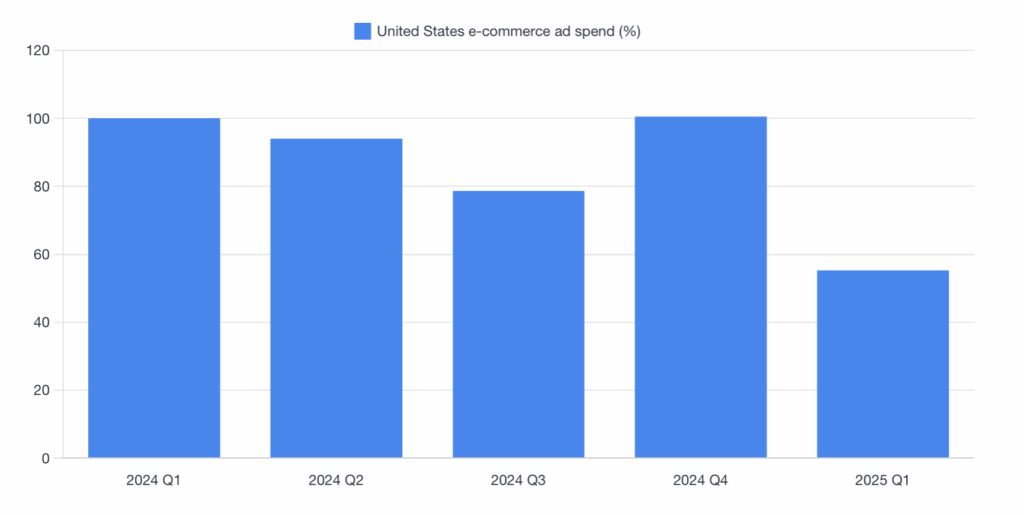
This makes sense, as others have noted. There are fewer dollars being pumped into retail app growth:
Temu dramatically reduced — and eventually stopped — spending on Google Shopping ads between April 9 and 12, 2025. Shein is following a similar pattern, having cut its Google Shopping ads investment on April 15.
In other words, Shein and Temu and others dropping ad spend because of tariffs and the revocation of the “de minimis” rules that exempted lower-value individual purchases from tariff impact is a real thing. Retail app user acquisition spend dropped massively this past quarter.
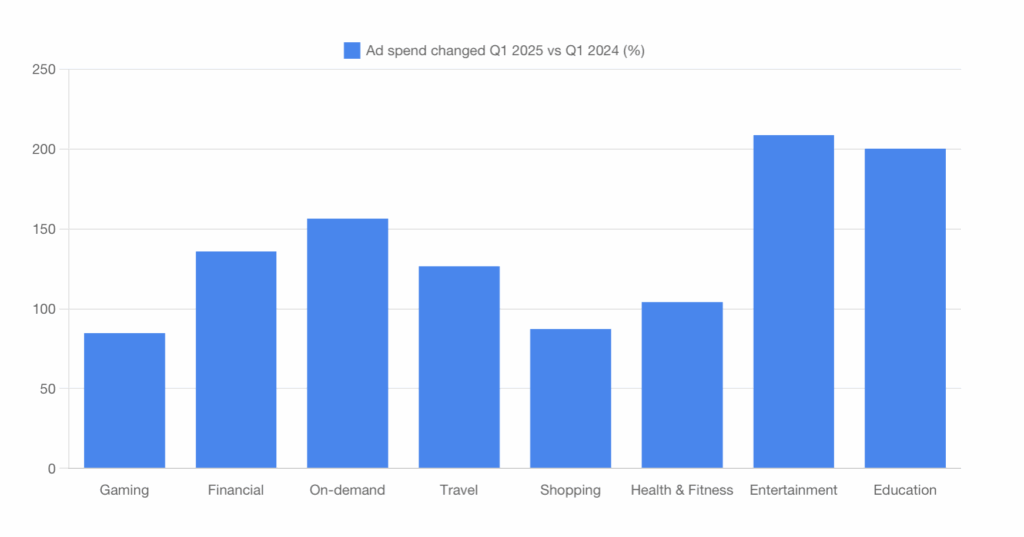
Overall ad spend is up though, especially Entertainment and On-demand
However, there are some highlights where ad spend is significantly up.
Fintech apps as well as the On-demand, Travel, Entertainment, and Education categories saw a boost in ad spend. The biggest was Entertainment, where ad spend more than doubled year over year. This is not shocking if you saw our recent top 10 entertainment apps post for key countries such as USA, Brazil, Japan, India, Germany, UK, and Korea: there’s an intense battle for subscribers here.
Education did as well, but it’s a much smaller category in terms of app installs and user acquisition spend.
Spend on On-demand app marketing was up 56% year over year: also impressive after years of growth already.
Overall, ad spend by Singular customers was up 40.3%, an impressive jump.
Hottest app and game categories
Year over year, Match and Puzzle games grew over 150% in popularity on Android. On iOS Action, Educational, Card, and Simulation games grew over 150%.
Interestingly, gambling games grew over 136% on iOS.
There’s an interesting dichotomy between Android and iOS in terms of most popular app categories right now.
- Android: On-demand apps rule
- iOS: Entertainment apps are tops
On-demand and travel are second and third on iOS; Entertainment is second on Android.
Plus, all the metrics updates
We’ve got the latest quarter trends data on ATT acceptance by vertical, plus global trends on CPI, CTR, CPM, and IPM.
TLDR: it’s getting more expensive to find new mobile app users.
We also break down a lot of these metrics by vertical and geo, focusing on the following regions:
- China
- Japan
- Rest of world
- Tier 1 East: Korea, India
- Tier 2 East: Taiwan, Indonesia, Turkey, Thailand, Philippines
- Tier 1 West: Canada, France, Germany, UK
- Tier 2 West: Australia, Mexico, Brazil, Spain, Italy, Netherlands, Poland
- United States
Get instant access to the Singular Q2 2025 Quarterly Trends Report
Get instant access to the new QTR.
Simply click here to get the QTR. We will ask for your name, email address, and a couple of other details.