
Available in: Portuguese
Introduction
Welcome to the 8th edition of the Singular Quarterly Trends Report! It’s jammed with data and insights about mobile, marketing, and everything else you need to know to contextualize your app’s results and strategize for tomorrow’s growth.
Use the section links at left to discover what you’re most interesting, and bounce around the report as you need.
A few highlights that you’ll find below …
- Global ad spend was up 45% quarter over quarter as measured by Singular
- All key metrics — CPI, CPM, CTR, and IPM — were up as well
- Android ads drive almost 3X more installs per impression than iOS
- CTR ballooned by 38.6% globally (and we share why)
- CPMs went up more than CPIs: good news for ad monetized apps
- CPIs were up almost 15% in the U.S.
- Fintech CPIs jumped almost 80%
- Targeting is improving: IPM was up 11.3% across the board
- Top 10 ad network share-of-spend gainers
- Rewarded ad networks continue to grow
- Hottest game genres (and what changed)
- Hottest app verticals (and what changed)
- ATT opt-in rates by vertical
- And much more …
Below you can also search and filter for key KPIs by vertical and geo, get a deep dive on CPIs across all the regions, and check the platform trends for monetization by iOS and Android across 10 different verticals.
We also have contributions and insights from a number of partners:
- AppMagic: Gaming trends
AppTweak: CPP conversion rates
Persona.ly: A Cohort-driven framework for incrementality - Jampp: CTV surge
- YouAppi: display banners surprise
Enjoy!
As always, data in this report is based on a significant slice of Singular’s data:
Author: John Koetsier
Data scientist: Gaston Laterza
Global ad spend trends are up
We are back in the black: after being down QoQ in Q1 — not surprising following the holiday quarter — ad spend is up significantly in Q2 2025.
Year over year, we’re seeing modest but still significant growth of 7.6%.
Quarter over quarter the numbers are more impressive:
- Up 45% globally QoQ
- Up 30% on Android
- Up 51.2% on iOS
There’s strong growth quarter over quarter across almost all of the globe:
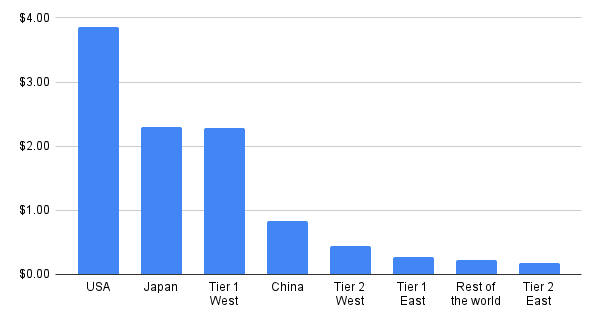
Ad spend growth by region: Q1 >> Q2
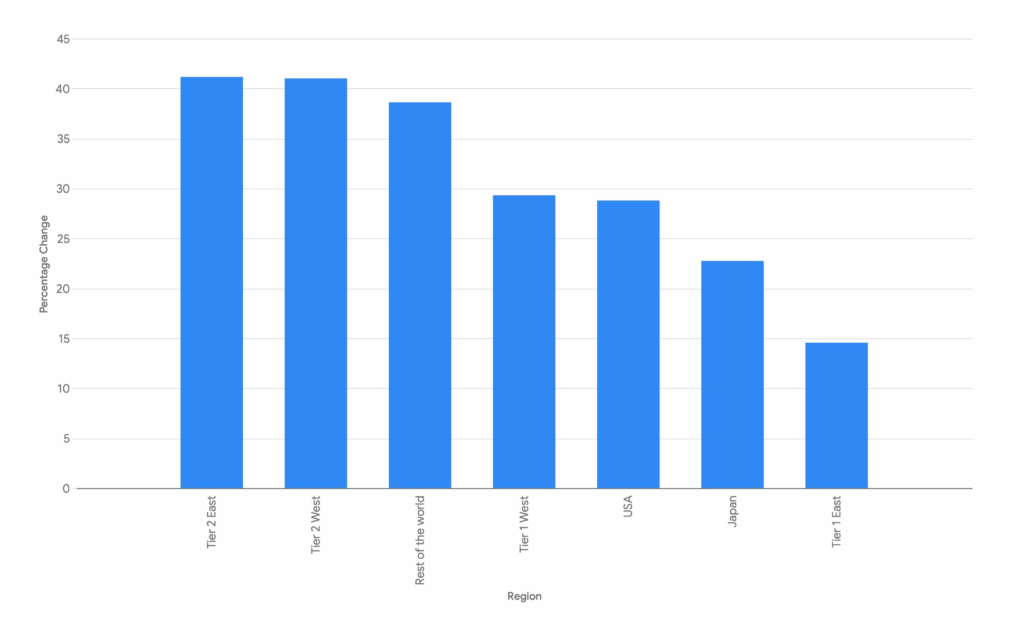
The bulk of the increase in absolute terms is in the United States even though the percentage growth is not as high as some of the other regions.
But the strongest proportional growth is coming from Tier 2 markets, both East and West, showing emerging regional investment in mobile user acquisition.
This includes our “Rest of the World” category, which is up 38.6%.
ATT and IDFA availability
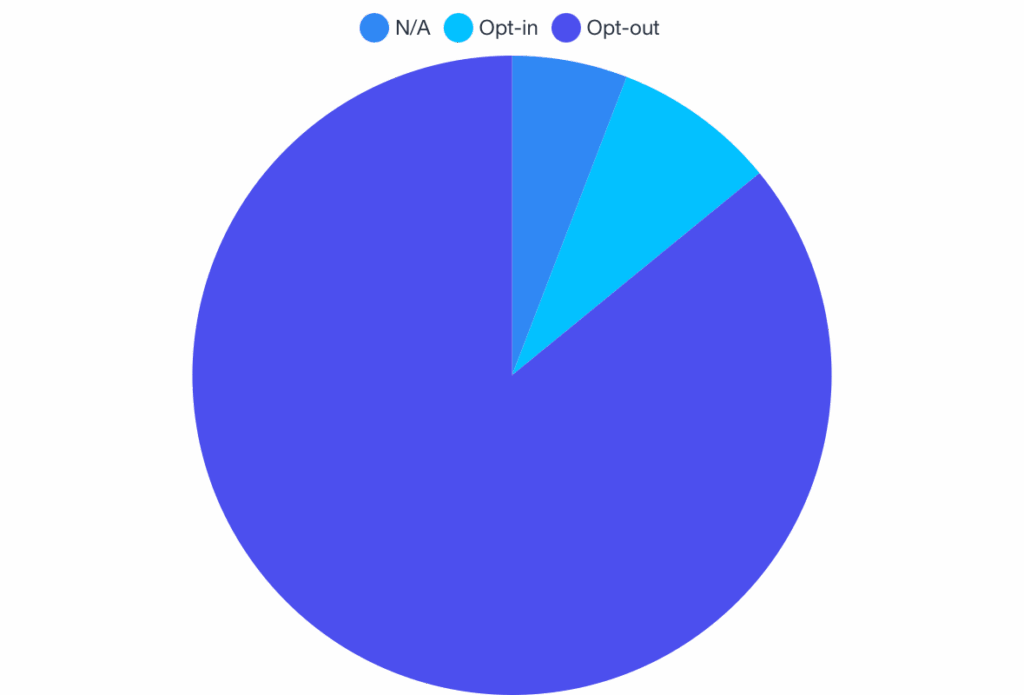
Almost everyone either opts out of tracking via the App Tracking Transparency prompt or is not eligible for even being asked, like children or managed devices.
Global opt-in rates
Only 8.26% of people globally opted into tracking:
Global opt-in
Opt-in rates by vertical
Opting out of ATT dominates every vertical, but especially Shopping and Travel:
- Shopping: 97.3% opt out
- Travel: 97.8% opt out
Opt-in rates by vertical

Utilities has the highest opt-in rate, at 34.2%, while Gaming is also high at 21.68%. (Gaming also has a lot of kids installing new games, which explains the rather large opt-out percentage here.)
Interestingly, both Education and Finance have significantly higher-than-average opt-in rates as well.
Clearly, for sensitive use cases like payments, travel plans, and purchases, people see less benefit to opt in to tracking. Gaming’s higher opt-in probably reflects both a value exchange along the lines of rewarded ads and personalized experiences and a younger, less privacy-focused audience.
Key metrics and trends: CPI, CTR, CPM, IPM
Big picture
Everything was up in Q2 2025: CPI, CPM, CTR, and IPM.
All platforms, all verticals
CPI
$1.80 (up 15.4%)
CPM
$4.16 (up 28.4%)
CTR
5.6% (up 38.6%)
IPM
2.3 (up 11.3%)
CPI by platform
When you differentiate by platform, it’s clear that CPIs really only changed this past quarter on iOS.
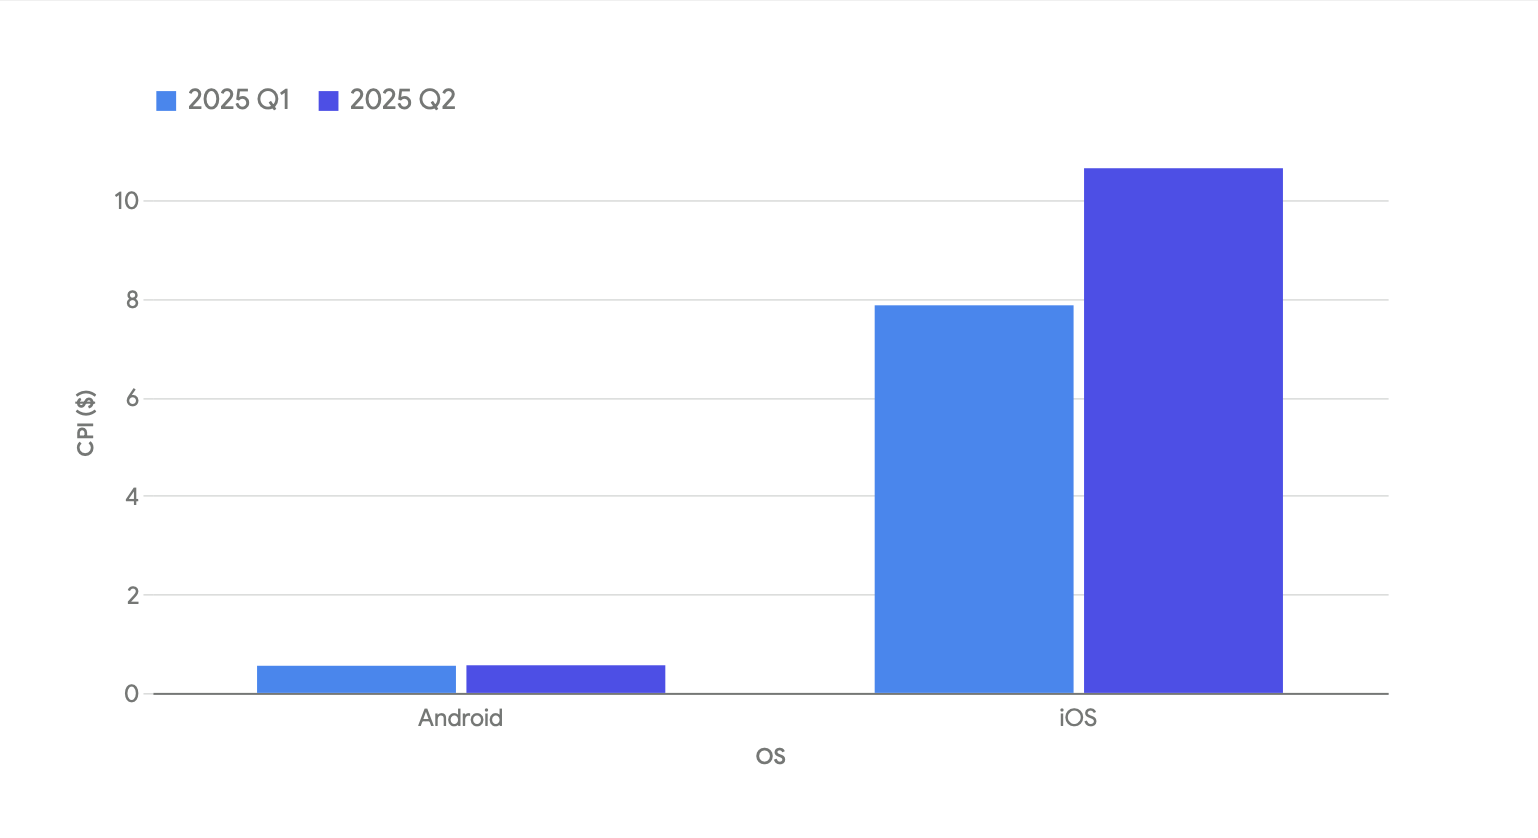
Change per platform:
- Android CPIs: up 1.6%
- iOS CPIs: up 35.4%
Obviously there’s a massive change on iOS. See below for more details in our CPI Deep Dive, but briefly fintech, gaming, and retail user acquisition was significantly more expensive in Q2 than it was in Q1.
CPM by platform
There’s good news for app publishers who monetize via ads.
While CPIs only went up 15% on average, CPMs went up 28.4%. That means your cost of user acquisition rose marginally, but your opportunity for monetization increased almost twice as much.
CPM: Android vs iOS
But they didn’t go up evenly:
- Android CPMs: up 9%
- iOS CPMs: up 50.7%
That looks unfortunate for Android, but if you look at the CPI data above, Android apps are actually comparatively better off: CPMs are up 9% and CPIs are up only 1.6%.
For iOS, CPIs went up a hefty 35.4%, and while CPMs were up over 50%, they didn’t rise by nearly the multiple that Android CPMs did.
CTR by platform
CTR saw the biggest change in the key big metrics: up a massive 38.6%.
Building on a QoQ jump in Q1 of 17%, this is yet another nail in the coffin of CTR as a metric, at least in the way we once used it. It still has usability, but now you can only safely use it as a very relative comparison between similar campaigns with similar ad types.
Looking deeper, however, this isn’t about CTR per se.
Rather, it’s about iOS. And primarily 1 vertical.
Check out CTR on Android versus iOS for the first half of this year:
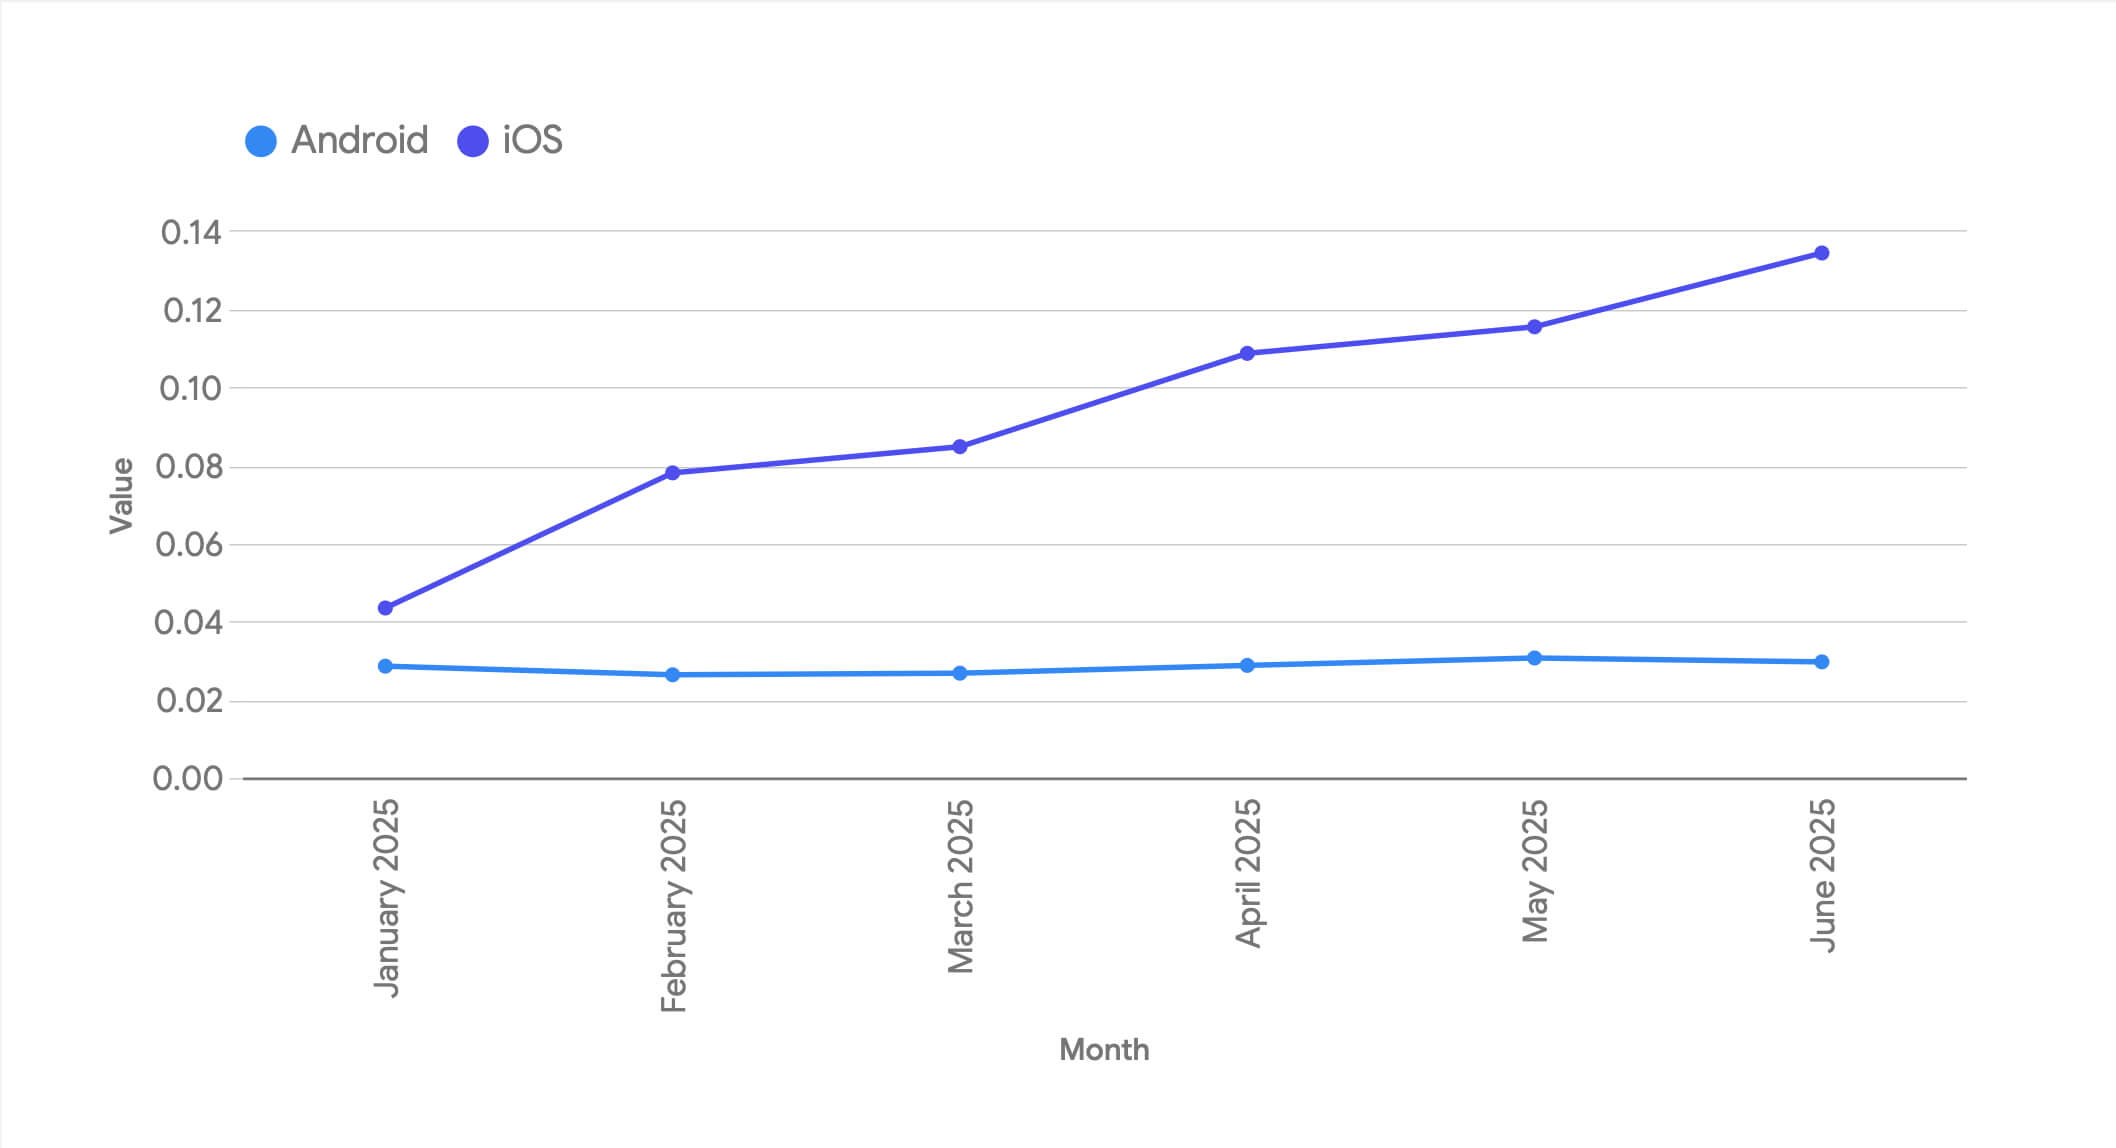
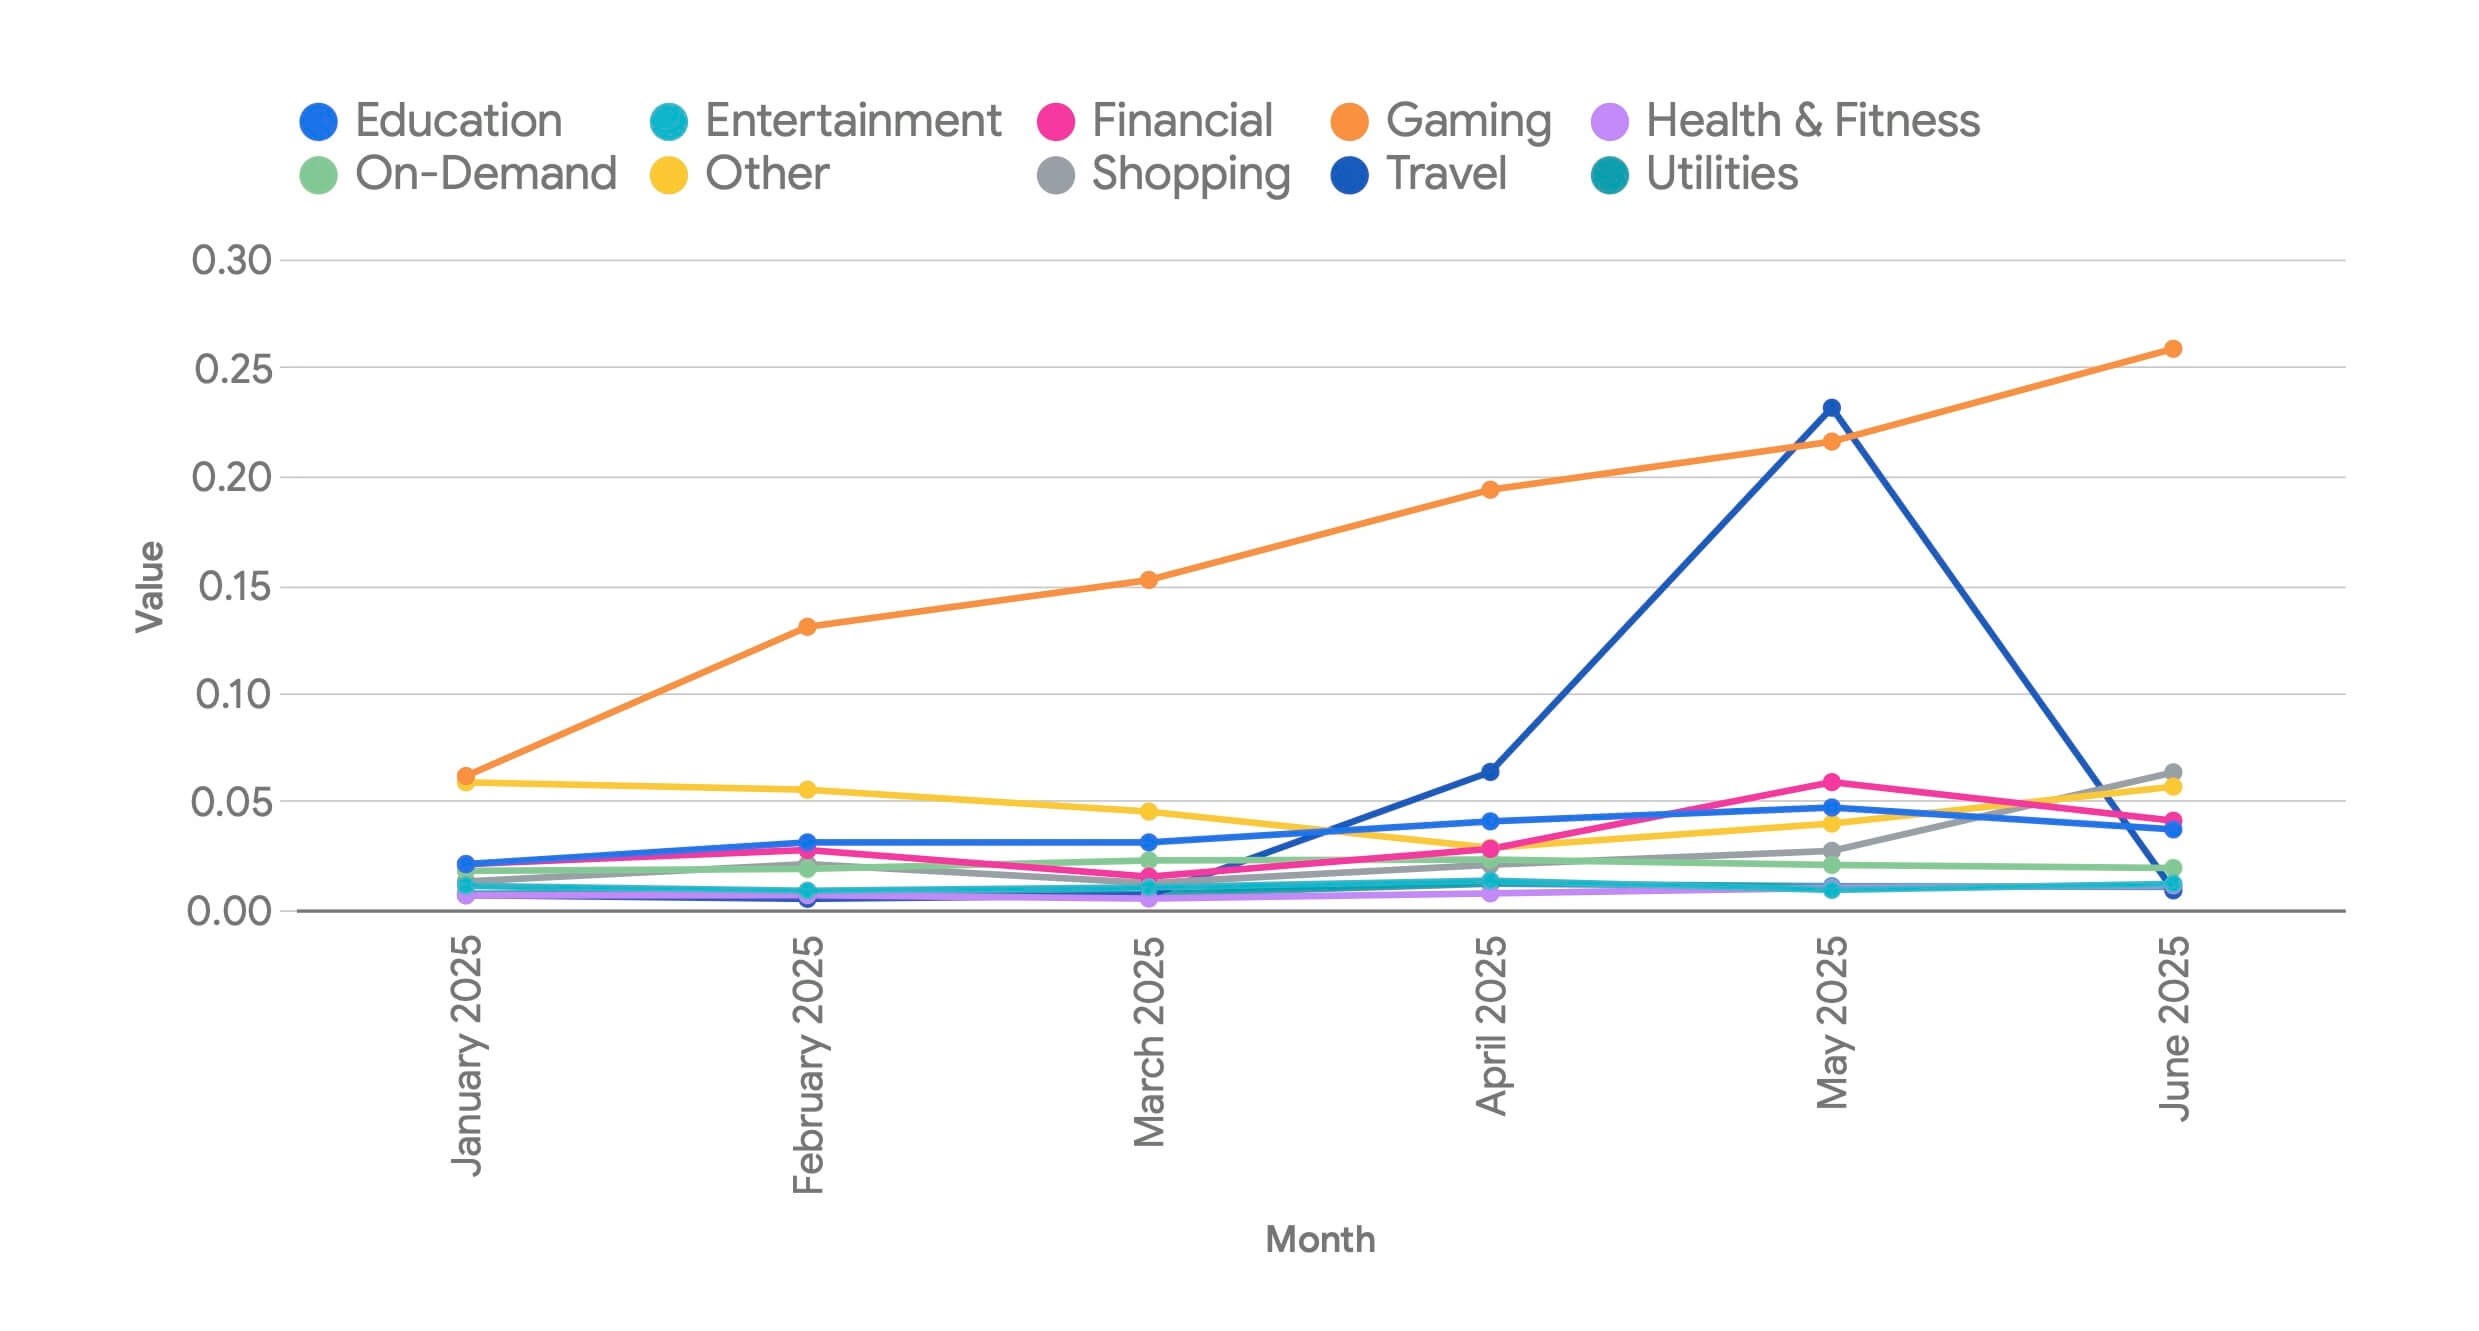
Specifically the massive jump in CTR is about Gaming.
If we just look at iOS and segment by Vertical, we see that Gaming CTRs basically exploded in Q2 2025.
(Travel rocketed up too, but then dropped off. It’s a much smaller vertical than Gaming, so wouldn’t have impacted the overall iOS CTR rates nearly as much. I’m also checking if there was a glitch in the data here, or 1 large advertiser who skewed the results.)
Veterans in mobile marketing know what’s going on:
- Games use a lot of playables and hybrid video/playable/end card ads
- iOS offers SKOverlay: a lightweight App Store app listing view right inside an ad in 3 varieties:
- Compact banner version (bottom of the screen)
- Larger card modal (almost full screen)
- App Clip version
- You can tap away from a playable, but it’s often hard
- Early taps, or taps that miss the X, often result in a “click”
- This can happen multiple times in a single ad unit
- Voila: CTR rates are through the roof
Here’s an example of SKOverlay (the A version) in an image from Liftoff:

Android Utilities … CTR oddity
While iOS Gaming is the bulk of the change, there’s an interesting thing going on for Android, specifically in Utilities, as well.
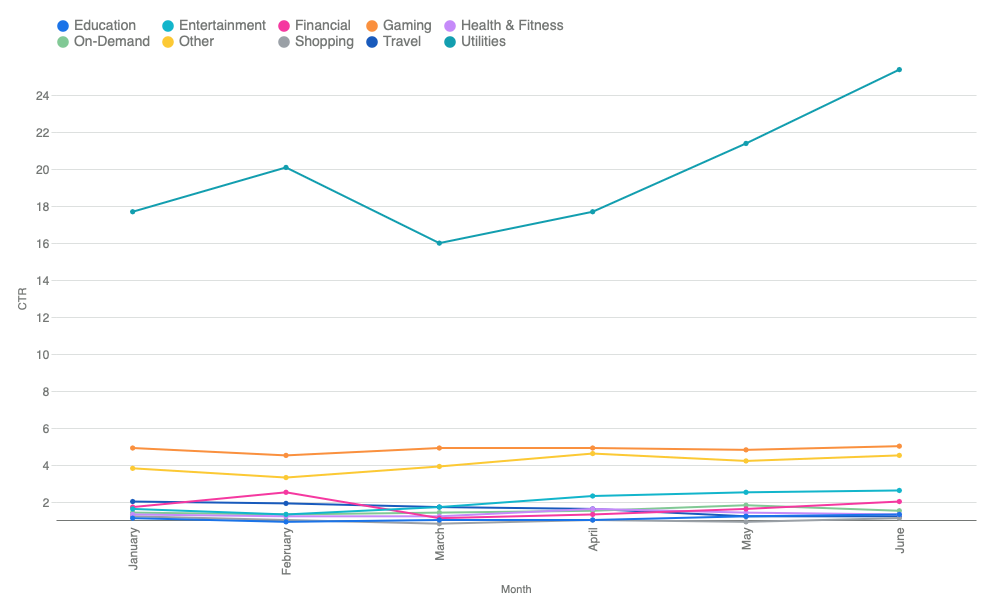
Most verticals are fairly normal for CTR on Android. Gaming is 3X to 5X higher than other verticals, but not off-the-charts higher.
- Android Gaming CTR: ~5%
- Android Shopping CTR: ~1%
- Android Entertainment CTR: ~2%
But Utilities starts the quarter high, at 17.7%, and finishes much higher, at 25.4%.
(Note: Utilities on iOS has the highest ATT opt-in rates, and Utilities are sometimes trojan horses for data collection or other shall we say grey hat activities … so there could be something more “interesting” going on here.)
IPM by platform
IPM was up across the board in Q2, suggesting that ad networks, advertisers, and app publishers are getting better at putting the right ads with the right messages in front of the right people.
By platform, this increase parses out to:
- Android IPMs: up 7.3%
- iOS IPMs: up 11.3%
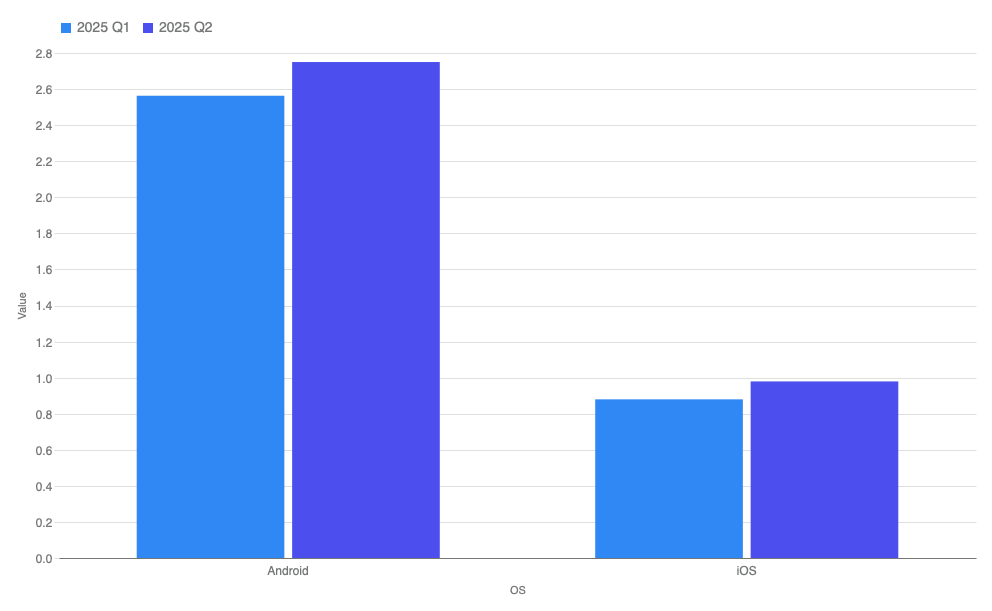
Overall IPM per platform in Q2 was:
- Android: 2.75
- iOS: .979
IPM is a good indicator of advertising efficiency and user experience. The higher the installs per thousand ads shown, the lighter ad load is required to deliver similar results for advertisers.
The fact is that Android ads are driving almost 3X more installs per impression than iOS. (And yes, this relationship holds even if we look at a specific richer country, the United States.)
That means 1 of 3 things:
- Ads are less efficient on iOS
- iOS users are more adblind, or resistant to marketing
- Or … both
It’s worth noting that Android advertisers still have access to behavioral signals from device identifiers (GAID) while iOS advertisers have to depend on less reliable signals.
All of that said, while iOS has lower IPM, Apple customers often have higher LTV, so advertisers essentially are forced to accept lower marketing efficiency in exchange for higher financial returns.
Key KPIs by country tier and vertical
At Singular, we look at data by regions:

Note that this is Android-only data except for N/A, which is global iOS data.
High-level insights: verticals
- Utilities
Of all verticals, Utilities has both the highest CTR and the best IPM. With cheap CPI and strong CPM, apps in this space are efficient value generators. - Travel
Travel apps tend to have high IPM and high CVR. That indicates strong intent-driven installs: people get these apps with immediate action in mind. - Financial
Fintech is a tough space to grow. CPIs are sky-high, and IPMs are tiny. Acquiring financial users is expensive and has lower conversion rates. - Shopping/retail
Shopping apps have the second highest CPI among verticals and unimpressive IPM, meaning this is a competitive growth space with expensive acquisition. Shopping CVR is lower than most service-oriented verticals, but slightly higher than Financial. Upshot: Shopping ads attract clicks but convert only moderately … there’s a lot of digital window shoppers.
High-level insights: geos
- USA
Expensive but strong conversion efficiency: highest CPM and high CPI, but also the best IPM. - Tier 1 West (Canada, UK, France, Germany)
High cost, but weaker conversion efficiency than the USA. - China
Lots of volume, but low conversion rates with very low CPM … but also the lowest IPM. - Tier 2 West: (Australia, Mexico, Brazil, Spain, Italy, Netherlands, Poland)
Low CPM but strong IPM, so we’re seeing efficient installs at lower cost, potentially making these good ROI markets. - Japan
High CPIs with mid-level IPMs make Japan a balanced but premium market. - Tier 2 East: Taiwan, Indonesia, Turkey, Thailand, Philippines
Low CPI and strong IPM make these countries very cost-effective growth markets.
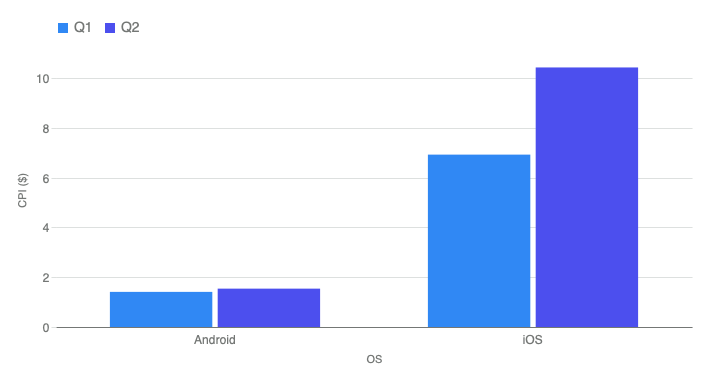
Deeper dive: CPI
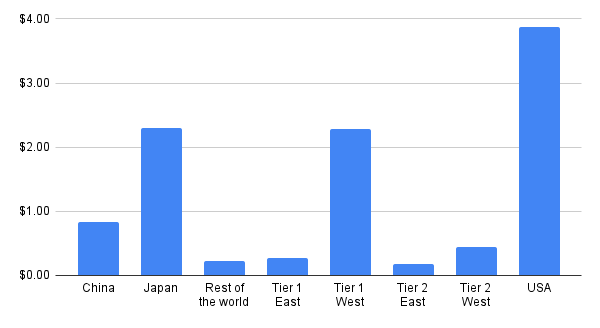
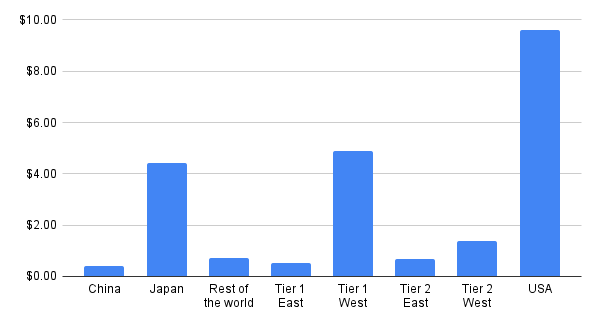
CPI by region
As you’d expect, CPI is highest in the United States. Japan and Tier 1 West countries are almost equivalent, followed by China.
What changed this quarter?
- CPI is up 14.7% across the board in the United States
- CPI is up 21.1% in Tier 1 West countries
- CPI is down 52.9% in China
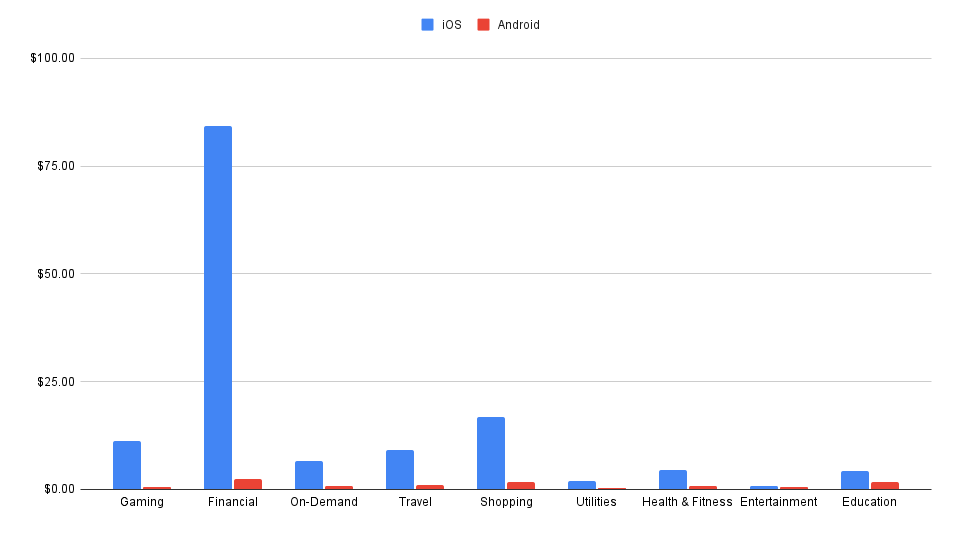
CPI by app vertical
It’s relatively unrevealing to look at CPI by app vertical when you include Financial in the mix: fintech dominates the chart and the other categories are almost invisible.
What this reveals, however, is that fintechs will pay more than 5X higher for new customers than any other vertical, making finance an incredibly rewarding vertical for ad monetization.

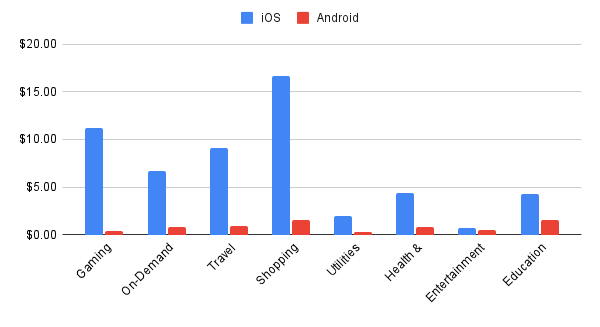
If we remove fintech to get better insight into the other categories, here’s what we see:
- Shopping is expensive
- Gaming is expensive
And, in general, iOS is vastly more expensive than Android … with the very significant exception of the Entertainment category.
CPI by app vertical, without fintech
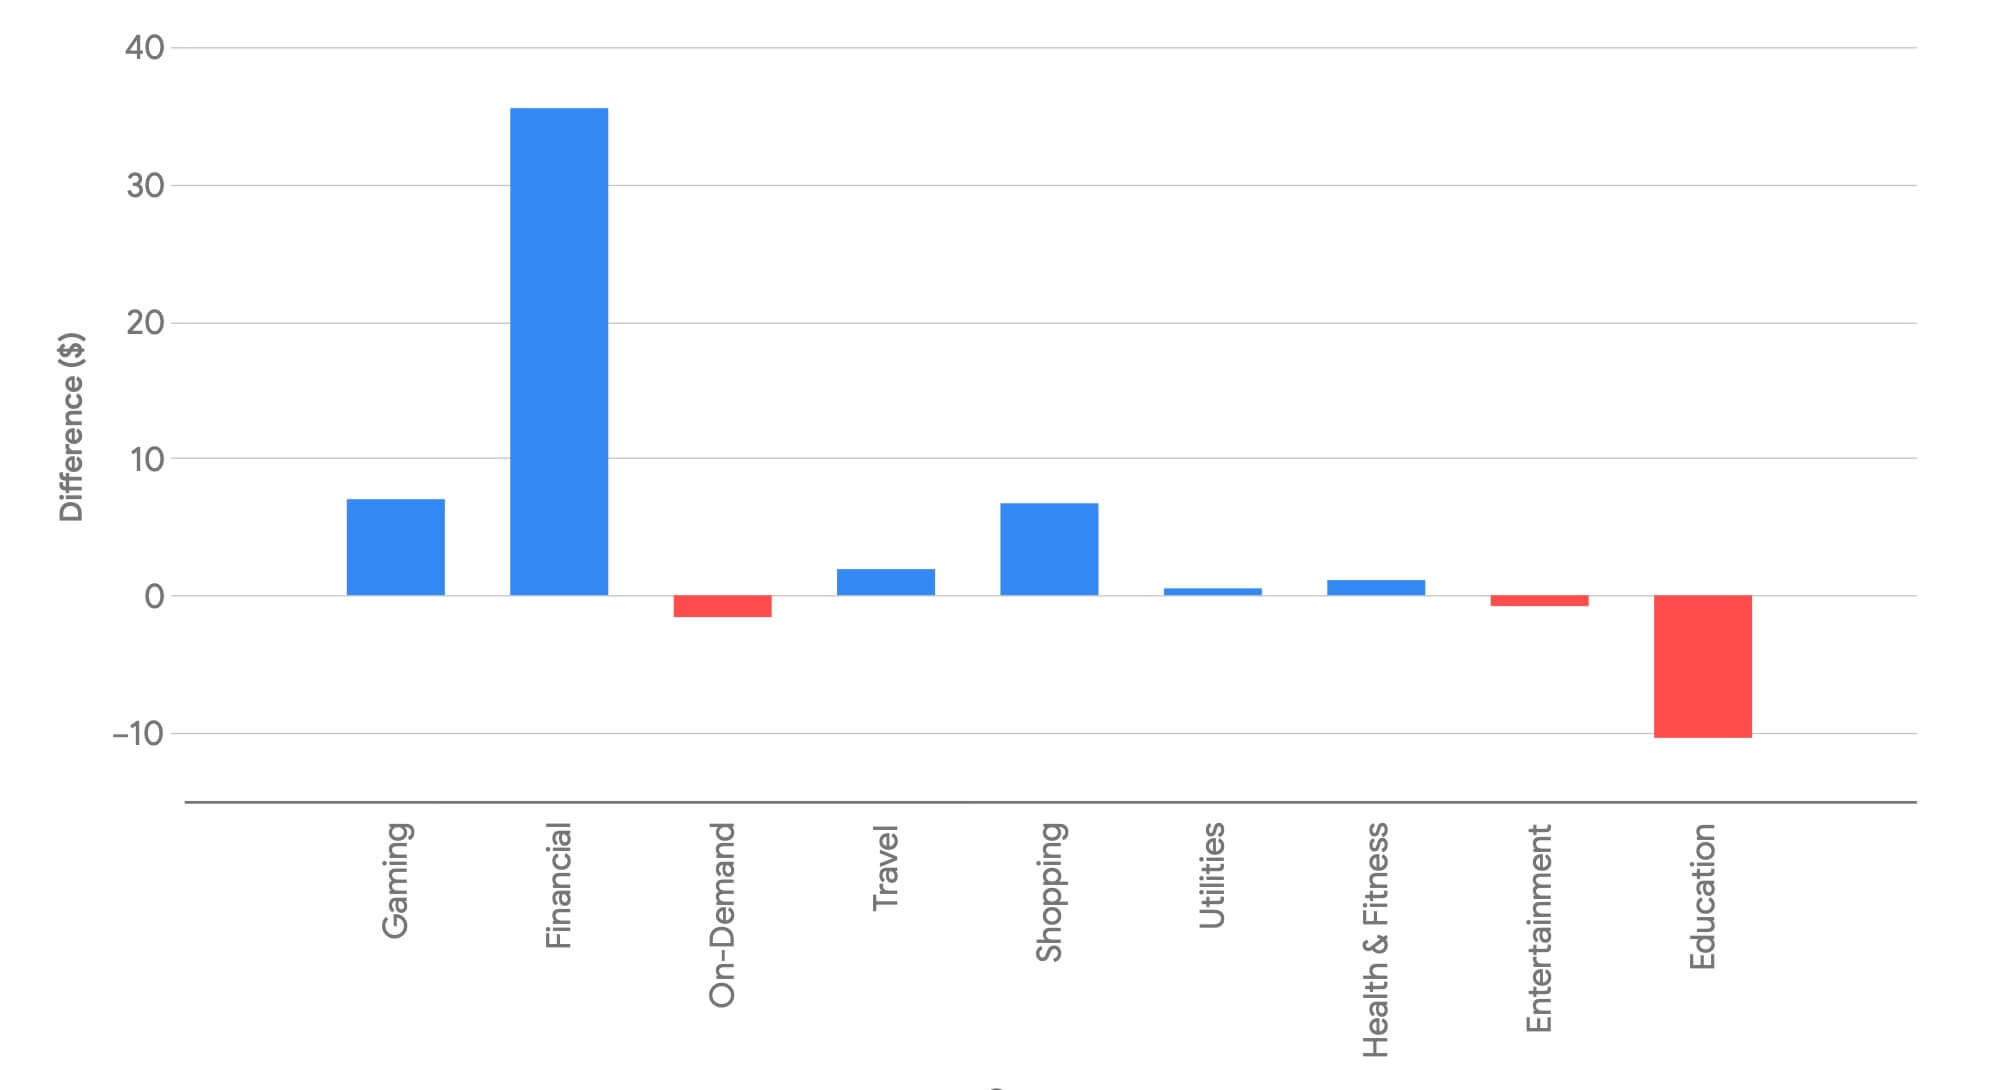
The real story is in the changes, however, and they’re almost entirely driven by user acquisition in the United States:
- Fintech CPIs jumped $35, increasing 78%
- Gaming CPIs jumped even more, percentage-wise: 166%
- Shopping CPIs were up 67%
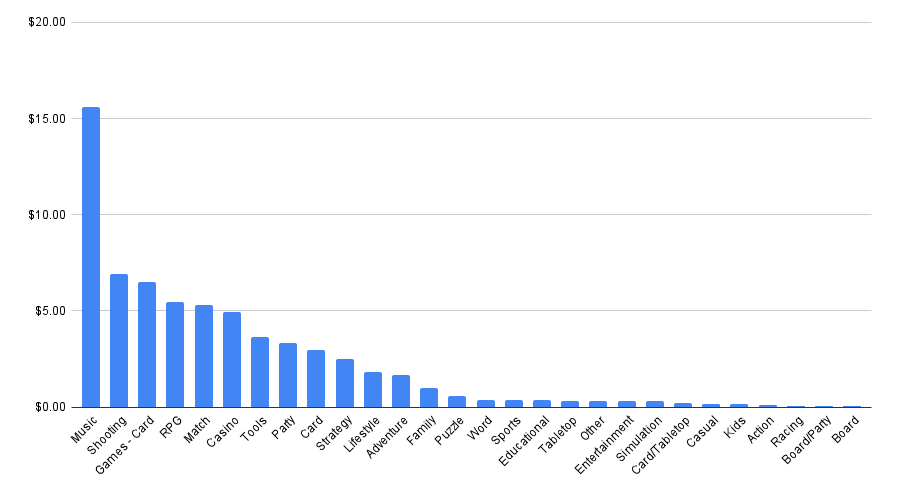
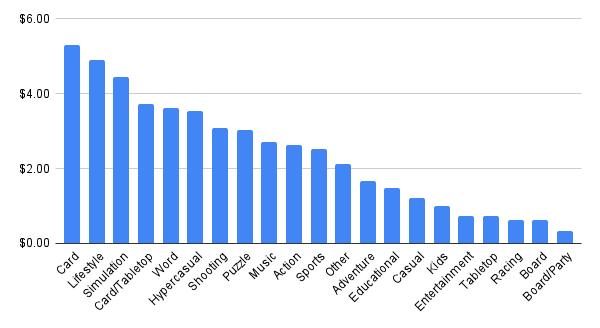
CPI by game genre
Finding new players for Music games on Android is challenging, with the highest UA prices on the platform, followed by Shooting and Card Games.
On the iOS side, Card, Lifestyle, and Simulation lead the way:
More key metrics by region: CPI, CTR, CPM, IPM
At Singular, we look at data by regions:
Note: all of the below data is based on Android only.
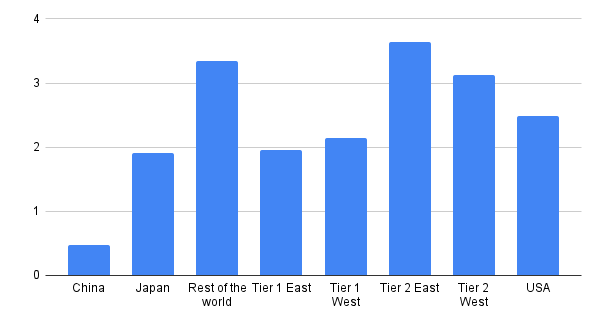
CPI by region
CPM by region
CTR by region
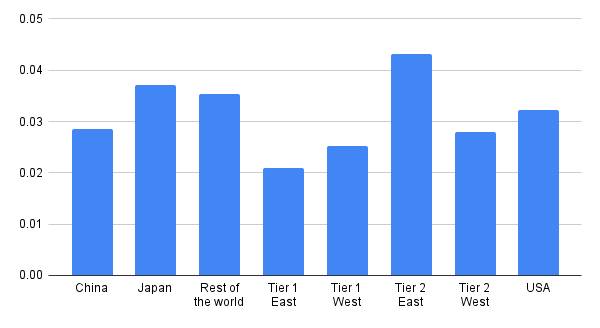
IPM by region
Monetization trends: iOS vs Android
Android is the platform of scale. iOS is the platform of revenue.
That’s an oversimplification, of course, but it’s also the inescapable conclusion of seeing the revenue vs installs data for key verticals on Android and iOS:

Highlights to note:
- Gaming is completely inverted
- Installs: Android 89.8% vs iOS 10.2%
- Revenue: iOS 87.2% vs Android 12.8%
- On-Demand apps generate more money on iOS despite fewer installs (both proportionately and to a much larger degree absolutely)
- Installs: Android 87.7% vs iOS 12.3%
- Revenue: Android 38.2% vs iOS 61.8%
- Shopping is an iOS revenue powerhouse
- Installs: Android 79.3% vs iOS 20.7%
- Revenue: iOS 82.3% vs Android 17.7%
- Health & Fitness and Education are iOS-dominated in revenue
- Health & Fitness installs are balanced (Android 50.9% vs iOS 49.1%), but revenue is 93.5% iOS
- Education installs are split (51.1% Android vs 48.9% iOS), but revenue is 82.2% iOS
- Fintech is a prominent exception to the trend: installs skew to Android, but revenue to Android too
- Entertainment is perhaps the most balanced vertical
- Installs: Android 72.5% vs iOS 27.5%
- Revenue: Android 67.2% vs iOS 32.8%
Ad network share of spend: biggest winners
We saw some consolidation at the top for ad network winners from Q1 to Q2. We also saw a shift towards performance DSPs.
Gainers: absolute growth
In terms of absolute share gain, here are the top 10 winners for Q2:
1

2

3

4

5

6
7

8
9

10
Gainers: percentage growth
In terms of percentage growth, here are the top 5 gaining ad networks:
- Jampp
- AppSamurai
- Buzzvil (a Korean adtech conglomerate)
- Mega Fortuna (a rewarded/loyalty player in gaming)
- Persona.ly RTB
Jampp appears on both lists, thanks to a massive jump in spend by Singular customers.
Gainers by platform
If we look at gainers by platform, some differentiation emerges. This is by percentage growth, which is why you don’t see Apple below, in spite of some reasonable absolute growth by Apple Ads.
iOS
Android
1
2
3
4


5

6


7

8

9

10


Rewarded ad networks continue to grow
Look at those names in the lists above …
These are rewarded or incentivized ad networks that were among the fastest growing ad networks in Q1, and they’ve continued the momentum in Q2.
Ad network heatmap by vertical
It’s interesting to look at ad network share of spend by vertical:
Ad network share of voice
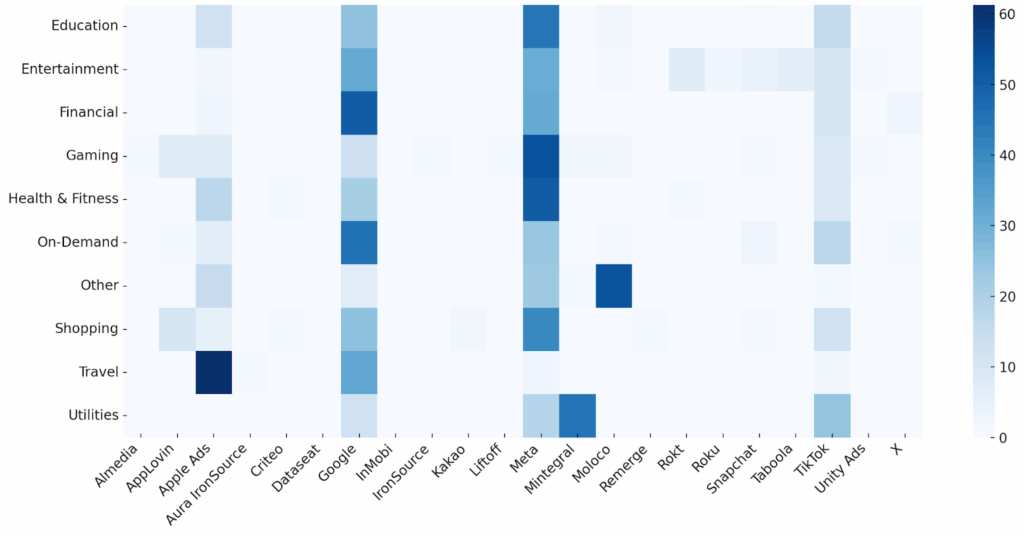
Some of the insights are fairly obvious:
- Meta and Google are consistently top networks across multiple verticals
- TikTok is regularly a top 3 player … especially in verticals with younger or entertainment-oriented audiences
- Apple Ads has a significant presence, even though it’s iOS-only
- Networks like Snapchat, Moloco, AppLovin, and Rokt appear as top performers in specific niches
For the non-SAN ad partners, here’s what we’re seeing as areas of strength:
- AppLovin: Shopping, Gaming, On-Demand
- Almedia: Gaming, On-Demand
- Moloco: Other, Gaming, Shopping
- Mintegral: Utilities, Gaming, Entertainment
- Rokt: Entertainment, Shopping, On-Demand
- Taboola: Entertainment, Shopping, On-Demand
- IronSource: Gaming, Entertainment
- Liftoff : Gaming, Shopping
- Remerge: On-Demand, Shopping, Financial
- Kakao: Entertainment, Other
- Criteo: Shopping, Financial
Hottest game genres
Key findings:
- Simulation games are the top category on both Android and iOS
- Sports is nearly twice as popular on iOS: 19.8% vs 9.3%
- Kids and Party games over-index on iOS
- Kids: 9.3% vs 4.8%
- Party: 5.6% vs 1.2%
- More niche genres vary: RPG is much bigger on iOS, proportionately, than Android, for example
Android is more action heavy and more focused on pick-up-and-play experiences as well as high-intensity gaming. iOS trends to Sports, Kids, Party & Puzzle type games, with a stronger tilt toward family, social, and strategic gameplay.
Android games
The most popular game genres globally for Android are Simulation, Action, and Puzzle, again. (Just like last quarter.)
Android games: top genres

The fastest-growing game genres for Android are:
- Tabletop
- Match
- Word
- Sports
- Kids
- Lifestyle
- Gambling
- Casino
- Card/tabletop
iOS games
The most popular game genres globally for iOS are Simulation, Puzzle, and Sports, followed by Kids and Action games.
iOS games: top genres
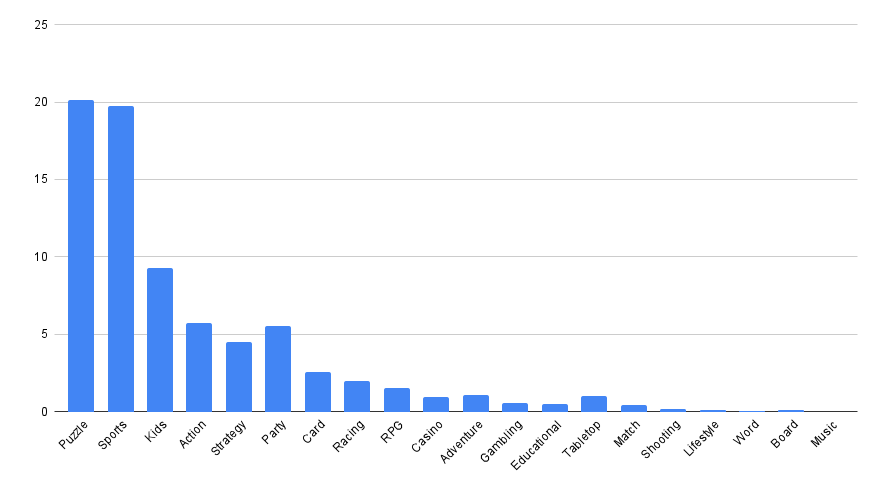
The fastest-growing game genres for iOS are:
- Shooting
- Tabletop
- Match
- Adventure
- Party
- Sports
- Board
- RPG
- Lifestyle
- Music
Hottest app verticals
Key findings:
- Android users are far more focused on On-Demand services: 51.7% vs 37.5% of downloads
- iOS has nearly double the share of Entertainment downloads compared to Android: 36.6% vs 18.6%
- Travel is relatively bigger on iOS: 7.8% vs 3.8%
- Android has a slightly higher share in financial services
- iOS slightly over-indexes in Education and Health & Fitness
Android app installs trend to functional and service-oriented verticals. iOS trends to more lifestyle and discretionary verticals.
Overall, the fastest growing verticals are On-Demand, Entertainment, and Shopping.
Android verticals
The On-demand and Entertainment verticals captured literally 70.3% of all the downloads Singular measured on Android (apart from games, of course).
Note that while the Financial category is nowhere near the size of either of those categories, it’s CPIs can be 10X higher, as we saw earlier.
Android apps: top verticals
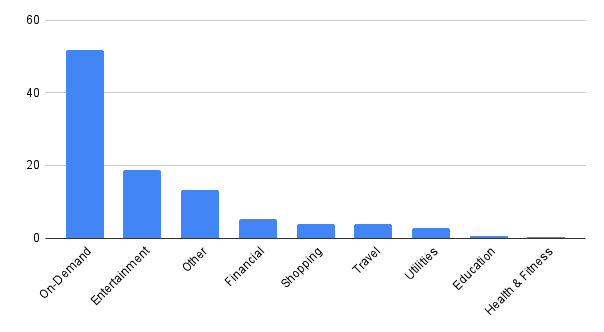
The fastest-growing app verticals for Android are:
- Utilities
- Shopping
- On-Demand
- Entertainment
- Other
- Gaming
iOS verticals
iOS is even more concentrated, with 74.1% of all installs in the On-demand and Entertainment categories.
iOS apps: top verticals
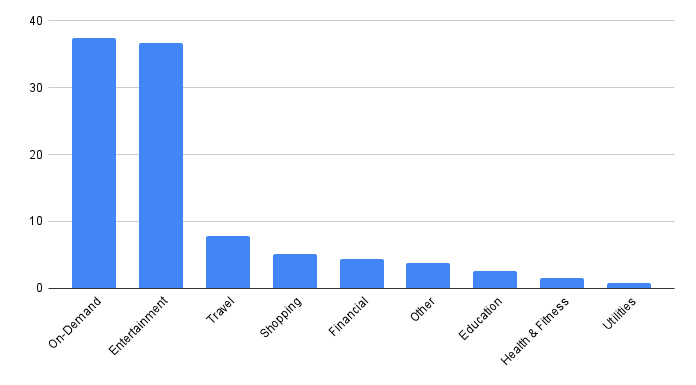
The fastest-growing app verticals for iOS are:
- On-Demand
- Health & Fitness
- Entertainment
- Gaming
- Travel

Also see: Singular ROI Index 2025
We recently released the Singular ROI Index 2025, where we dive deeper into ROI by ad networks.
This year’s Index includes:
- Top-performing ad networks by ROI, scale, and growth
- The Singular ROI Quadrant: where value meets volume
- Breakout platforms like Moloco, Liftoff, Reddit, and Apple Search Ads
- First-ever ability to filter results by geo and app categories
- Insights into the rising wave of rewarded ad networks
Based on billions in ad spend, tens of billions of app installs, and trillions of ad impressions, the Singular ROI Index is the longest-running and most comprehensive ROI-focused adtech report for the mobile space.
Contributions from partners
AppMagic: game trends and top LiveOps trends
We continue to see significant developments in gaming. Here’s what we’re seeing in some key gaming subgenres:
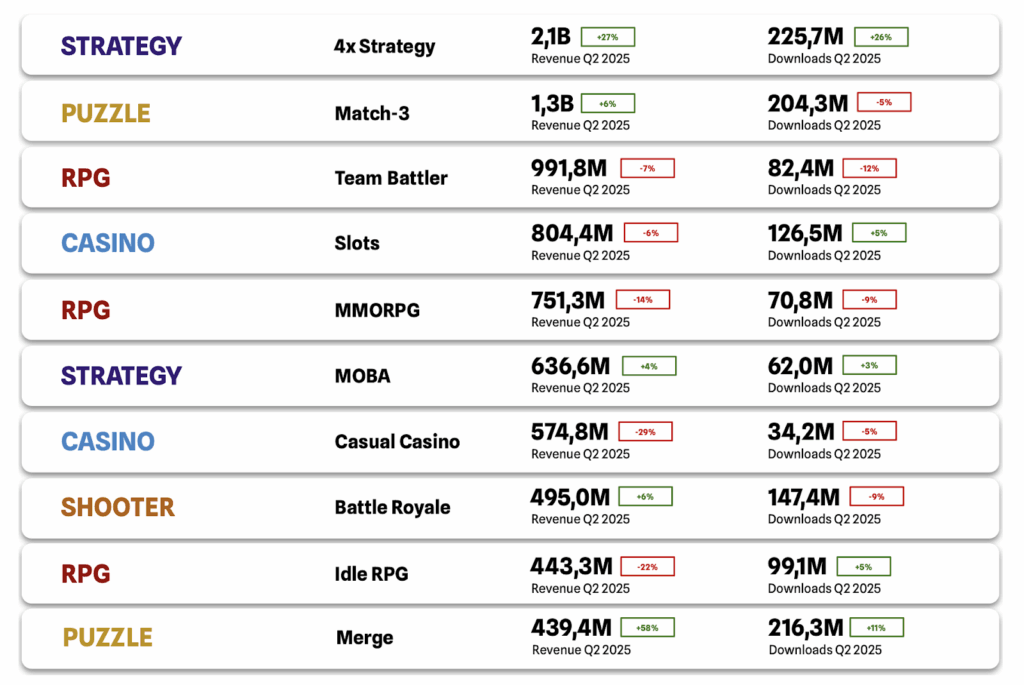
The Casino niche was the only one among the top three to show a decline in revenue. This drop was primarily driven by the continued month-over-month decrease in revenue from major Casual Casino title MONOPOLY GO!, as well as from key players in the Slots segment such as Slotomania™ Slots Casino Games and Jackpot Party – Casino Slots.
Despite the significant decline, all of these titles still maintain leading positions in terms of overall revenue.
The 4X strategy market continues to grow actively.
At first glance, this is largely driven by titles like Last War: Survival and Whiteout Survival. However, even without these blockbusters, the niche has seen the emergence of notable new projects such as 三国:谋定天下, Dark War: Survival, and Top Heroes: Kingdom Saga. While these newer titles currently hold a smaller share of the niche’s revenue, they are continuing to develop and expand steadily.
The Merge niche has shown steady month-over-month growth, primarily driven by Merge-2 titles released before 2024, such as Gossip Harbor®: Merge & Story, Seaside Escape®: Merge & Story, Merge Cooking®, and others.
At the same time, some Merge-3 titles, such as Alice’s Dream: Merge Games, have experienced a noticeable decline in revenue.
Here are the fastest-growing subgenres year-over-year:
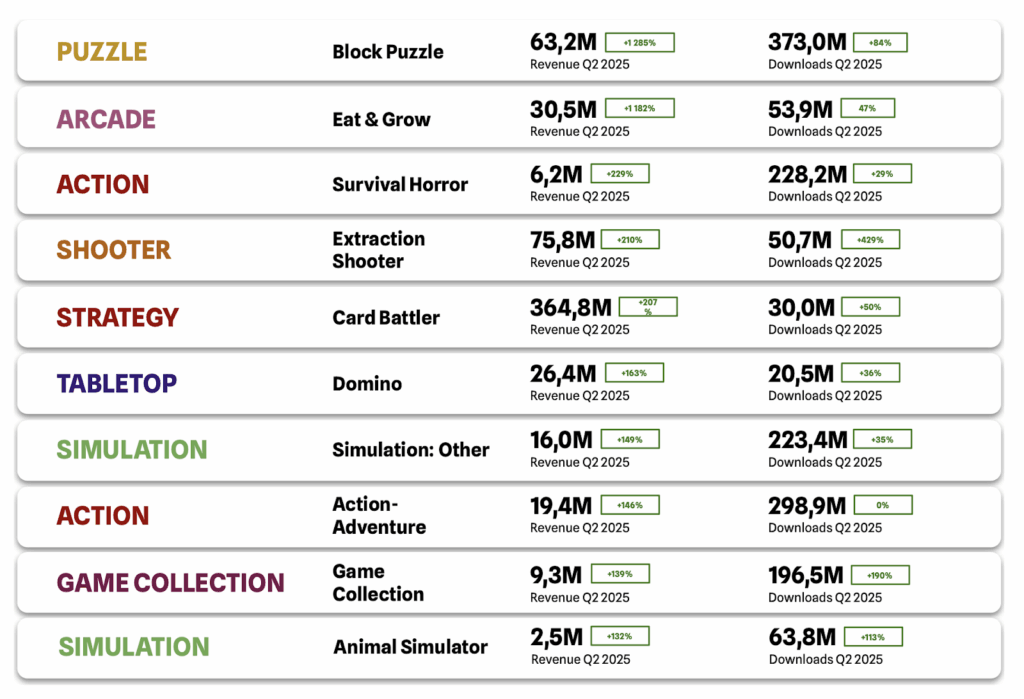
The strongest growth was in the Block Puzzle niche, with a 1.3% increase in revenue compared to the previous quarter. The main driver behind this surge was Color Block Jam, although other titles like Wood Away, Crowd Express: Boarding Puzzle, and Screw Block Escape also contributed to the growth.
The Eat & Grow niche also showed strong revenue growth of 1.2%, driven by titles such as All in Hole, Hole Em All: Black Hole Games, Hungry Shark World, and others.
This significant growth in both niches is no coincidence. A trend has been emerging for some time now: simple games are becoming increasingly sophisticated in both gameplay mechanics and monetization. Niches like Block Puzzle and Eat & Grow are clear examples of this evolution.
The growth of many other niches was driven by standout individual titles: 超自然行动组 (Survival Horror), Delta Force (Extraction Shooter), Shadowverse: Worlds Beyond (Card Battler), and Domino Dreams™ (Domino).
Simulation: Other, a subcategory within Simulation for games that are difficult to classify precisely, showed significant revenue growth, driven by titles such as 时光杂货店-王宝强推荐, Mission Chief – Fire Fighter, 我的休闲时光, Food Stylist – Design Game, and 桃源深處有人家 – 咖波聯動中.
This trend points to a growing interest in the niche and the emergence of new games with unique and unconventional mechanics that don’t yet fit into existing subgenres.
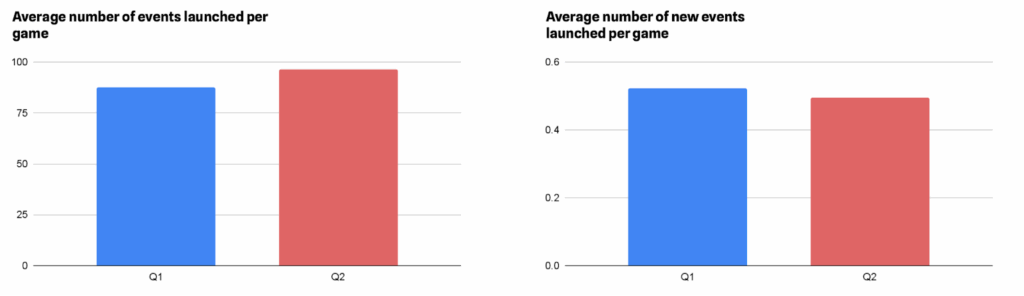
LiveOps trends in casual games
The second quarter of 2025 showed a significant increase in event density, with an average of 10% more events launched per game compared to the first quarter of 2025.
This growth primarily relates to the relaunch of existing events rather than the introduction of new ones. In fact, the number of new events (including events with a changed setting) launched in the second quarter was 5% lower than in the first quarter.
These insights point to two key trends:
- Attention to LiveOps continues to grow, pushing new projects to rapidly scale up their event calendars
- As summer approaches, many games enter a quieter period, with most major holidays already behind, creating a window for data analysis and preparation for the upcoming fall season
Win Streak, Lava Quest, Core Duplicates, Race, and Collection are the mechanics most frequently featured in game events. In Q2 2025, all of these mechanics saw an increase in usage, ranging from 7% to 23%, indicating they were launched more frequently on a monthly basis.
However, the Collection mechanic experienced a decline of 13.83%. This is most likely due to the end of the New Year holiday period and does not necessarily signal the start of a downward trend
The highest relative growth among the popular mechanics was shown by Win Streak, Lava Quest, Pick-a-Box / Card, Core Duplicates, and Digging mechanics.
| Common mechanics | Growth rate QoQ |
| Win Streak | 23.04% |
| Lava Quest | 22.88% |
| Pick-a-Box / Card | 19.43% |
| Core Duplicates | 18.33% |
| Digging | 18.22% |
Average number of events per game for the most popular mechanics:

Among the rarely used mechanics, the highest growth was observed in Gacha, Expedition, and Album mechanics. Notably, the Album mechanic was the only one to show consistent growth without month-to-month fluctuations.
Fishing and Monopoly, on the other hand, showed no growth or a decline, indicating a decrease in their popularity.
| Rare mechanics | Growth rate QoQ |
| Gacha | 92.59% |
| Expedition | 71.88% |
| Album | 23.30% |
| Login Calendar | 13.21% |
| Tabletop | 8.57% |
| Fishing | 0.00% |
| Monopoly | -3.85% |
Average number of events per game for rare mechanics:

Persona.ly: Rethinking Incrementality: A Cohort-Driven Framework
As UA costs rise, many app developers are looking for ways to monetize their existing user base — especially inactive non-payers — beyond traditional CRM automation.
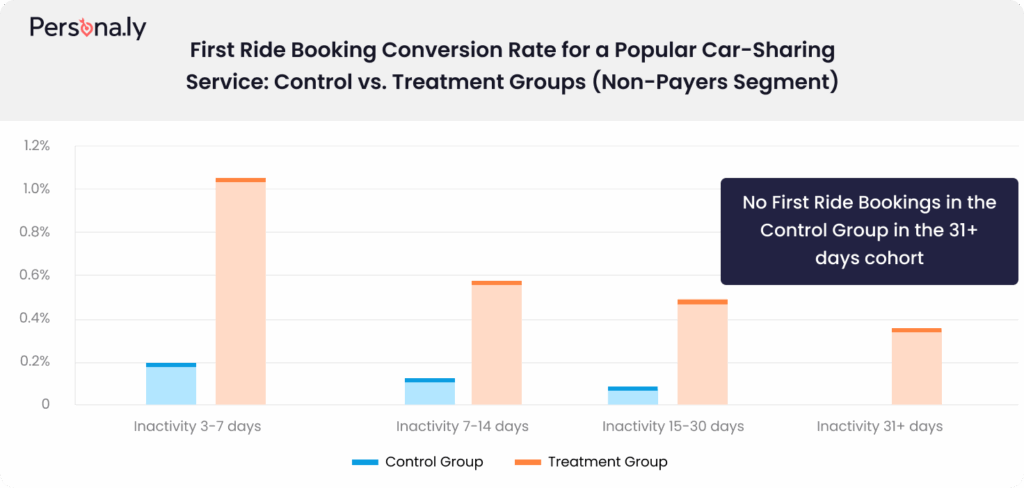
Measuring incremental lift is critical to understanding the true effectiveness of retargeting campaigns. Being a data-driven programmatic DSP, at Persona.ly we know that doing it right requires more than just comparing a treatment and control group. Real insights emerge when incremental lift is measured across cohorts of users segmented by recency of app interaction. This allows marketers to uncover where retargeting is truly moving the needle, and where it’s not.
To ensure your measurement is valid (and actionable), ask (and answer) the three key questions.
1. Are the baseline inactivity patterns the same between control and treatment groups?
Why it matters: If one group is naturally more active than the other before the campaign even begins, any difference in performance afterward could be due to selection bias, not the campaign itself.
2. Are the typical users in both groups similar?
Why it matters: Even if overall activity looks aligned, the makeup of users can skew outcomes if not balanced. If one group over-represents a particular user type (e.g., high spenders), it could inflate the lift estimate artificially.
3. Are the average activity times the same?
Why it matters: Timing plays a critical role in app engagement. If one group skews toward weekend use and the other toward weekdays, your results may reflect temporal behavior—not campaign impact.
Once the differences between the control and treatment groups across all cohorts are confirmed negligible — and the groups are well-balanced for incrementality testing — the resulting lift can be confidently attributed to the campaign. This unlocks a clearer understanding of true business impact.
Because looking deeper allows you to aim higher and proves the strategy works.
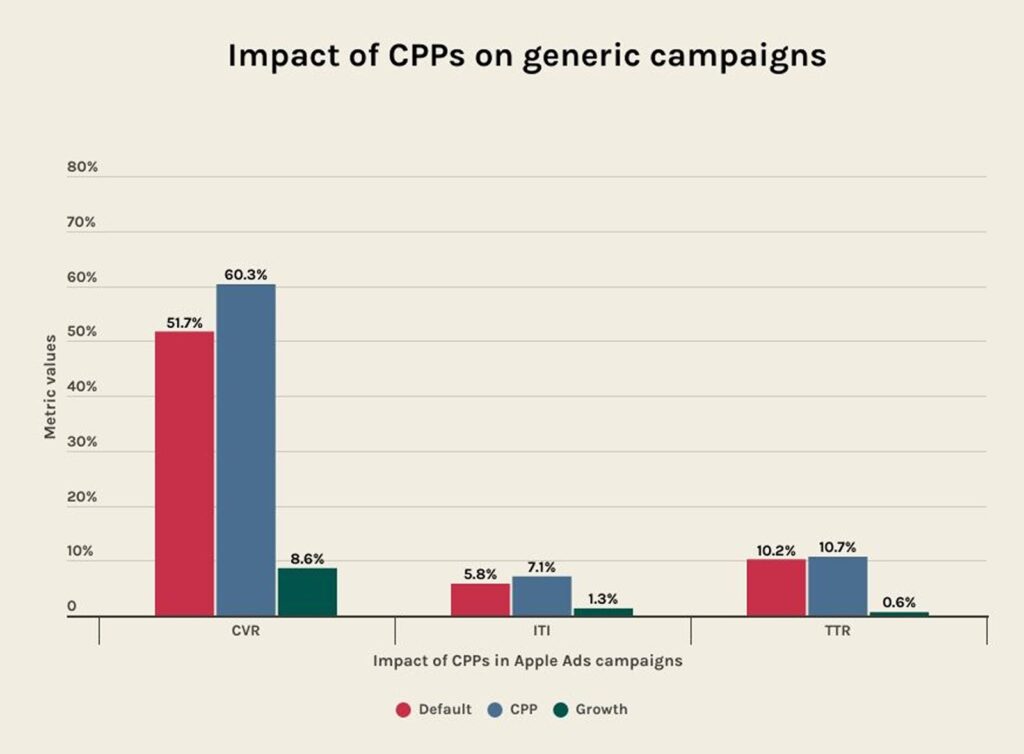
AppTweak: CPPs lift conversion rates up to 8.6%
Insights from AppTweak’s 2025 ASO trends & benchmarks report reveal that custom product pages (CPPs) remain significantly underutilized in Apple Ads, despite their strong impact on paid campaigns.
In 2024, just 31% of top apps and 26% of top games leveraged CPPs, meaning nearly 7 in 10 missed an opportunity to improve conversion performance.
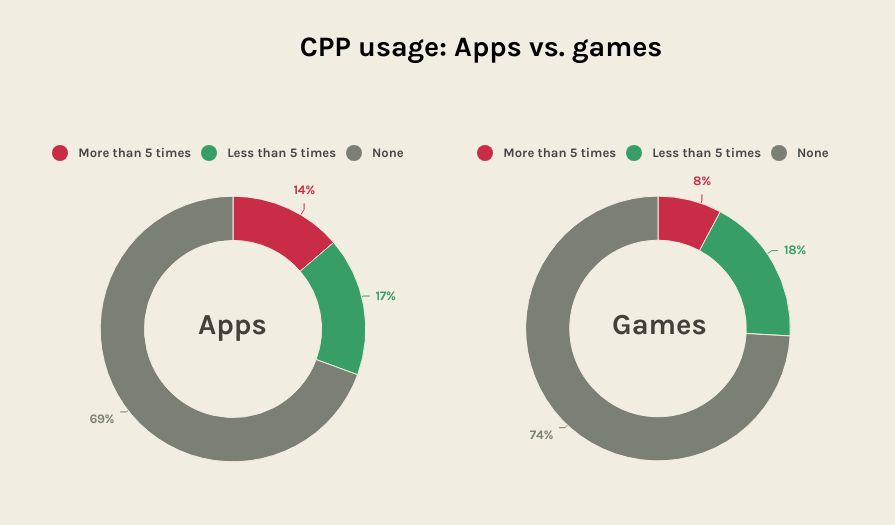
Among the apps that did adopt them, CPPs delivered a 5.9% increase in conversion rate (CVR), a 1.3% lift in tap-through rate (TTR), and a 1.3% uptick in impressions-to-installs (ITI).
While competitor campaigns performed with a 6.9% CVR gain, results were strongest for generic keyword campaigns, where CPPs drove an 8.6% CVR uplift over default pages. These results highlight the value of tailoring CPPs to search intent.

Tap into the power of custom product pages
If you’re running Apple Ads campaigns, the data shows that CPPs serve to drive stronger outcomes. Here are five ways you can use them to maximize your Apple Ads.
5 strategic use cases for custom product pages
- Target specific audiences
Example: A language app creates 1 CPP targeting “Speaking Spanish” and another “Speaking French”. - Highlight key (or new) features
Example: A plant app uses two CPP for different features: “Plant growth” and “Plant identification”. - Share seasonal or promotional campaigns
Example: A shopping app creates a CPP for its Black Friday deals. - Re-engage returning users
Example: A music app builds a CPP that highlights a long-requested feature of translated lyrics to win back lapsed users. - Target competitors with stronger offerings
Example: A food delivery app has a CPP that advertises “20 minutes or less”, pursuing a competitor’s pain point of longer delivery times.
With rising costs and competition across ad placements, CPPs offer a scalable lever to enhance campaign performance. The low CPP adoption rate suggests a strategic opportunity that ambitious apps can take advantage of to get ahead of their competitors.
Jampp: CTV is surging with 56% more campaigns
CTV isn’t just a shiny new toy anymore—it’s quietly becoming the industry’s not-so-secret weapon.
The number of CTV-to-mobile campaigns has increased by 56% since H2 2024, building on a 17% quarter-over-quarter rise in Q1 2025 that continued growing at the same pace into Q2. Budgets are also moving with conviction rather than curiosity, with ad spend from these campaigns more than doubling in H1 2025. For mobile advertisers, that’s the market telling you it’s time to scale—and not just test—CTV.
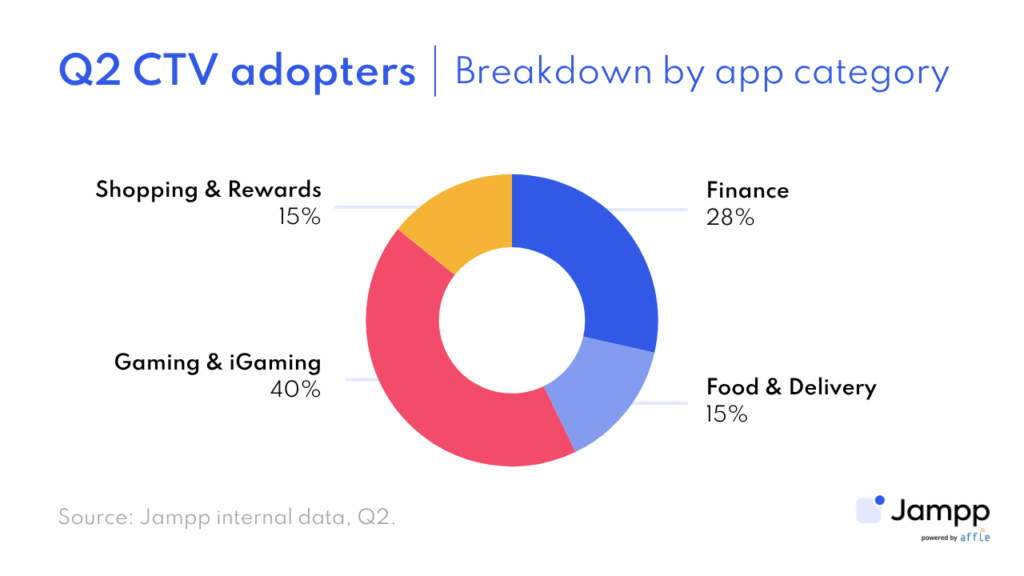
The app categories driving this growth in Q2 2025 are Gaming & iGaming and Finance—with the former representing approximately 40% of new CTV adopters and the latter round 28%—since CTV storytelling is proving to be particularly effective for simplifying the steps to launch a new account or demonstrating how to redeem welcome incentives.
Operating CTV at a global scale, Jampp is empowering mobile advertisers to scale across key markets. While Latin America and Asia-Pacific saw the fastest initial adoption with the performance CTV boom over the past two years, North America emerged as the Q2 leader, representing over 40% of new adopters.
Why this is happening:
- Untapped channel: CTV is popular but still underutilized by app marketers, offering a great opportunity to diversify your reach beyond mainstream channels.
- Extended household reach: Unlike mobile, where one user sees an ad, a single CTV impression can reach multiple users at the same time.
- Performance-focused tracking: The latest technology goes beyond traditional branding campaigns, allowing marketers to drive installs and in-app conversions in real time and track attributions via leading MMPs like Singular.
- Enhanced performance and cost-effectiveness:
- CTV proved its value in Q2, driving over 40% more installs when running alongside mobile campaigns.
- In Q2, roughly 47% of installs from CTV campaigns went on to complete key actions later in the funnel.
- CPM rates vary by region, averaging $8–12 in North America and $3–7 in Latin America—making CTV a competitively priced high-impact channel in comparison to traditional TV.
CTV is now a must for mobile growth. It’s time to bridge the gap between TV and mobile—your users already have.

YouAppi: display banners in 2025 … small format, but big impact
In Q2 2025, YouAppi doubled down on analyzing the true value of display banner ads—with a focus on the often-underestimated 320×50 format. Across multiple client campaigns and verticals, we conducted incrementality testing to uncover the real contribution of small display formats within the retargeting funnel.
What we found consistently challenges industry assumptions: 320×50 banners aren’t just cost-effective—they’re high-performing. These compact creatives, when placed and measured correctly, deliver measurable lift in both engagement and conversions.
Why this is happening:
- Intent-rich moments: Small banners frequently drive higher-quality clicks, often signaling users with stronger re-engagement intent.
- Cross-format synergy: Display banners enhance broader campaigns, ensuring brand reinforcement across the customer journey.
- Measured impact: With accurate attribution windows and uplift methodology, the true ROI of banners becomes clear.
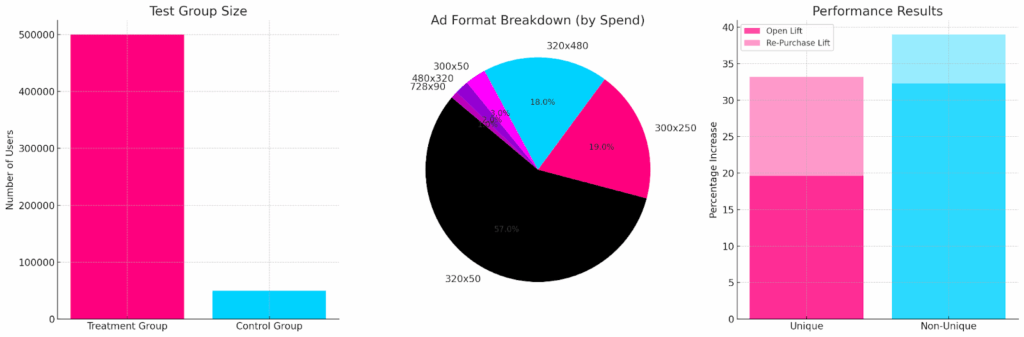
Spotlight Case: Gaming Client – Q2 Display Uplift Test
Among several tests conducted, one standout example came from a leading mobile gaming app, where YouAppi ran a 1-month display-only uplift test in Q2.
- Test Group Size:
- Treatment Group: ~500,000 users
- Control Group: ~50,000 users
- Ad Format Breakdown (by Spend):
- 320×50: 57%
- 300×250: 19%
- 320×480: 18%
- 300×50: 3%
- 480×320: 2%
- 728×90: 1%
- Performance Results:
- App Open Lift:
- Unique: +19.6%
- Non-Unique: +32.3%
- In-App Purchase Lift:
- Unique: +33.2%
- Non-Unique: +39.0%
- App Open Lift:
- Statistical Significance: 96.2%
The takeaway
Across Q2, our tests consistently revealed that 320×50 display banners are quietly outperforming expectations, often driving greater uplift than video ads in retargeting. In the spotlight case above, this format commanded the majority of spend and helped fuel one of the strongest purchase uplift results of the quarter.
As brands push for more efficient retargeting strategies, precision-tested display formats like 320×50 should not be overlooked. When combined with holistic creative planning and granular attribution, they drive real business outcomes—at scale.
Small banners. Massive performance. Smart marketers know the difference.
Footnotes
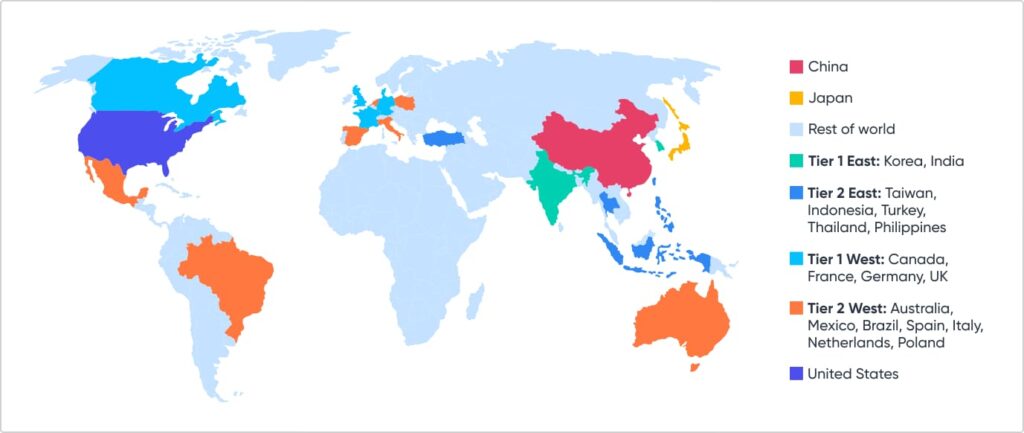
Countries and tiers
We look at global data through a number of filters. One is country tiers, which because of our customer base we define as:
- China
- Japan
- Rest of world
- Tier 1 East: Korea, India
- Tier 2 East: Taiwan, Indonesia, Turkey, Thailand, Philippines
- Tier 1 West: Canada, France, Germany, UK
- Tier 2 West: Australia, Mexico, Brazil, Spain, Italy, Netherlands, Poland
- United States
About this data
All of this data is based on Singular’s view of the adtech ecosystem. While we have a significant share of the Mobile Marketing Platform space and see a huge amount of data, our insights will be biased towards actively marketing and growing apps that are spending significantly on user acquisition.