8 charts on $500 million in shopping apps ad spend: what can we learn?
What can we learn from $500 million in retail app user acquisition spend?
- Mobile marketers in ecommerce verticals don’t spend a lot on re-engagement
- Retention is highest in summer and lowest in winter
- Organic vs paid ratios are significantly different on iOS and Android
- And much more …
Free lunch (or, shopping apps ad spend data)
I seek data like a hungry carnivore on the African savannah hunts wildebeest, so when I sniffed out a cleansed, normalized global dataset on shopping apps that I didn’t have to mercilessly beat out of some overworked and stressed out analyst, I howled like a hyena stumbling across an unexpected protein-pack airdrop from heaven.
Singular CTO Eran Friedman assembled the dataset, doubtless for private use in his dark arts of mobile growth, and you are the beneficiary.
Some notes before we jump in:
- It’s a year-long, global dataset
- It’s from 2021, the year of the change (in other words: ATT)
- It shows seasonal adjustments as well as some of the impact of iOS 14.5
- It highlights how high-growth apps with significant marketing investment are seeking growth, not necessarily the mobile ecosystem as a whole
- There’s much more we’d like to learn and recent ecosystem data to review: keep tuned
Let’s dive in.
Retail apps don’t spend much on re-engagement advertising (except prior to holidays)
Retail app marketers focus on new users, not re-engaging existing or lapsed customers. For most of the year, more than 80% of their paid marketing spend is directed towards hunting new customers, not farming existing users.
The only time it drops below 80% is — you guessed it — in December, when every shopping and store app wants to remind customers that they have purchased in the past, that there are deals now, and that they have just the right app to do it with.
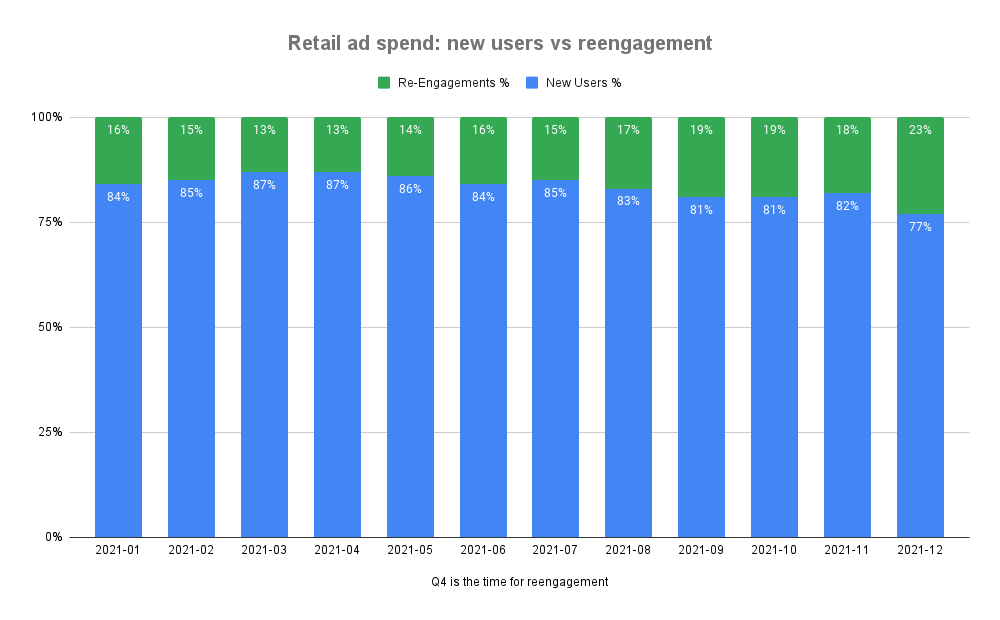
There is a giant caveat here, of course.
Unlike many other verticals like gaming, e-commerce apps are much more likely to have multiple personal identifiers for their customers. When you buy something with a credit card in an app, you’re almost guaranteed to provide your email address during the account creator or checkout process, and you are likely to be asked for your phone number so you can get SMS alerts on shipping status.
Which means that customer retention, re-engagement, and nurture has shifted, for a lot of shopping app growth teams, out of the paid acquisition team and into the engagement/retention/live ops/nurture team. Or at least is being targeted via owned channels, not paid.
Speculation:
It’s possible that Android Privacy Sandbox, which will offer Fledge for built-in on-platform re-engagement, could boost this number on Android. Time will tell. Also worth noting: in a recent Singular webinar, one of the things top marketers want most from iOS is a privacy-safe way to do effective retargeting.
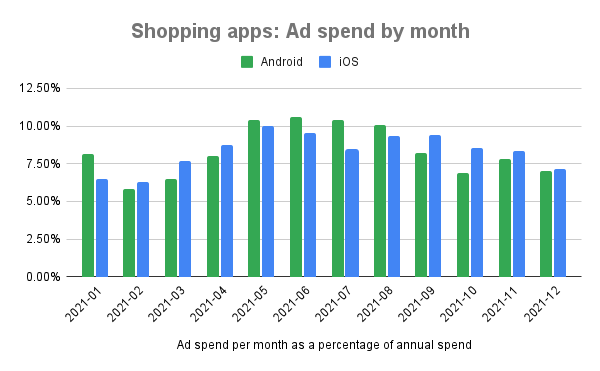
Spend distribution by month follows slightly different patterns on iOS and Android (but there are 2 caveats)
No, mobile advertising spend doesn’t peak in the holiday months of November and December. Actually, it peaks in the other kind of holidays: the spring/summer months of May, June, and July.
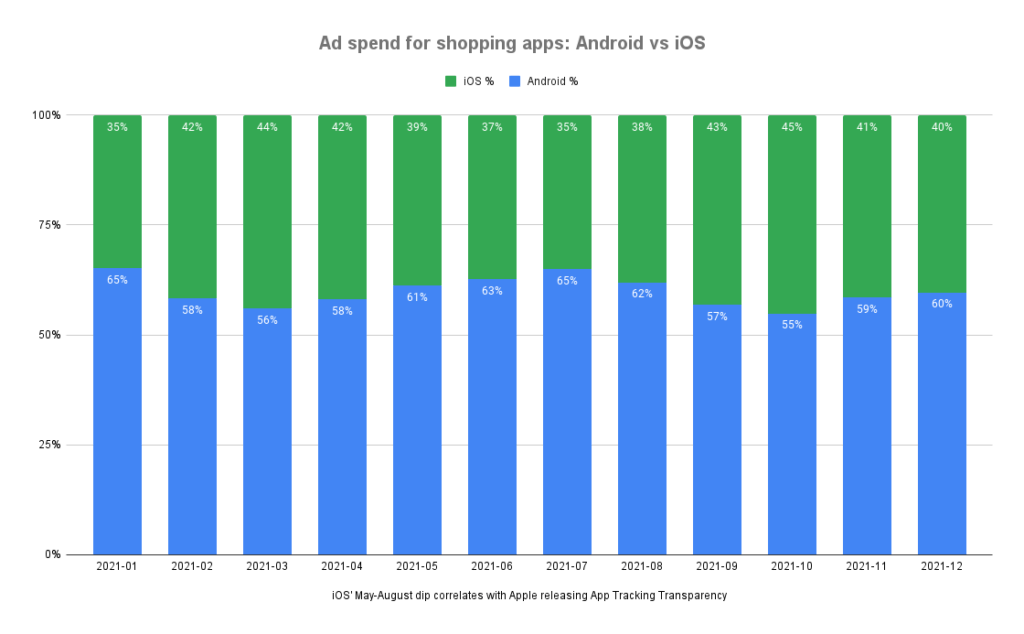
In addition, mobile user acquisition marketers spend just a little differently on iOS and Android. Here’s the pretty chart with spend for each platform as a percentage of total spend for each platform:
It’s a little challenging to see the pattern in a chart like this, so here’s the data simplified in an overlapping area chart:
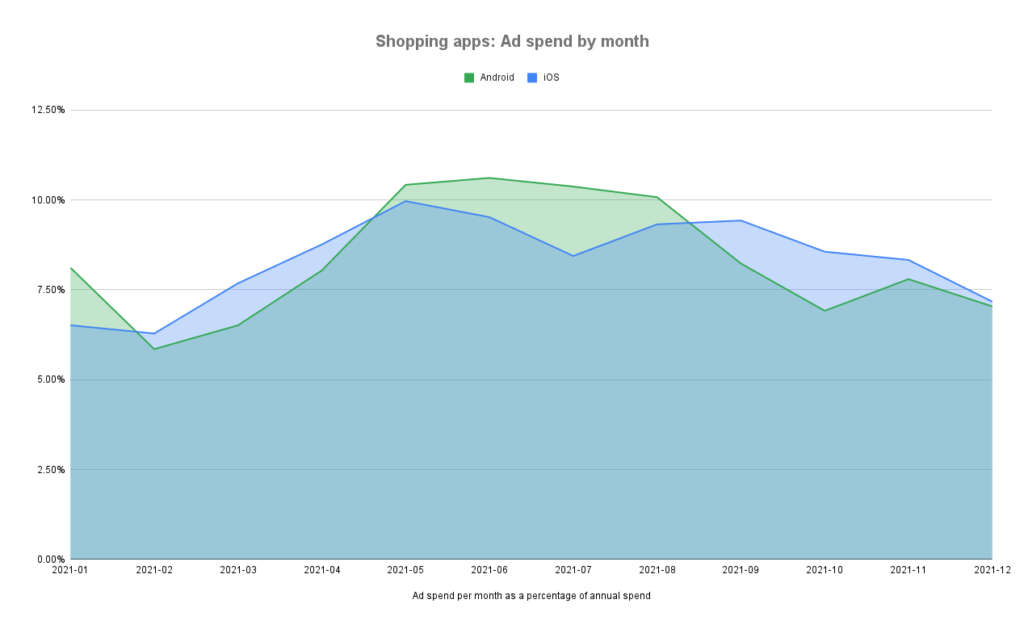
Now you can clearly see the head-and-shoulders pattern for Android, which is a bit more pronounced than for iOS, where the “head” is somewhat spread out and less pronounced.
There are a couple of big caveats here, however.
See that divot out of the top of the iOS “head?” Apple’s privacy-focused ATT hit in summer 2021, and ad spend fled iOS to Android. That divot is pretty closely aligned to the initial impact of iOS 14.5 and subsequent iOS point releases that Apple released to more iPhone owners. And the growth out of the divot is likely some of the biggest advertisers starting to figure SKAdNetwork out.
Second, a single year doesn’t make a lasting, bankable pattern, so as previously mentioned, stay tuned for more data as we come to the end of 2022. We’ll have to see this pattern for the current year before we can chalk it up to a potentially durable platform difference between Android and iOS.
Retention is highest in summer, lowest in winter
As you know, retention is a sad, sad story in the mobile growth space, with the average app retention a few short weeks after download typically in the single digits. Interestingly in the shopping apps vertical, retention differs significantly from month to month, and season to season.
For instance, users you acquire in January have truly atrocious D7 retention rates:
- 8% on iOS
- 4% on Android
It gets better, however, with nearly double the retention rate on iOS in August and September, and nearly triple the retention rate on Android in September and October.
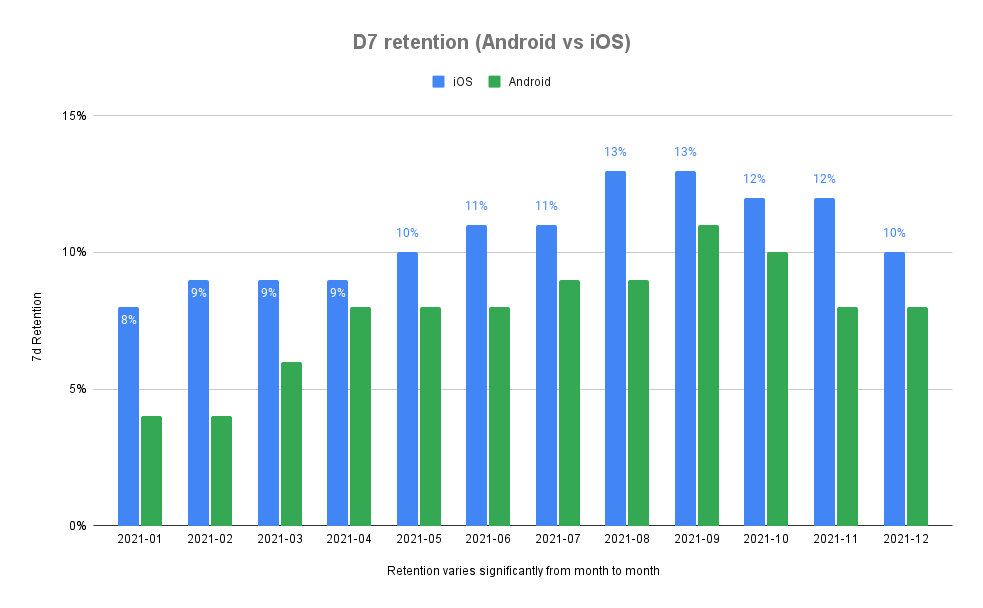
There’s always been a perception that iOS retention rates are better than Android, and according to the letter of the law, that’s true: every single month, iOS shows a higher D7 user retention rate. The big BUT here, however, is that the rates really don’t vary that much between the major mobile platforms. Besides January and February, when iOS literally doubles up on Android, for the other months it’s not that different. iOS sees 20-30% higher retention than Android, sure, but it’s not double or triple the rate.
Smart marketers correlate that difference with the cost of user acquisition difference and keep on trucking.
Interestingly, retention and ad spend levels are somewhat positively correlated: app publishers spend more in the summer months; retention levels are highest in late summer and early fall. On the one hand, that’s counterintuitive: more spend, more noise, more activity, and more competition in user acquisition would seem to decrease retention as retail apps poach each others’ customers. On the other hand, that very flurry of activity could keep apps top of mind and result in de facto even if unintentional engagement or retention campaigns.
The lion’s share of spend is on Android
Ad spend globally for iOS and Android has been fairly stable for the past few years at about 60% for Android and 40% for iOS, at least among Singular’s customer base which skews North American and European. That changed with Apple’s release of App Tracking Transparency in iOS 14.5:
Immediately post ATT Android ad spend share grew, and not because iOS spend dropped significantly. iOS spend decreased slightly from May to following months, but only about 5%. Android ad spend, however, ramped 23% from May to April, grew a bit more in June, and then stayed near that level for the rest of the summer. It was measurable, it was familiar, it worked according to the traditional rules of mobile user acquisition, and as such it sucked up ad spend (and acquisition costs skyrocketed).
Everything evened out somewhat to historical norms in platform ad spend as the year came to a close, likely due to significant brand spend that realized that despite measurement woes, people were still on iPhones, still using their iPhones, still installing apps, and still buying things.
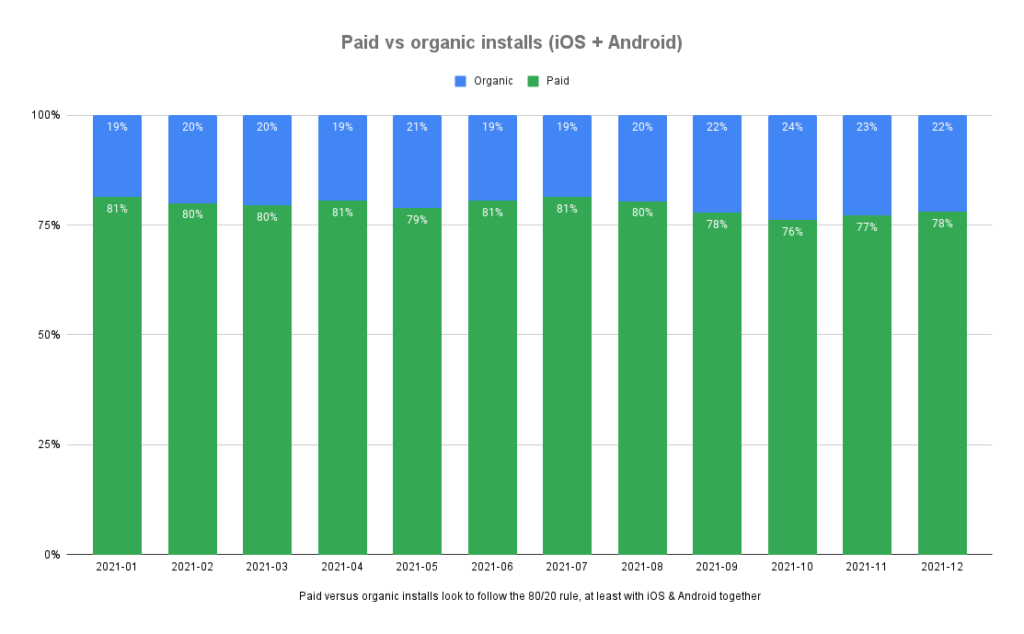
Organic vs paid installs: iOS vs Android
We’ve seen a long-standing 80/20 run in general for paid versus organic installs for high-growth apps. Clearly, this discounts viral apps that blow up and generate 10s or 100s of millions of app installs in just a few months. But for most high-growth mobile-centric companies, paid acquisition has historically been about 80% of their app installs.
That looks to be the case recently as well, but the overall chart is deceiving:
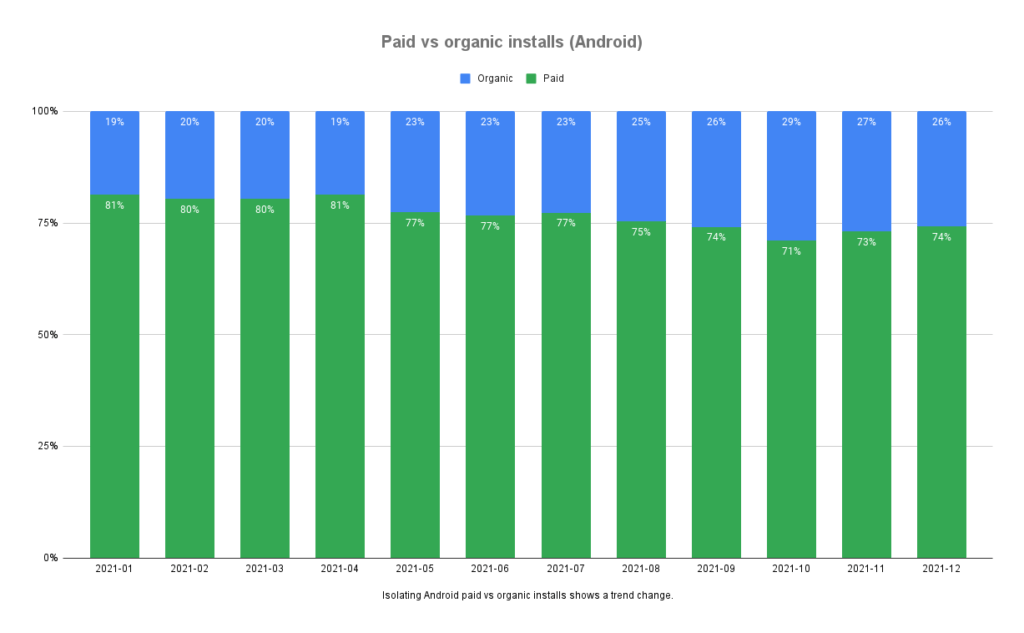
The Android-only chart, however, shows a fairly significant difference:
And the iOS chart shows the opposite movement:
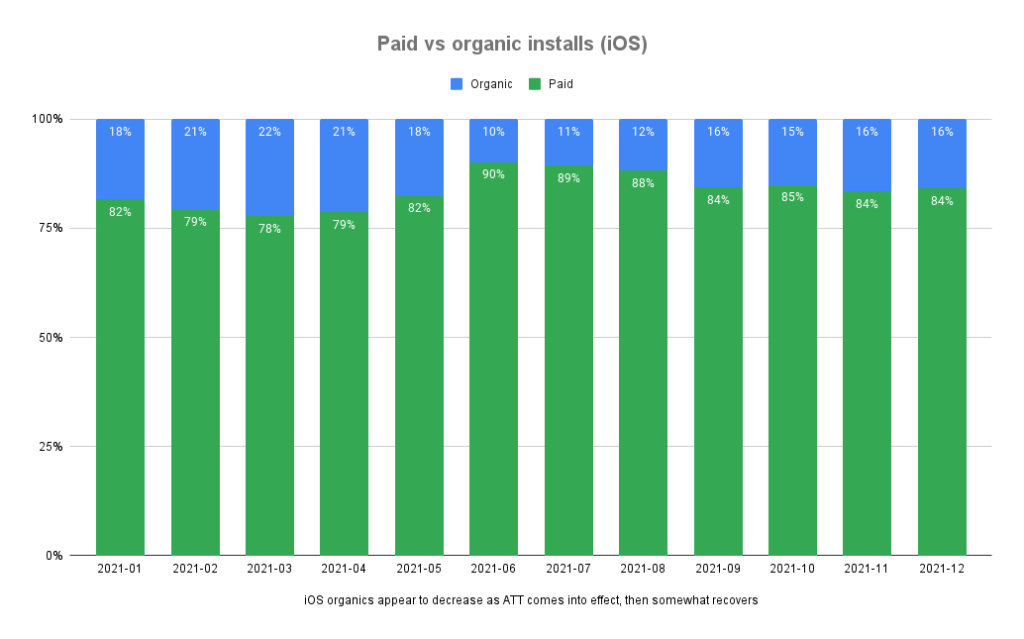
Clearly, the year ends trending to 75-25 on Android as a paid-organic split of user acquisition, and a fairly different 85/15 on iOS. Assuming that measurement stayed stable on Android (a fairly safe assumption) we’re seeing a real effect there, possibly caused by an organic boost following months of increased Android ad spend. On iOS, we see a three-month blip where organics decrease fairly instantly and alarmingly, followed by a gradual return to near (but not quite at) historical averages.
We’ll need to pull more data to find where this is going now.
Data, questions, and answers
As always, data answers some questions and poses new questions, for which we need new data. I will track down some data analyst (or hound Friedman) and answer some of those.
Plus pose additional others, I assume. If you have any, ping me on Twitter.
And, as always, if you’re looking for help in getting measurement right in these crazy and chaotic mobile growth times, book a demo and tell us what you need.

Stay up to date on the latest happenings in digital marketing

