Announcing Benchmarks: How does your marketing performance stack up to the competition
User acquisition (UA) teams are inherently data driven, with numbers, statistics and evaluations at the center of every task. One data type which has always been difficult to determine is how your UA activity compares with industry standards and trends.
Why would you even need to understand the general landscape?Let’s take a step back and review a few questions that an overarching view can help answer:
- How does your ad spend compare with industry standards? Where are you paying more or less? What trends should you perhaps be following for better performance?
- Which networks seem to be performing best within specific geographic regions? Where are your industry competitors putting their ad dollars?
- What new verticals or regions are relevant to look to working in? What KPIs are realistic?
- Is the engagement your creatives generate inline with what our competitors?
In short, benchmarking can help teams make smart decisions about where to invest their efforts to reach their goals.
Understanding this marketer need, Singular is excited to introduce Benchmarks for Gaming; powerful, visually-appealing access to industry landscape-level industry trends to stay one step ahead. We’re excited to be the first and only attribution solution that give you gaming marketing performance benchmarks
With three specific benchmarking features, marketers can now gain a full 360-degree view of the kinds of trends that can help them optimize their performance.
Let’s detail the offering to better understand the gain.
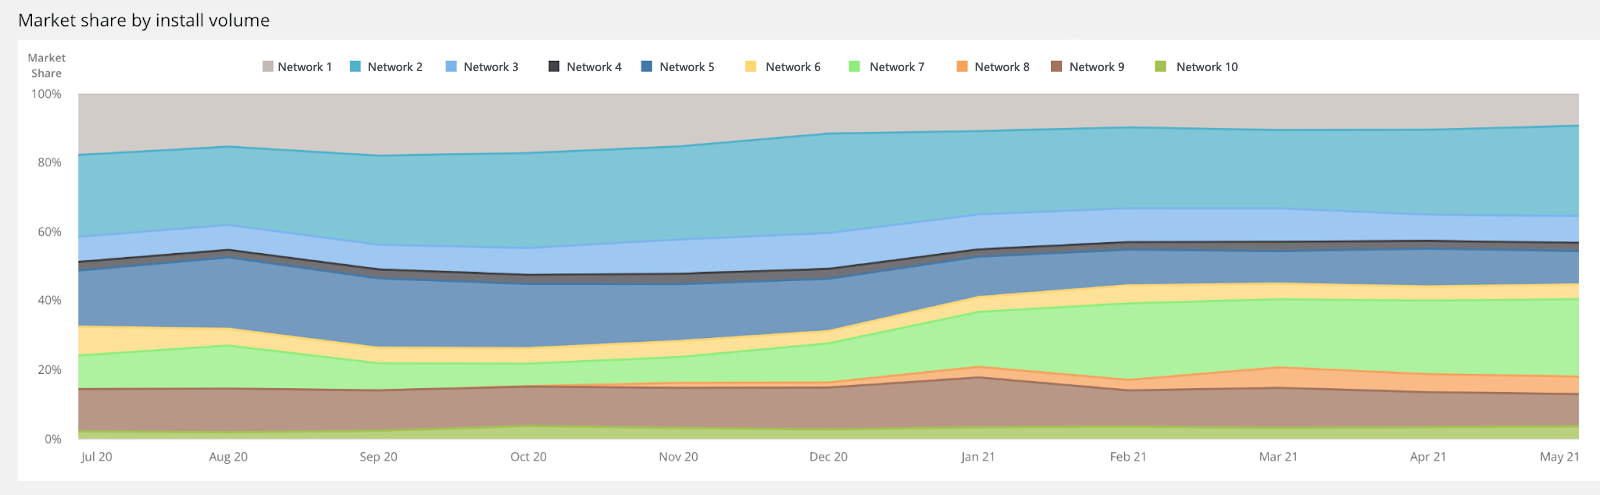
With the ‘market snapshot”, they can
- see where advertisers are spending in every genre and region
- see where advertisers are getting their installs from in every genre and region
- see how the cost and installs market share changes over time
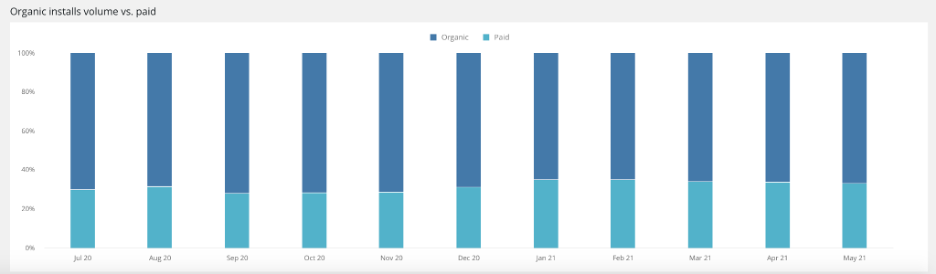
- see what % of installs is coming from organic versus paid marketing
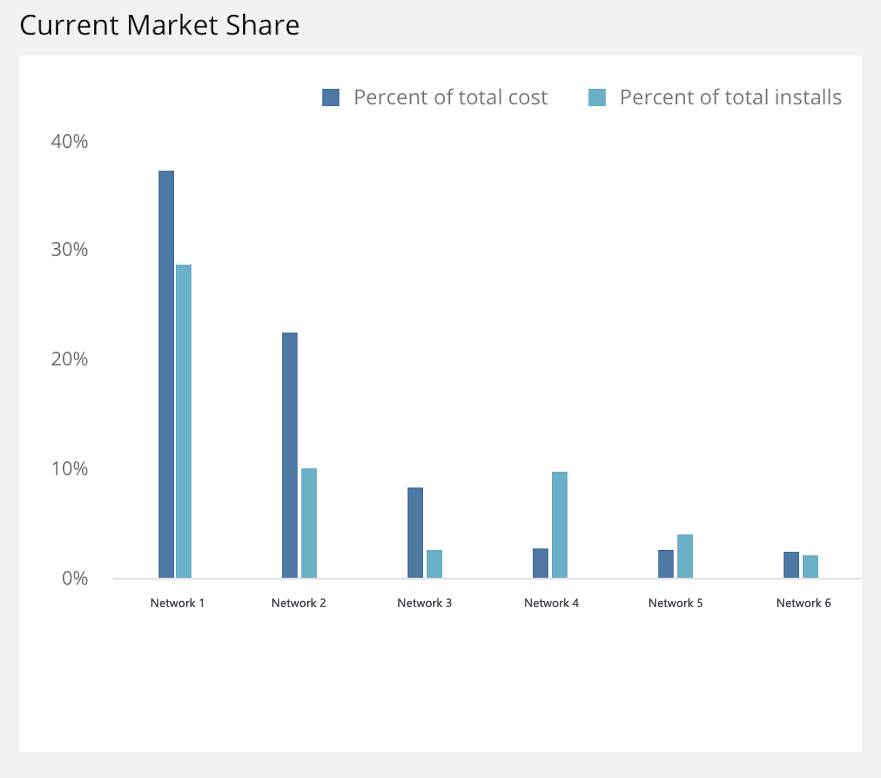
Portfolio reporting allows marketers to measure their own spend against the industry and rank accordingly. Compare where you are spending money in a given vertical or region to where the industry is spending. See with which networks you may be overspending or underspending.
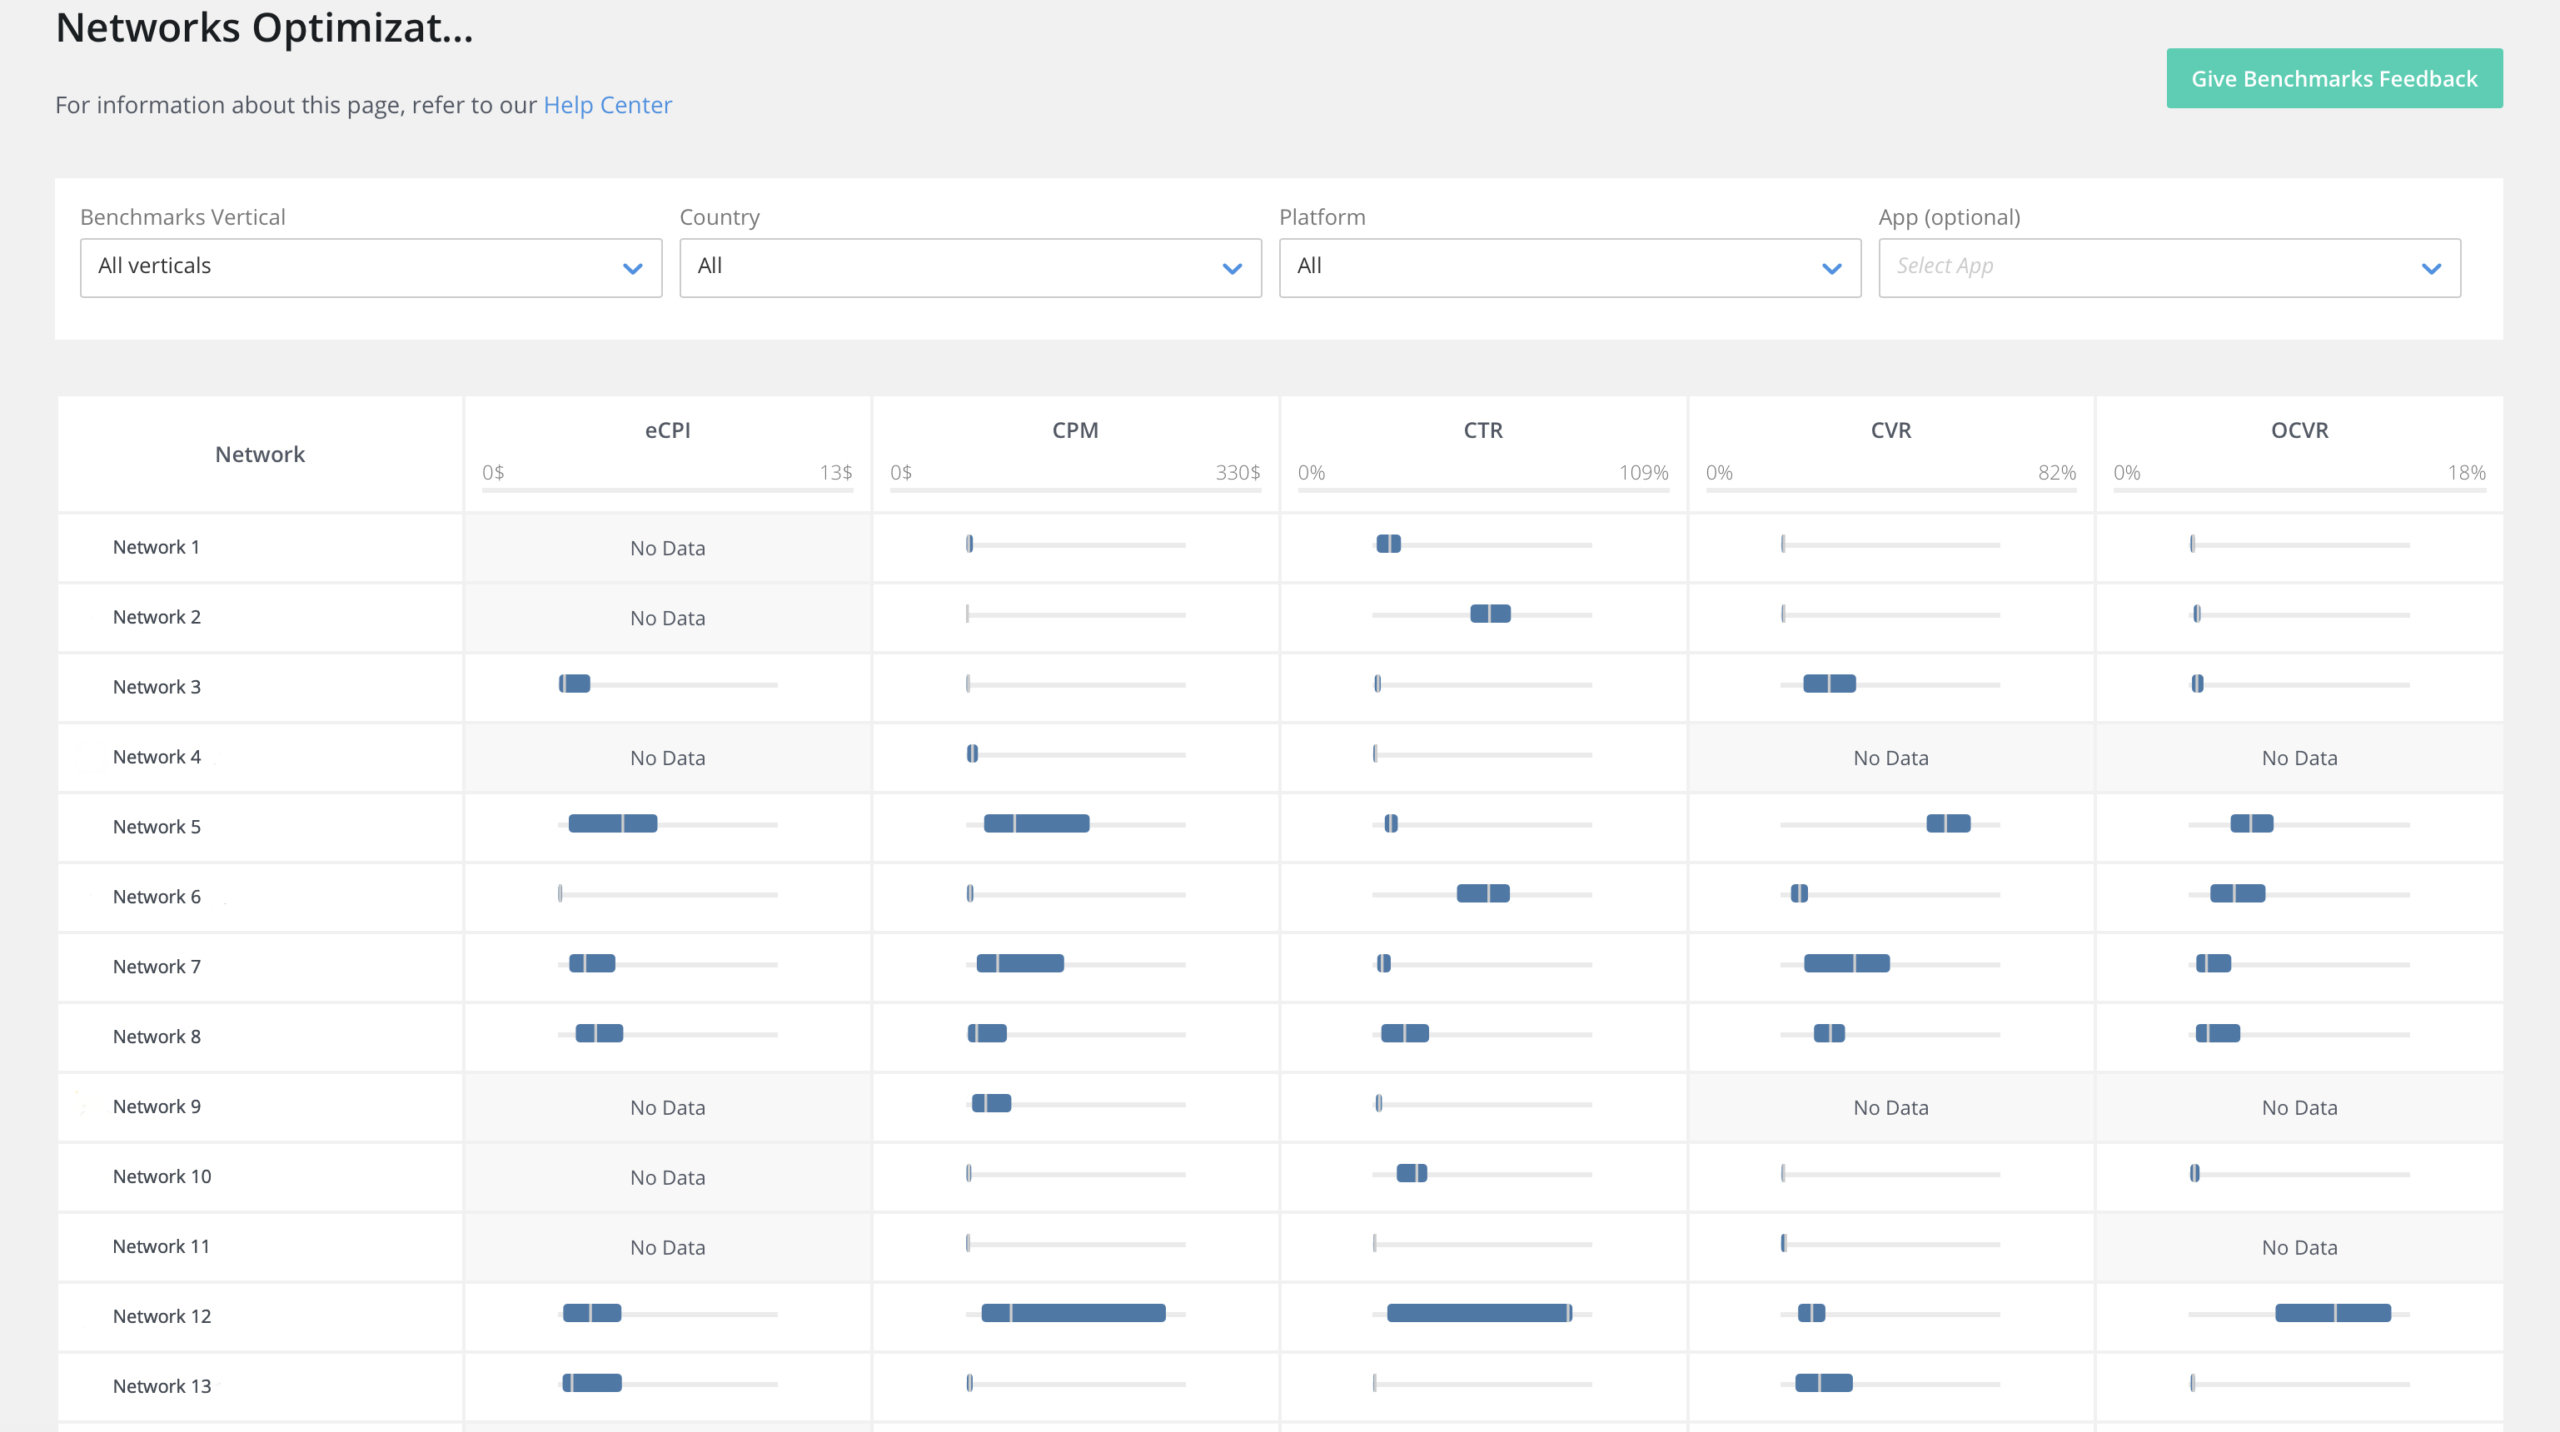
Network Optimization gives a bird’s eye view of major network KPIs so that you can analyze metrics such as eCPI, CPM, CTR, CVR and oCVR for each network, vertical, and region.
Conclusion
With Benchmarks for Gaming, there are a slew of new insights Singular customers have never had access to. For instance, you can run a quick check on cost distribution across the industry versus install distribution to see which partners provide the most installs at the least cost. Is the ROI worth it for those partners? Is the ratio for that partner suggestive of fraud? Should I be investing more with this particular ad network?
We know you’ll find the findings in Benchmarks invaluable.
However, maybe you don’t have access to them yet. Maybe you’re not yet a customer.
No fear: we’re going to be providing some insights from Benchmarks for Gaming over the next few weeks and sharing them here on the blog.
Don’t want to wait? Talk to a product expert to take the next step and get full access yourself!

Stay up to date on the latest happenings in digital marketing

