ATT opt-in rates 2024: down, down, down (but here’s how to improve)
ATT opt-in rates have been decreasing quarter over quarter for most of the past year, reaching critically low levels for many verticals that threaten to make the IDFA near extinct on the iOS platform.
For context, in May of 2021, App Tracking Transparency opt-ins were at 19.4% overall, with some countries at over 30% (France) and nearly 24% (Korea) or around 23% (Japan and South Africa). By July, they had risen somewhat to 26% globally.
So they were never really high to begin with.
But now in mid 2024 they’ve sunk to just under 14% globally, across all verticals. (Note: 14% is the percentage of devices that allow tracking permission upon first open.)
That’s a pretty clear (and depressing) trendline:

(Note: There is a way to improve your ATT opt-in rate, and patience is the key. More on that later: keep reading.)
ATT opt-in rates: massive vertical variance
As you can see in Singular’s Q2 2024 Quarterly Trends Report, there’s a ton of variance in ATT opt-in rates by vertical.
The first and most obvious variance is between games and apps. Games are much better at getting an immediate yes to the App Tracking Transparency prompt. While just 11.92% of apps get an immediate yes to tracking, 18.59% of games get a positive response, boosting their ATT opt-in rates significantly higher.

But when you look by vertical, you see that there’s a much more significant amount of diversity in ATT opt-in rates. For example, Music games hit 35% yes, while Adventure, Card, and Simulation games were all in the 24-25% range.
Casino and Trivia games, by contrast, were both sub-10%. Also, Educational games are largely for children, and cannot ask for tracking permission.

When it comes to apps, you see a similar range.
Weather apps still get an amazingly high yes rate for ATT at 38%, but it’s not as high as in Q1, when it was almost 45%. Art & Design as well as Food & Drink are high as well, along with Maps & Navigation: all above 25%.

News, however, is below 5%, as is Medical.
Business, Social, and Entertainment apps are all just above the 5% threshold.
Why this is a massive problem
While some app marketers tossed IDFA as a component of their marketing measurement after iOS 14.5, others who achieved relatively high ATT opt-in rates have continued to use it to this day.
Think about it: yes, IDFA is dead in terms of a deterministic granular vector of mobile app attribution. But if you’re just looking for a (highly reliable) probabilistic indicator of your overall success, getting ATT tracking permission for even 10% or 20% of your iOS app installs serves as a pretty good sample size that can be extrapolated to entire cohorts.
Remember, to survey the entire U.S. population to the 95% confidence level and a 1% margin of error, you only need about 10,000 respondents.
So this can be super-powerful.
But there is a problem.
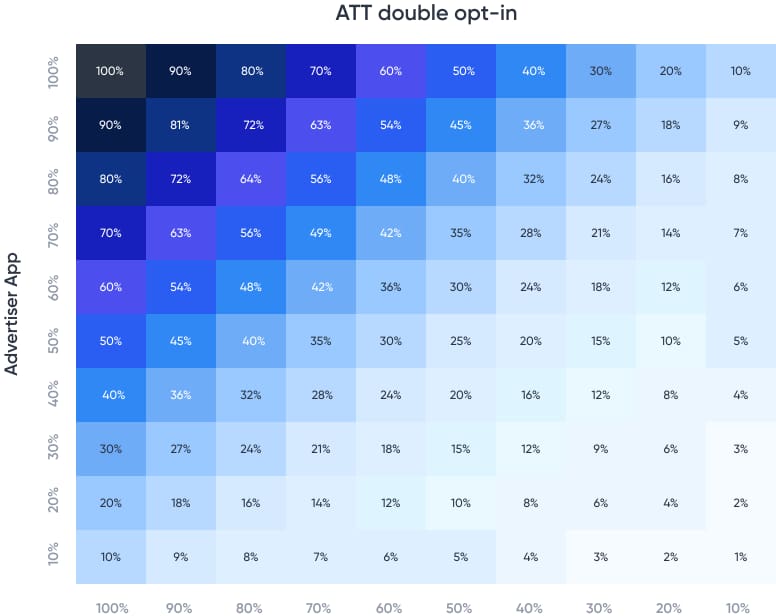
For ATT opt-in rates to matter and for marketers to actually get an IDFA for an install, you need double opt-in (advertising app AND advertised app. And the numbers can get very small very quickly. For example, a 10% opt-in on both sides gives you just a 1% IDFA rate. Even a fairly decent 20% on both sides gets you just 2% of the IDFAs you’d ideally want.

You can calculate required sample sizes yourself with this equation, where:
- n is the sample size
- Z is the Z-value (e.g., 1.96 for a 95% confidence level)
- p = is the estimated proportion of the population (use 0.5 for maximum variability)
- e is the margin of error

So if you’re willing to sacrifice some margin of error, you can get pretty interesting results on 100,000 installs. At a 95% confidence level, here’s what the required ATT opt-in rates look like:
- 5% margin of error: 383 installs with a yes to ATT
- 3% margin of error: 1,056 installs
- 1% margin of error: 8,763 installs
That’s not huge, which is encouraging.
Another example: for 10,000 installs, you’re looking at 370 installs with an ATT opt-in to give you a 95% confidence level with a 5% margin of error. Unfortunately, the needed sample size doesn’t decrease linearly with the population size.
That’s 3.7% of the population, so you need 20% opt-in rates on both sides (advertised and advertiser apps).
And that looks like it’s getting harder to achieve.
But there is some good news.
ATT opt-in rates: patience is the key
Suggestion: stop asking for ATT tracking permission immediately.
If you look at the categories that are getting high ATT opt-in rates, they’re ones that brands tend to dominate: Weather, Food & Drink, Maps & Navigation, Lifestyles, Travel. What makes a brand a brand? People know them, hear about them, have an opinion about them.
When that’s largely positive, ATT opt-in rates go up.
(It’s no surprise that casino games and social media apps are among the worst-performing verticals for ATT acceptance.)
So don’t ask right away.
Build a relationship. Build some familiarity. Establish trust. In other words, build a brand, and then ask later when you have a higher chance of getting a yes.
The cost is the loss of immediate signal, which is really nice to have when you want to optimize campaigns. The benefit is higher opt-in rates for your best users, players, and customers, which will be useful for months and hopefully years to come.
Next steps
Go get Singular’s latest Quarterly Trends Report for insight on ATT opt-in rates and much, much more.
And check out this post on ATT prompts that don’t totally suck, and use smart strategies that allow honesty and openness to win.
Stay up to date on the latest happenings in digital marketing


