Introduction and TLDR
Available in: Portuguese, Spanish, Korean and Chinese
Q2 2026 was the quarter ad spend came back, but iOS inventory did not.
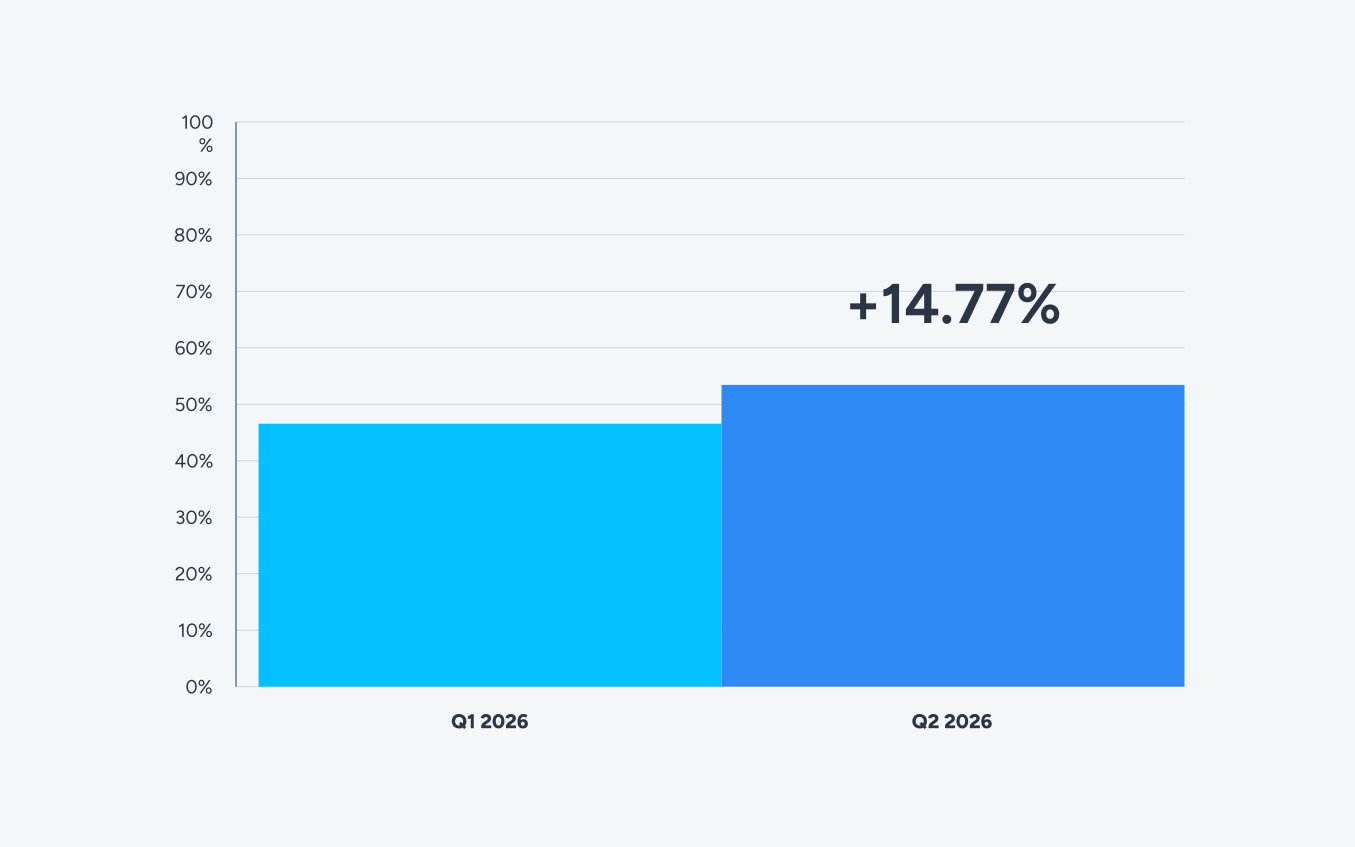
Global ad spend rose 14.77% quarter over quarter (QoQ). Q1 had fallen 8.79%, so the market spent two quarters doing very different things: pulling back, then committing harder than before.
That shape is familiar. In our Q3 2025 report we described the same rhythm, with Q1 contracting after the holiday quarter and Q2 rebounding. What matters is not that Q2 came back, but how it came back.
What makes Q2 unusual is how evenly the money landed.
Android ad spend grew 14.73% and iOS grew 14.80%, just seven basis points apart. Seven of eight country tiers expanded, and seven of ten verticals did too. Rather than shifting budgets between platforms or markets, advertisers put more into almost all of them.
Then the supply side pulled the other way. iOS impressions fell 5.40% while iOS ad spend rose 14.80%, resulting in the sharpest cost movement in the report. iOS CPM climbed 21.36%.
Android had an easier quarter. It absorbed a near-identical increase in ad spend into inventory that grew 6.40%, while its CPM rose only 7.84%.
Cost rose on every measure. CPM up 13.00%, CPI up 8.47%, CTR up 19.10%. IPM rose 4.18%, its second consecutive quarterly gain, and that is the one genuinely encouraging line in the report. Conversion improved, but not by enough to offset what advertisers paid for the impression.
Gaming accounted for 45.09% of total ad spend and grew 16.48%, making up just under half the quarter’s total increase in ad spend. Utilities grew 53.64%. Financial, Education, and E-commerce went the other way, falling by 15.15%, 29.32%, and 3.24%, respectively.
In the network rankings, Google Ads took the top position on combined ad spend gained. Apple Ads led on iOS, its strongest showing in this report, which is what happens when iOS inventory tightens and a search channel is sitting right there.
Highlights and key takeaways
- Global ad spend grew 14.77% QoQ, recovering from an 8.79% decline in Q1.
- Android and iOS ad spend grew at 14.73% and 14.80% respectively.
- iOS impressions fell 5.40% while Android impressions rose 6.40%. iOS share of inventory dropped from 40.93% to 38.12%.
- iOS CPM rose 21.36%, nearly three times Android’s 7.84% increase.
- Global CPI rose 8.47% to $1.25. CPM rose 13.00% to $2.86. Media cost led the increase.
- IPM rose 4.18% to 2.30, a second consecutive quarterly gain.
- Gaming accounted for 45.09% of global ad spend and grew 16.48%.
- Utilities grew 53.64% and Other grew 48.35%, the fastest-expanding verticals of the quarter.
- Financial ad spend fell 15.15% and its CPI fell 25.60%. The category got cheaper to enter.
- Google Ads led the increase in combined ad spend. Apple Ads led iOS ad spend gained.
- Financial runs the strongest Android revenue position in the report, at 88.2% of 30-day revenue on 65.9% of installs.
Bottom line
Q1 was a pause. Q2 was the answer to it, and the answer ran into an iOS inventory pool that had stopped growing. If your Q2 costs rose roughly in line with the market, the cause sat in the auction rather than in your funnel. That changes where the fix belongs.
Spend rebounded sharply while iOS inventory contracted. Where did the money go, and which markets absorbed it?
As always, data in this report is based on a significant slice of Singular’s data:


Global ad spend trends
Global ad spend was up 14.77% from Q1 2026.
That is a large move for a single quarter, and it follows a Q1 that contracted. Read together, the two quarters describe a market that took a breath and then spent hard.
Q2 is normally the rebound quarter. Our Q3 2025 report described Q1 2025 falling after the holiday period and Q2 2025 coming back up. The 2026 pattern repeats that shape.
So the direction is seasonal. The interesting part is what happened underneath it.
- +14.73% Android ad spend QoQ (Q1 2026 to Q2 2026)
- +14.80% iOS ad spend QoQ (Q1 2026 to Q2 2026)
Seven basis points separate the two platforms. That is rare.
In most quarters, one platform leads and the other follows, and the size of that gap tells you where advertisers see better returns. This quarter there was no gap, and that itself tells you something. Advertisers added budget to both platforms rather than moving it between them, and iOS held its share of ad spend at 53.42%, a single basis point off where it started.
The platform story is in impressions instead, and there the two moved in opposite directions:
- Android inventory change: +6.40% (increase)
- iOS inventory change: -5.40% (decrease)
Total impressions rose 1.57%, so the aggregate looks calm. Underneath it, iOS share of global inventory fell from 40.93% to 38.12%.
An inventory pool that shrinks 5.40% in the same quarter its ad spend grows 14.80% has only one way to resolve. It resolves in price, and the rest of this report is largely the story of that resolution.
Bottom line
Ad spend recovered this quarter and rose almost identically across both platforms. Android and iOS saw the same demand. What differed was how much inventory each had to meet it.
Ad spend by vertical
Seven of ten verticals grew.
Q1 put its growth into a handful of categories while the rest contracted. Q2 spreads growth across almost the whole map.
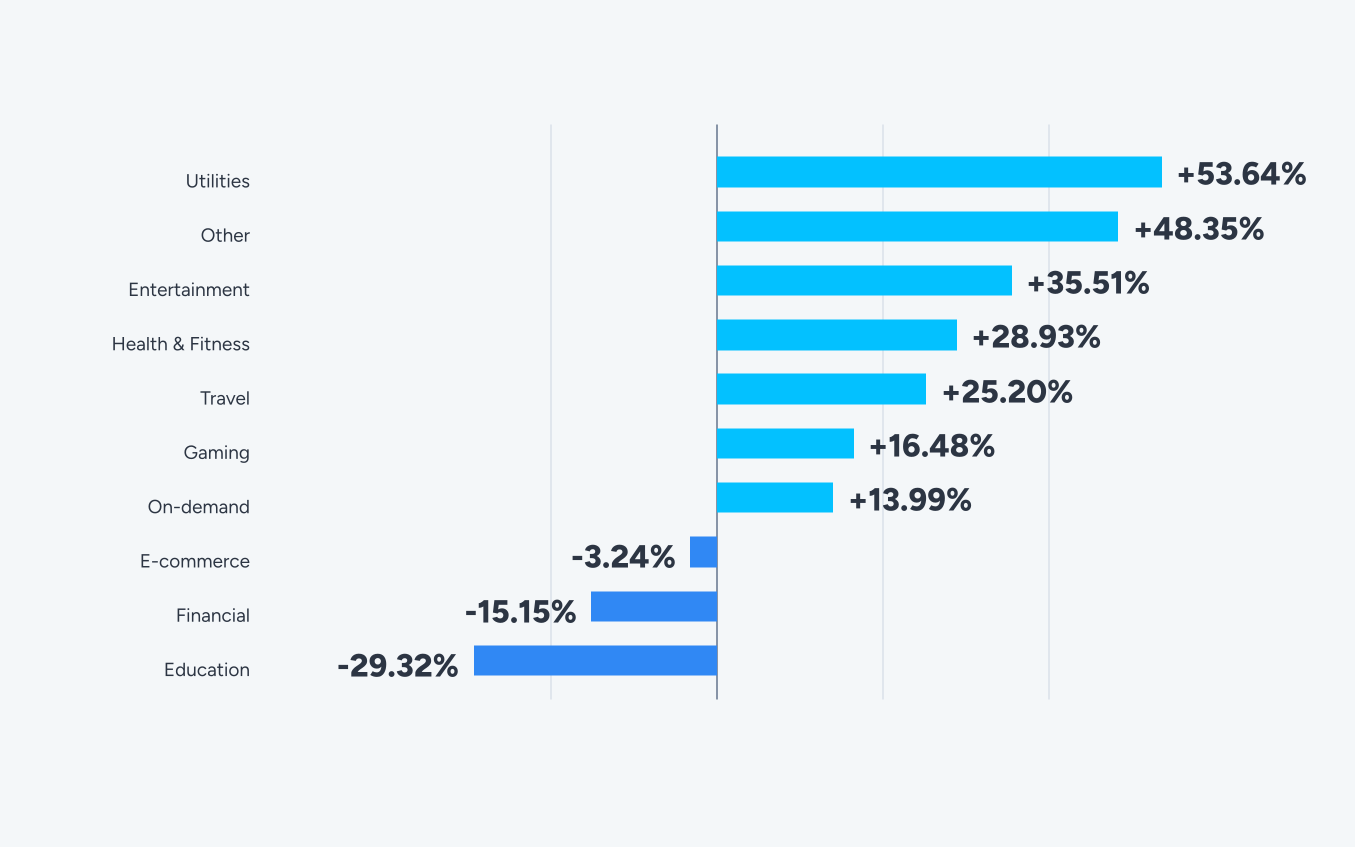
Gaming is the quarter’s story by weight rather than by rate. At 45.09% of all ad spend and 16.48% growth, it accounted for just under half the quarter’s total increase in ad spend. When a category that size moves with the market, it largely is the market.
On-demand, the second largest at 20.31% of ad spend, grew 13.99%. Also close to the global figure.
Utilities and Other led on rate. Both sit under 3% of total ad spend, so those percentages describe real momentum in small categories rather than a shift in where the industry’s money lives.
Entertainment is the one to watch on both measures. It grew 35.51% while holding 13.65% of global ad spend, its second consecutive quarter of strong expansion.
Financial and Education moved the other way. Financial is the more interesting of the two, because its CPI fell further than its ad spend did, at 25.60%.
Bottom line
Q1 rotated, Q2 expanded. The two largest verticals grew roughly in line with the market, the small categories grew fastest, and all three contracting verticals became cheaper to enter. Financial runs a distinct trend this quarter. Its CPI fell from $2.94 to $2.19 while spend dropped 15.15%, so advertisers who stayed bought the most expensive vertical at a quarter off.
Ad spend by region
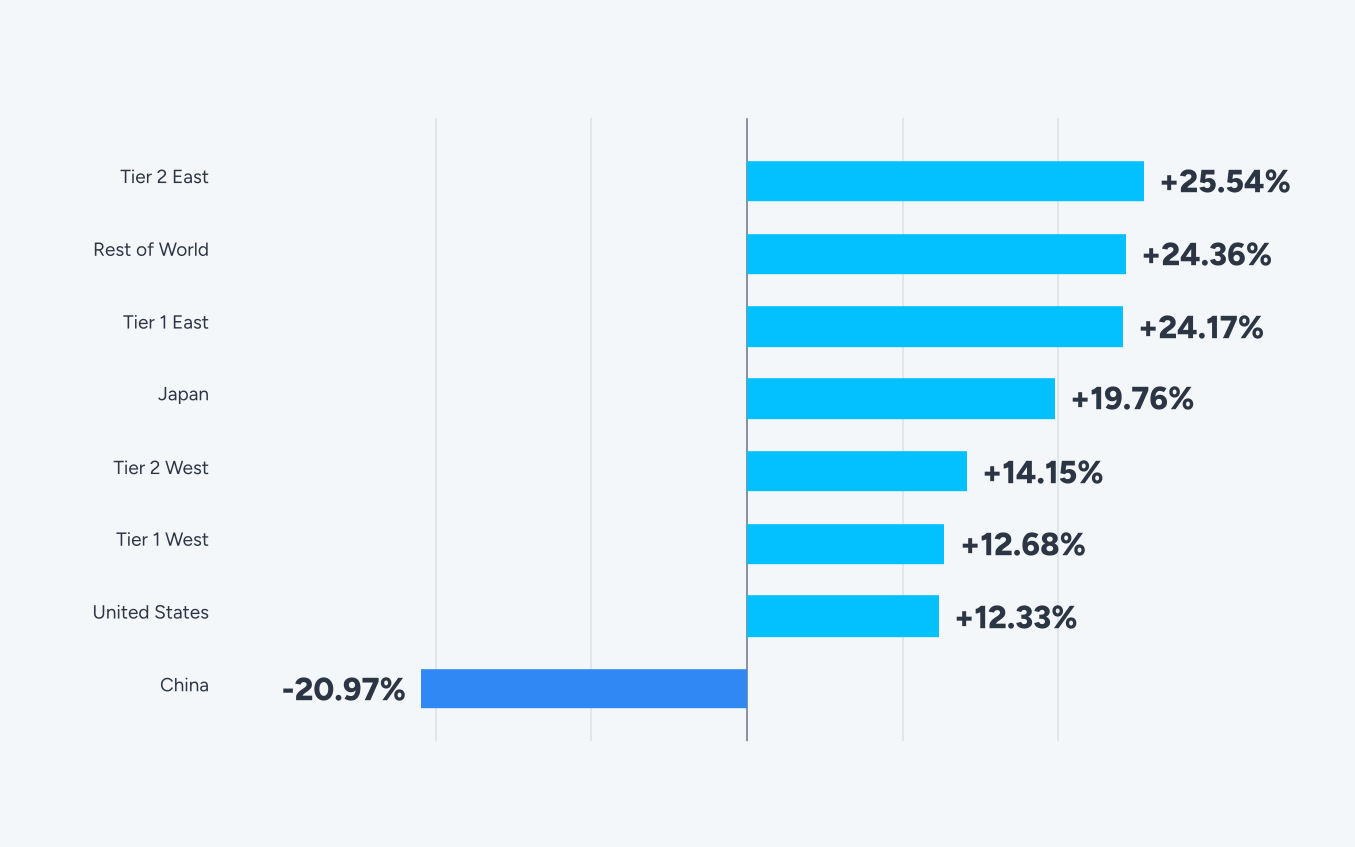
Growth was close to universal. Seven of eight region tiers moved up in their ad spends, and the spread between them is narrower than in any recent quarter.
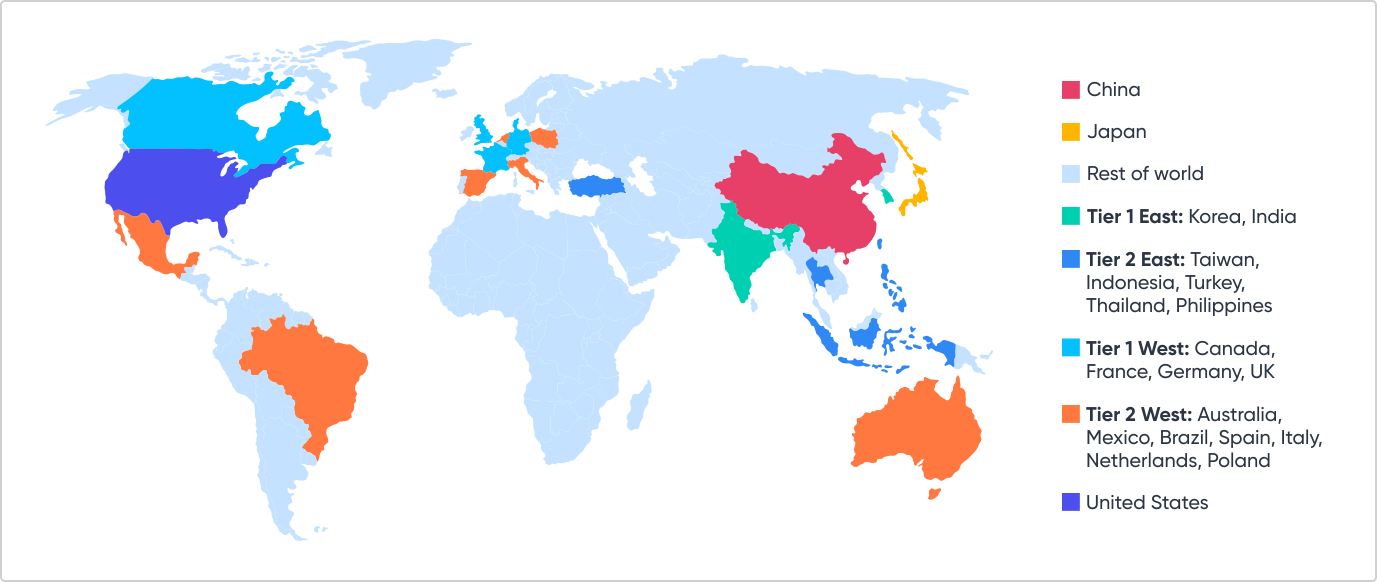
Tier definitions: Tier 1 West = Canada, UK, France, Germany. Tier 1 East = Korea, India. Tier 2 West = Australia, Mexico, Brazil, Spain, Italy, Netherlands, Poland. Tier 2 East = Indonesia, the Philippines, Thailand, Taiwan, and Turkey. Japan and China are tracked independently.
Tier 1 East had the healthiest quarter in the report. Ad spend rose 24.17% into impressions that rose 21.47%, the only tier where supply expanded nearly as fast as demand. That balance keeps unit costs contained, and it shows up later where Tier 1 East remains the cheapest market on both platforms.
The United States held its position at 59.11% of global ad spend and grew 12.33%. Its impressions fell 2.67%.
The same shape appears in Tier 1 West, Tier 2 West and Rest of World: ad spend up between 12% and 25%, impressions down. Four of the five largest markets absorbed more budget into less inventory this quarter.
That single pattern explains most of the cost movement in the rest of this report.
Tier 2 East led all tiers at 25.54% growth with impressions up 4.65%, and Rest of World followed at 24.36%. These are the markets that absorb overflow when premium inventory tightens, and Q2 gave them plenty to absorb.
China contracted 20.97% on a base of 0.02% of global ad spend. Therefore, we report the direction and leave it there.
Bottom line
Almost every market grew, which is not the interesting part. The interesting part is that impressions fell in four of the five biggest spending markets while budgets rose in all of them. That is a supply story wearing a demand story’s clothes.
With the spend picture in focus, the next layer is measurement infrastructure. How much of iOS activity can advertisers actually track?
ATT and IDFA availability
ATT opt-in rates measure the share of iOS users granting tracking permission at app open. Rates vary by vertical, driven by the perceived value exchange between users and apps.
The overall Q2 2026 opt-in rate is 9.99%.
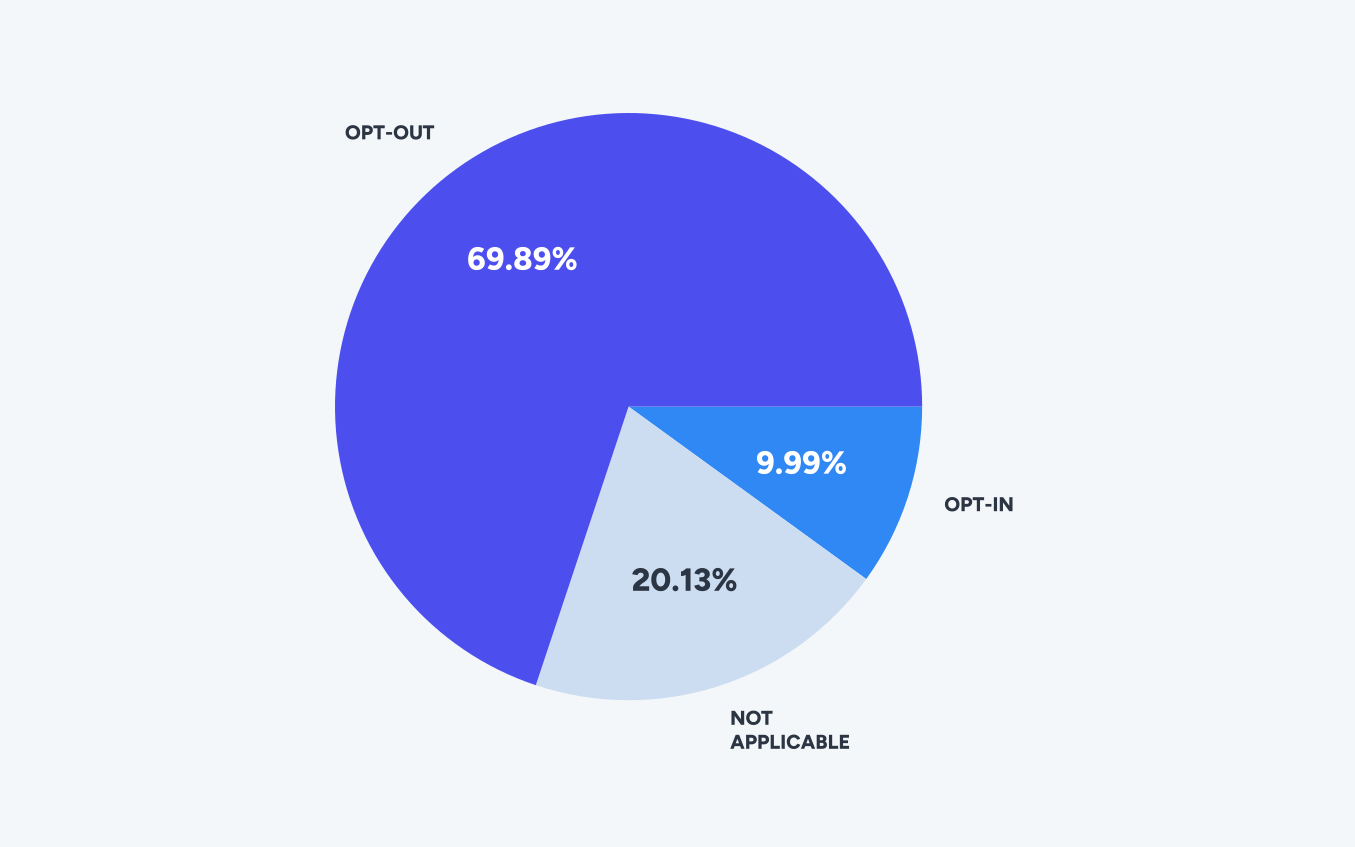
ATT acceptance by vertical
The spread across verticals is wider than the headline suggests, and it follows a logic that has held for years. Users consent where the app visibly works better for it, and decline where the app works the same either way.
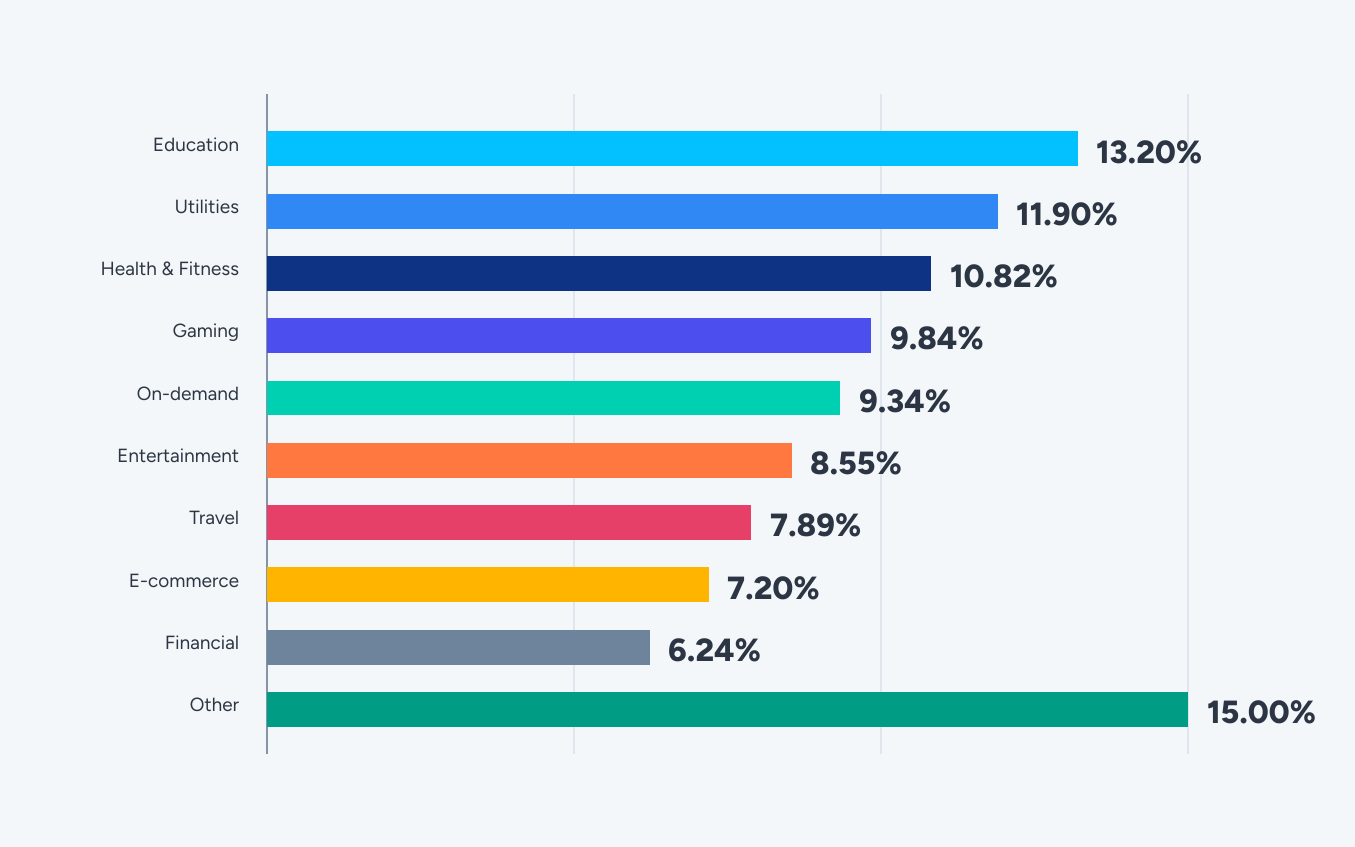
There is a pattern worth pulling out of the chart.
Setting the Other category aside, since it groups mixed apps rather than describing a single vertical, the spread runs from 13.20% at the top to 6.24% at the bottom, and the ordering is not random. Education, Utilities and Health & Fitness lead, all categories where personalization visibly changes what the app does. Financial and E-commerce sit at the bottom, where users are handling money and see little in return for consenting.
Gaming and On-demand together carry 65.40% of global ad spend, and both land just under the all-vertical rate at 9.84% and 9.34%. Two thirds of the market’s budget therefore sits in categories where roughly nine users in ten are measured through modeled and aggregated signal rather than device identifiers.
That has been true long enough now that incrementality testing is part of the job rather than an extra.
Bottom line
The opt-in basis is new this quarter, so read the number as a starting point rather than a movement. What has not changed is the shape of the problem. The verticals with the most budget have the least direct measurement, and the distance between where money sits and where signal sits keeps widening.
Tracking availability sets what you can measure directly. The headline cost and efficiency metrics cut across both platforms. How did CPI, CPM, CTR and IPM move in Q2?
Global metrics: big picture
All four headline metrics rose. On price, CPM led at 13.00% with CPI following at 8.47%. On efficiency, CTR reached 5.41% and IPM 2.30.
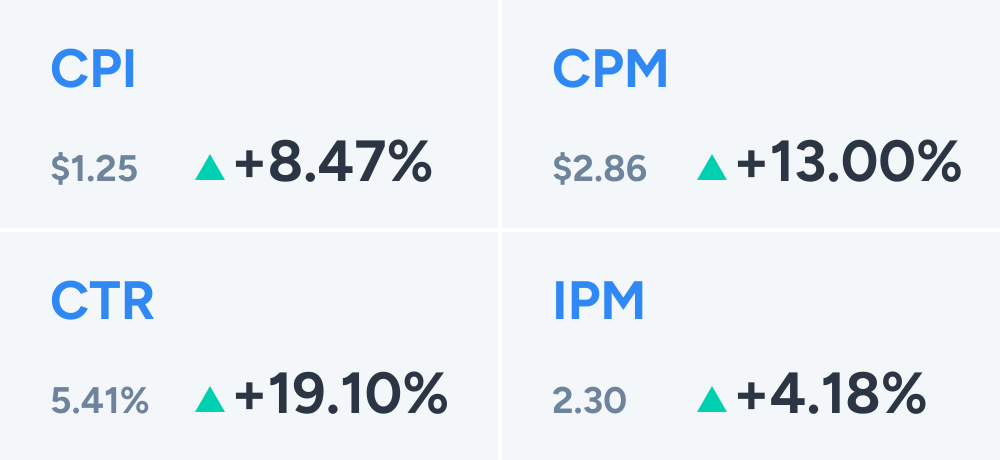
CPM led the increase this quarter. That is the single most useful fact in this section.
Advertisers paid 13.00% more for the impression itself, and roughly two thirds of that carried through to the install. The cost pressure originated in the auction, upstream of anything a campaign controls.
The platform split explains most of it. Android CPM rose 7.84% on impressions that grew 6.40%. iOS CPM rose 21.36% on impressions that fell 5.40%.
Because iOS carries 53.42% of spend, its price movement dominates the global figure. One quarter, two platform stories.
IPM rising 4.18% is the quarter’s quiet good news, and its second consecutive increase. More installs are arriving per thousand impressions than two quarters ago.
Conversion improved, but media prices rose faster, so costs went up anyway. Conversion is something you can work on, but not auction prices.
The 19.10% increase in CTR warrants the same methodological note we carry each quarter. CTR figures continue to be influenced by rewarded ad formats, SKOverlay behavior, and other mechanics that trigger clicks without equivalent user intent. Treat CTR as a relative metric within campaign types rather than a proxy for engagement quality.
Bottom line
Media cost drove the quarter and conversion quietly improved underneath it. If your CPI rose roughly 8% in Q2, the honest diagnosis is that you paid market rate in a market that got more expensive. Reworking creative will not fix an inventory shortage.
The global metrics show the headline. The regional and vertical breakdown shows where to act. Which platforms and markets absorbed the increase?
CPI deep dive: geos, verticals, genres
CPI by OS
CPI rose on both platforms, and iOS rose faster. Android increased 7.51% to $0.73, while iOS increased 11.79% to $3.19.
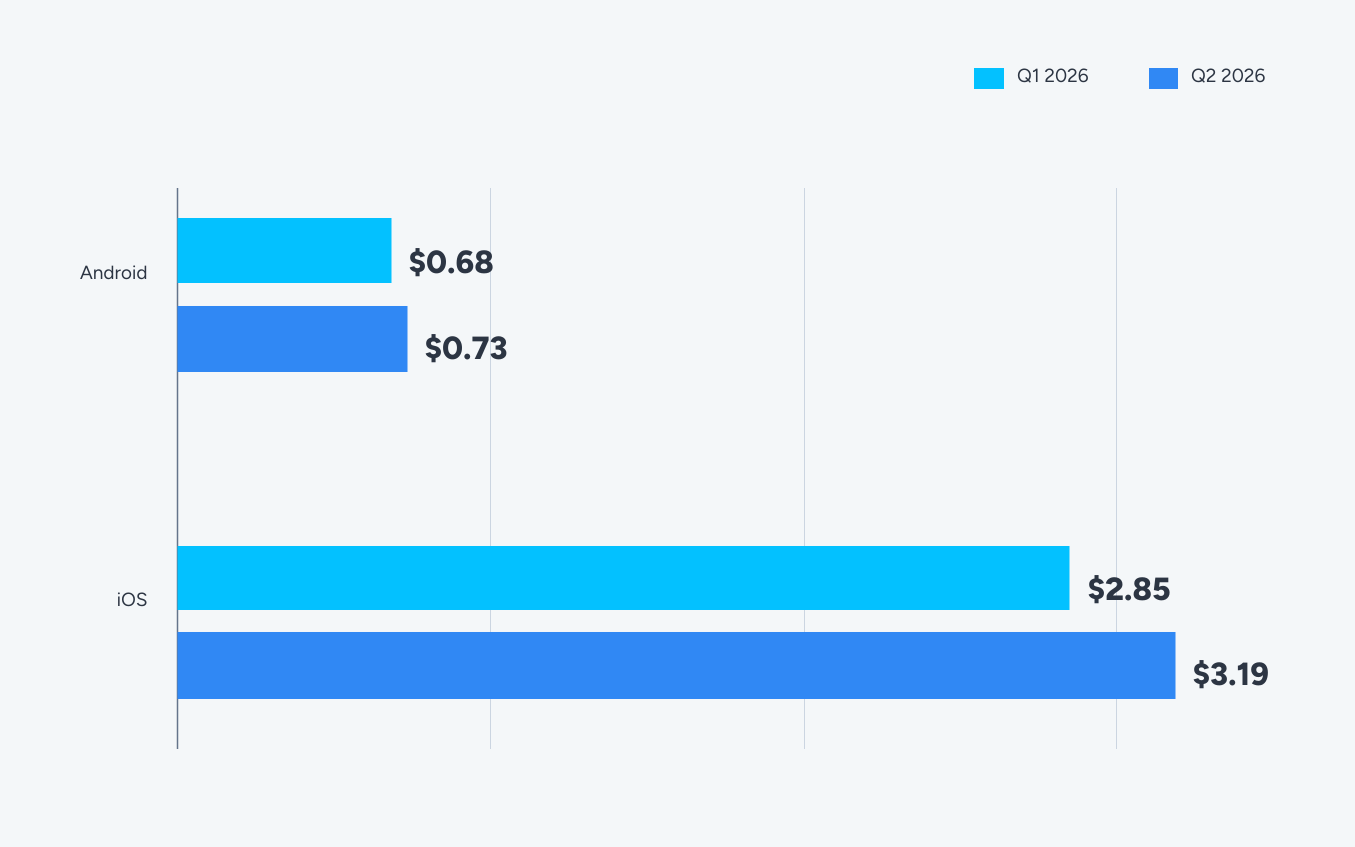
Android tracked its own supply and demand almost exactly. Spend rose 14.73% against impressions up 6.40%, so roughly half the additional budget found additional inventory and the rest showed up in price.
iOS had no such relief. Spend rose 14.80% into inventory that contracted 5.40%, and an 11.79% CPI increase follows from that arithmetic.
The iOS-to-Android gap widened from $2.17 to $2.46. The multiple moved from 4.18x to 4.37x.
If you plan iOS budgets against a fixed multiple, that is the number that keeps moving under you.
Bottom line
Both platforms got more expensive, iOS by more, and the cause on iOS was supply rather than demand. Budget models built on a fixed iOS premium keep missing, because the premium is not fixed.
CPI by region
The regional picture is where the supply story becomes actionable.
Android CPI rose in seven of eight tiers. Same for iOS, which also rose in seven of eight. The size of each increase tracks impression availability closely.
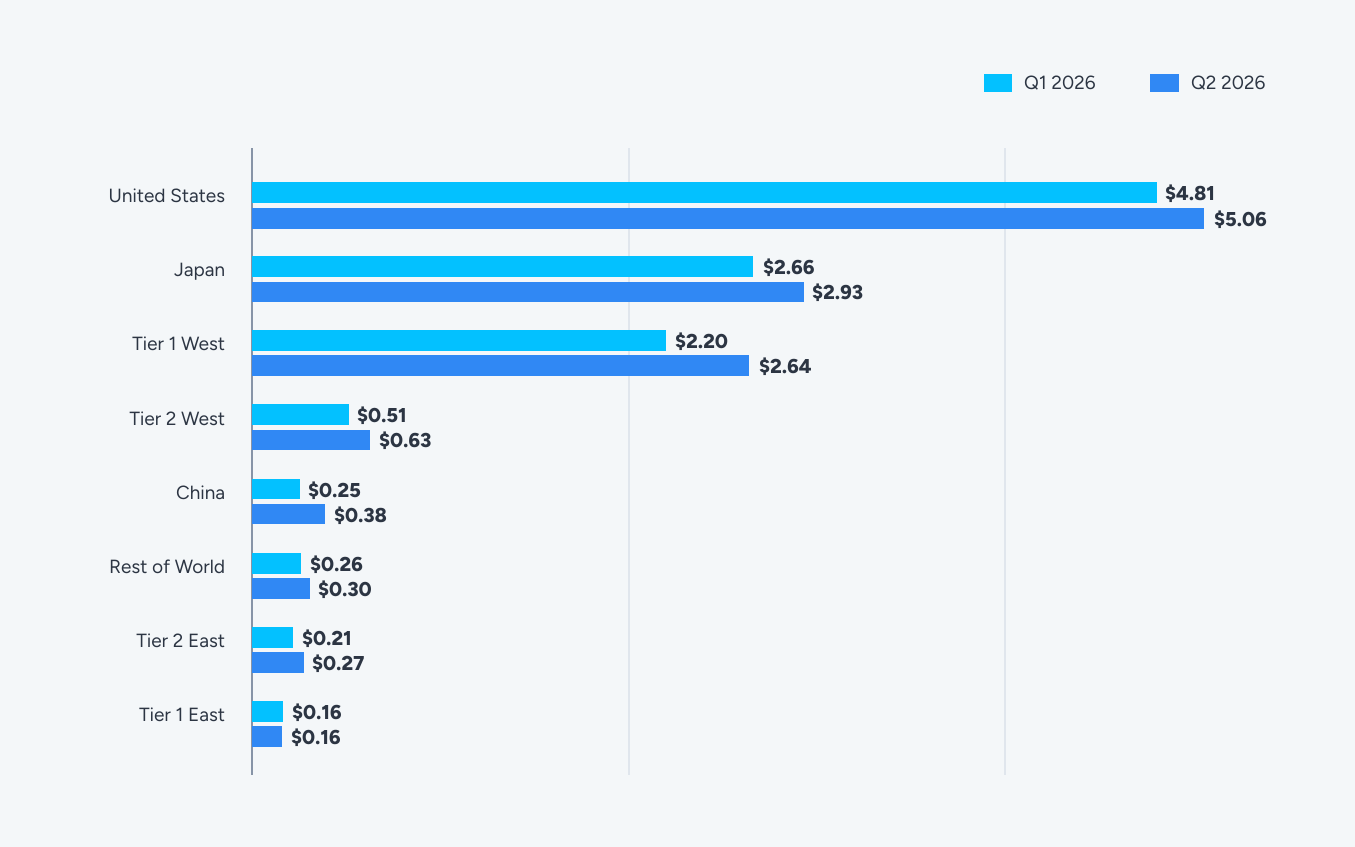
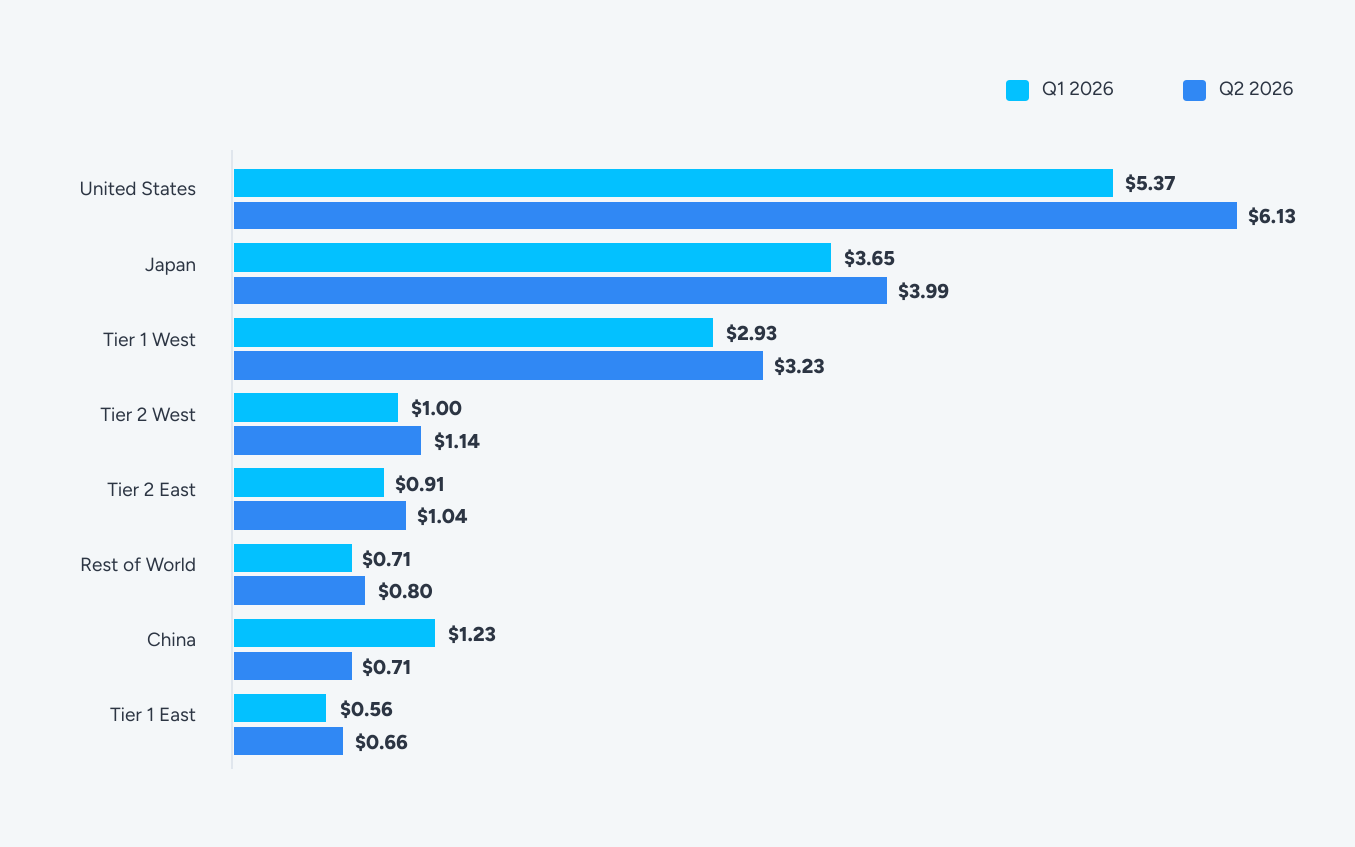
The United States remains the most expensive market on both platforms, and it had the mildest Android increase of any tier at 5.3%. Premium markets are already priced, so they have less room to move.
China saw the sharpest Android increase at 52.9%, and it runs the only iOS decline in the report at 42.4%. Both sit on a base of 0.02% of global ad spend. Among the larger tiers, Tier 2 East led on Android at 25.9%, with Tier 2 West at 22.1% and Tier 1 West at 20.1%, while every tier outside China saw iOS rise between 9.3% and 17.9%.
Emerging markets absorbed the overflow from tightening premium inventory, and their prices moved accordingly. A market stays cheap only until enough budget finds it.
Tier 1 East is the exception worth studying. It is the only tier where Android CPI fell, and the only tier where impressions grew more than 20%.
It took on a 24.17% spend increase and still finished as the cheapest market in the dataset on both platforms.
Bottom line
Cost rose fastest where inventory contracted and fell only where inventory expanded. Tier 1 East is the argument for building presence in a market before you need the capacity.
CPI by vertical
Financial and Health & Fitness remain the most expensive categories globally, driven by downstream value and competition for qualified users. Travel joined them this quarter.
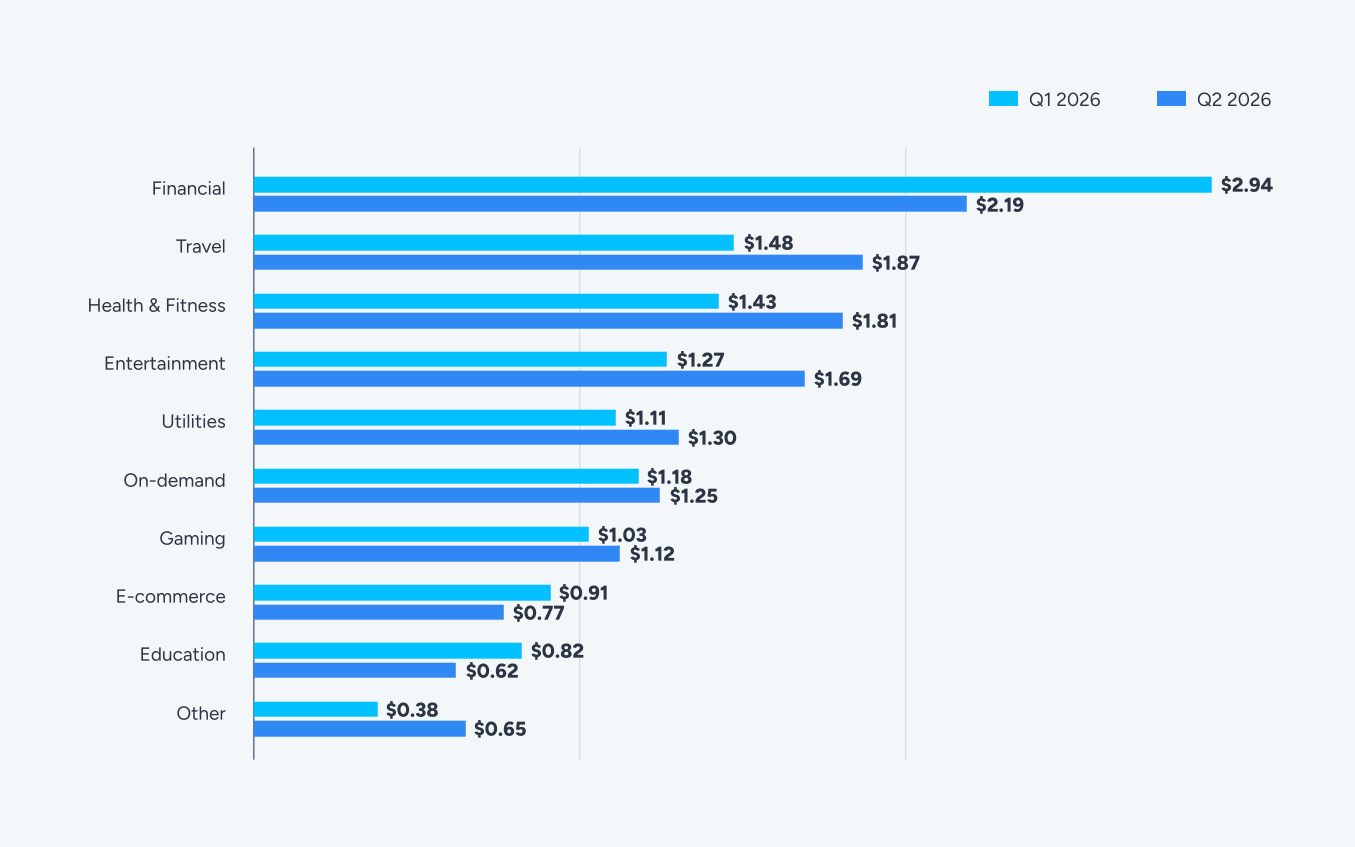
Financial is the clearest signal in the section. CPI fell 25.60% while spend fell 15.15%, so price dropped faster than budget.
Education repeats the pattern at smaller scale, with CPI down 24.36% against spend down 29.32%.
Both categories cost less to enter now than they did three months ago. In Financial’s case that discount applies to the most expensive non-gaming vertical in the report.
At the other end, the Other vertical rose 71.26% on spend that grew 48.35%. Cost and budget rising together at that rate indicates real competition rather than a supply artifact.
Entertainment shows the same shape at 33.24% CPI on 35.51% spend. Travel and Health & Fitness follow at roughly 27% each.
Gaming rose 9.30%, close to the global average of 8.47%, which is what you would expect from the category that sets that average.
CPI by vertical and OS
The chart below shows global average CPI by vertical for Q2 2026, across both Android and iOS. Use it to calibrate relative vertical cost and the iOS premium before campaigns launch.
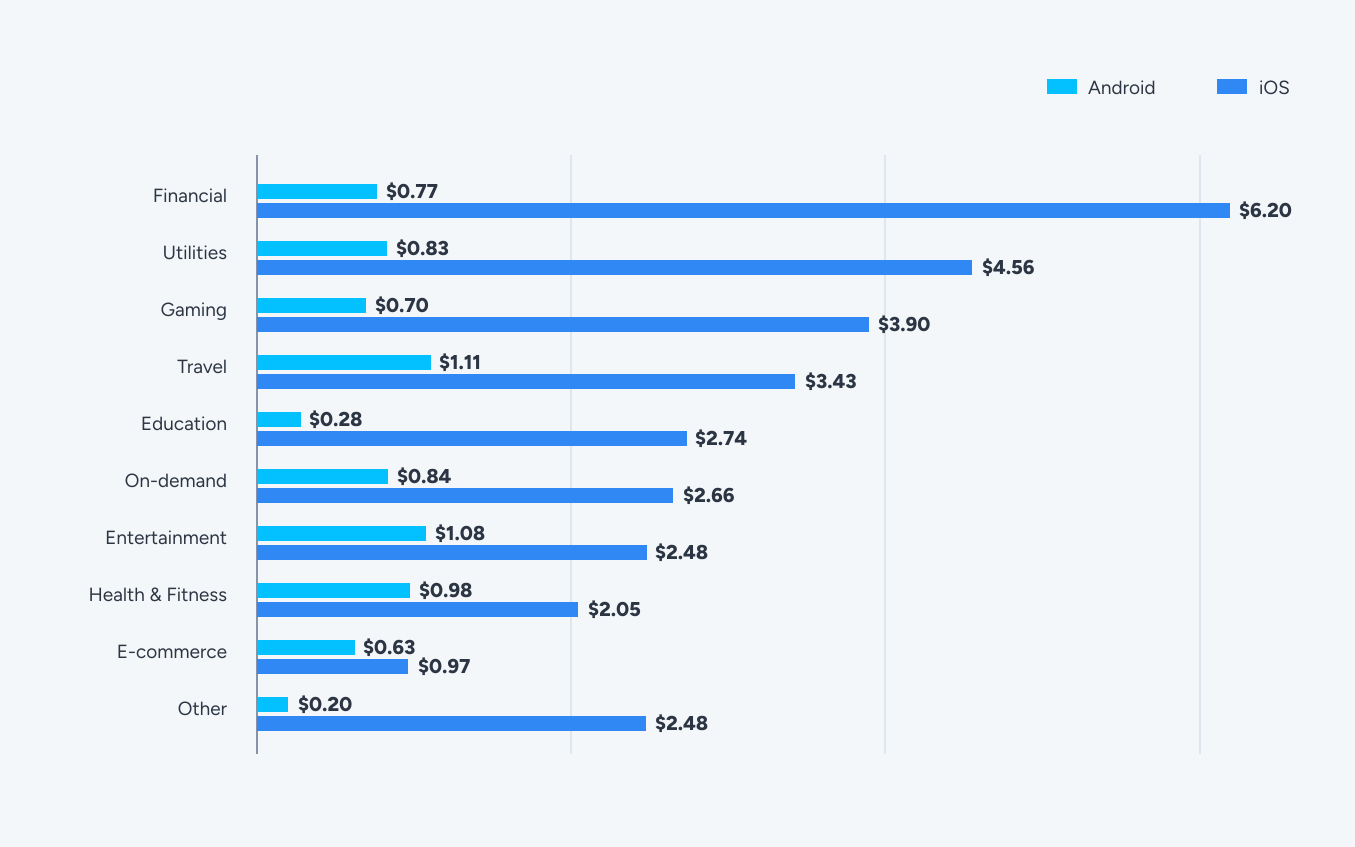
On Android, CPI stays close to or below $1 for most verticals. Travel at $1.11 and Entertainment at $1.08 are the only two above it.
On iOS, Financial at $6.20 is more than 8 times its Android equivalent and the most expensive vertical on the platform.
The premium is not uniform, which is what makes this chart worth reading closely. The Other vertical runs 12.4x and Education 9.8x. Health & Fitness runs 2.1x and E-commerce 1.5x.
A blanket 4x iOS assumption overpays in Health & Fitness by roughly double and underfunds Education by more than half.
Health & Fitness and E-commerce are the two most platform-neutral categories in the report. In both, the case for weighting toward iOS rests on lifetime value rather than acquisition cost, because acquisition cost barely differs.
Bottom line
The iOS premium ranges from 1.5x to 12.4x depending on the category. Target iOS where lifetime value justifies the multiple. Shift toward Android where the two platforms sit closer to parity than your budget assumes.
CPI by game genre
Gaming CPI follows a power-law distribution, and Q2 2026 keeps that shape. A small number of genres operate in their own pricing tier while a long tail sits below a dollar and barely moves.
On Android, Casino ($13.62) and RPG ($6.09) sit well above everything else. Party, Strategy and Hypercasual form a mid-range cluster between $2 and $6. Below that, the long tail of puzzle, casual and educational genres stays at or below $1.
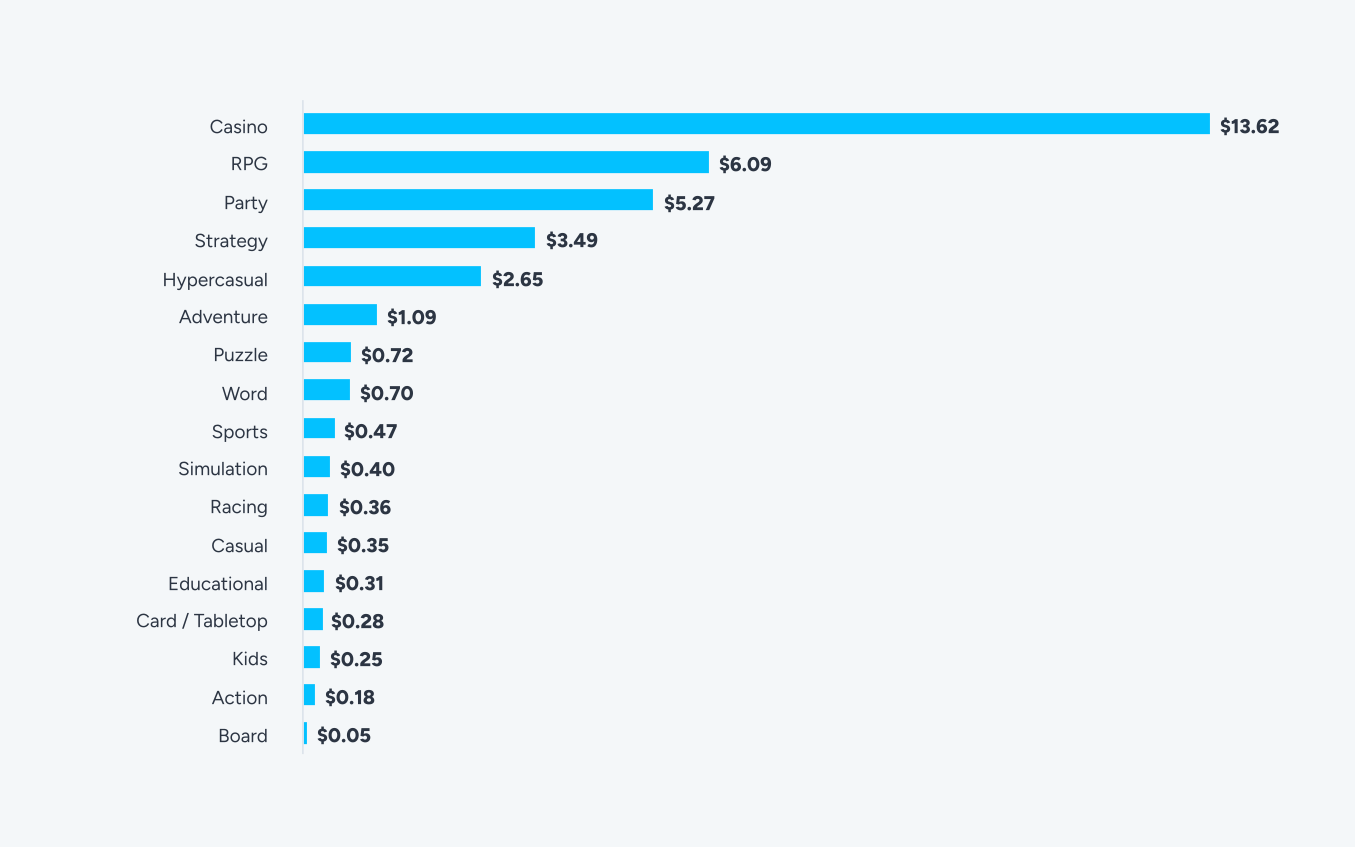
On iOS the spread widens. Casino ($24.70) and RPG ($19.16) lead by a wide margin, and the mid-tier clusters between $3 and $10.
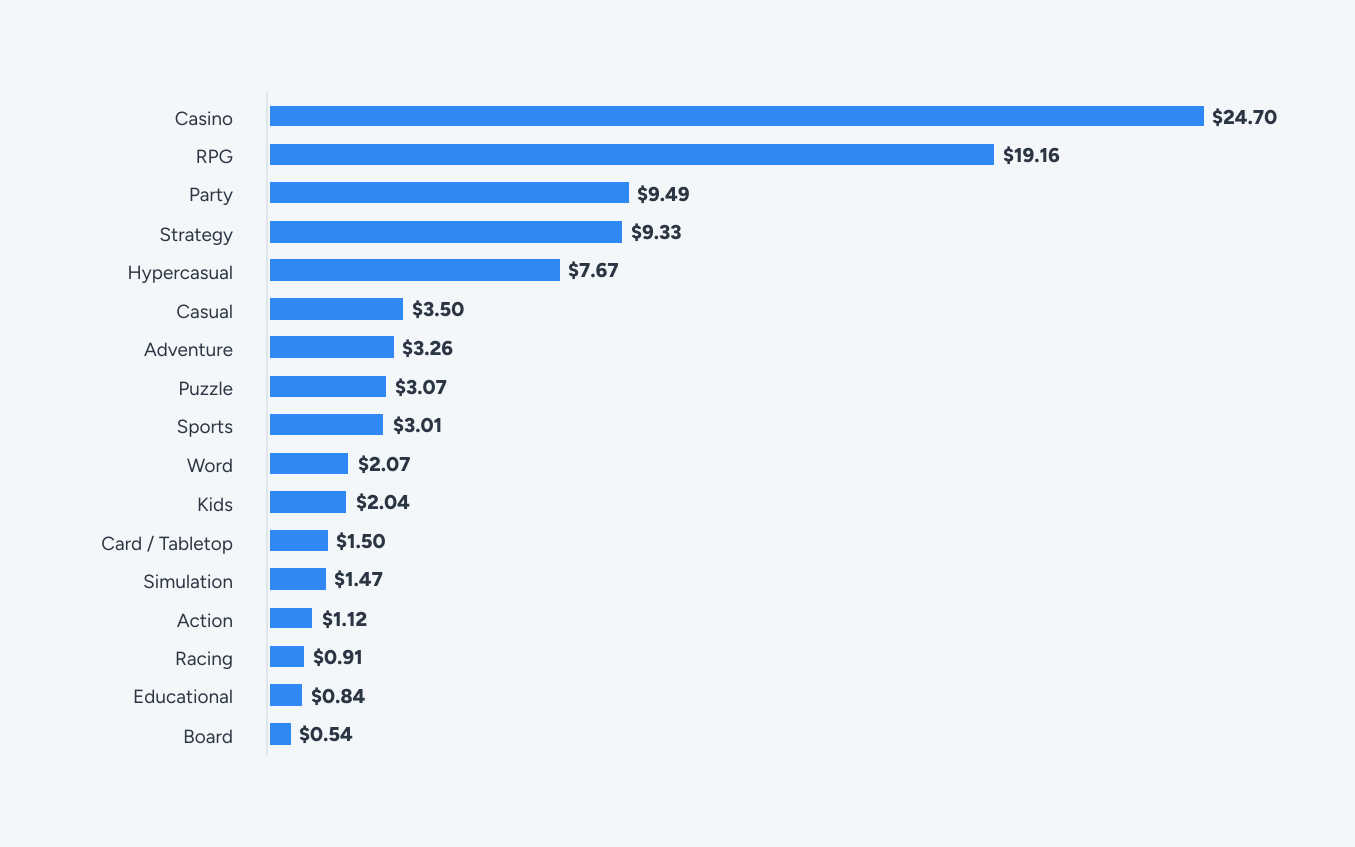
Casual runs a 10x platform gap, at $0.35 on Android and $3.50 on iOS, which points at a monetization model that only justifies iOS pricing in specific markets.
These figures are Q2 2026 levels rather than movements. Genre comparison against previous reports is not available this quarter, because the genre taxonomy changed at source.
Bottom line
Premium genres stayed premium and the tail stayed cheap. If you are buying Casino or RPG installs on iOS, your lifetime value model needs to carry a cost thirty-five to forty-five times the cheapest genre on the platform. That arithmetic does not improve by bidding harder.
The CPI picture shows where costs sit at market level. To calibrate against your own category, channel and geography, the following section provides the full regional and vertical benchmark table.
Key metrics by country tier and vertical
Singular’s regional tier system organizes the data below. All performance metrics are Q2 2026 figures from Singular’s dataset, and they represent the performance of actively marketing apps that invest significantly in paid user acquisition.
These benchmarks are pre-launch calibration tools. Set your pass and fail thresholds here before a test launches, not after a campaign runs.
This is the section to come back to every time you price a new market or defend a target to a finance team.
Here’s the data:
Full benchmark table. Cells marked – are not reported for this period. Coverage varies by market and vertical, and figures are published only where they meet our reporting thresholds.
Key regional insights
United States: the most expensive market in the report
- Financial iOS carries a CPI of $11.52, the most expensive vertical and platform combination in the report
- Entertainment CPI is almost identical on both platforms, at $8.88 Android and $8.86 iOS, the tightest platform parity in the report.
- Utilities Android carries the highest CPM in the dataset at $27.96, and still returns an IPM of 4.90
- Health & Fitness Android delivers an IPM of 8.07, the strongest conversion rate of any US combination
- The mildest Android cost increase of any tier at 5.3%, because premium markets have less room to move
China: wide variance between verticals
- Utilities Android combines a CPI of $0.0615 with an IPM of 14.65, the second cheapest CPI and third highest IPM in the report
- On-demand Android follows with a CPI of $0.1363 and an IPM of 10.47
- Health & Fitness iOS at $6.79 CPI and On-demand iOS at $6.49 CPI are the most expensive positions in the market
- Efficiency swings hard between platforms within the same vertical, so this market rewards selective, vertical-by-vertical buying rather than a blanket approach
- Spend fell 20.97% while impressions rose 6.93%, the only tier where spend contracted and supply expanded, on a small base of 0.02% of global ad spend
Japan: high intent, high value, high cost
- Financial Android carries a CPI of $8.73, the most expensive vertical in the market
- Education Android is the efficiency standout, at a CPI of $0.447 with an IPM of 6.56
- Utilities Android combines a CPM of $12.22 with an IPM of 8.58, the best volume position in the market
- Cheaper than the United States on both platforms across most verticals
Tier 1 West: premium inventory with strong conversion
- E-commerce Android at $5.75 CPI and Financial Android at $5.37 CPI are the most expensive positions in the tier
- Utilities Android delivers an IPM of 8.60 against a CPM of $17.37, the highest CPM outside the United States
- The Other vertical on Android has a CPI of $0.818, the cheapest combination available in any Tier 1 West position
- Android CPI rose 20.1% while impressions fell 3.84%
Tier 1 East: the efficiency benchmark
- Utilities Android pairs a CPI of $0.122 with an IPM of 20.75, the highest IPM in the report
- Gaming Android runs a CPI of $0.176 with an IPM of 5.27, the most efficient Gaming position in the report
- Cheapest tier on both platforms, at a blended CPI of $0.16 on Android and $0.66 on iOS
- The only tier where Android CPI fell, and the only one where impressions grew more than 20%
Tier 2 West: scalable growth at contained cost
- Utilities Android delivers an IPM of 12.65 on a CPI of $0.510, the strongest conversion position in the tier
- The Other vertical on Android delivers an IPM of 8.20 at a CPI of $0.202
- Travel is the most expensive vertical here, at a CPI of $2.86 on iOS and $2.07 on Android
- Impressions fell 7.59% while Android CPI rose 22.1%, the second sharpest Android increase outside China
Tier 2 East: volume at the lowest prices in the report
- The Other vertical on Android at a CPI of $0.105 and Utilities Android at $0.193 are the cheapest positions in the tier
- Gaming Android combines scale and efficiency at a CPI of $0.214
- Led all tiers on spend growth at 25.54%, with impressions up 4.65%
- Android CPI rose 25.9%, the sharpest increase outside China
Rest of World: cheap reach with variable quality
- Utilities Android pairs a CPI of $0.208 with an IPM of 13.60, the fourth highest IPM in the report
- Entertainment iOS has a CPI of $0.202, the cheapest Entertainment position in the report
- Travel Android is efficient at scale, at a CPI of $0.415 with an IPM of 4.56
- Spend grew 24.36% while impressions fell 1.53%
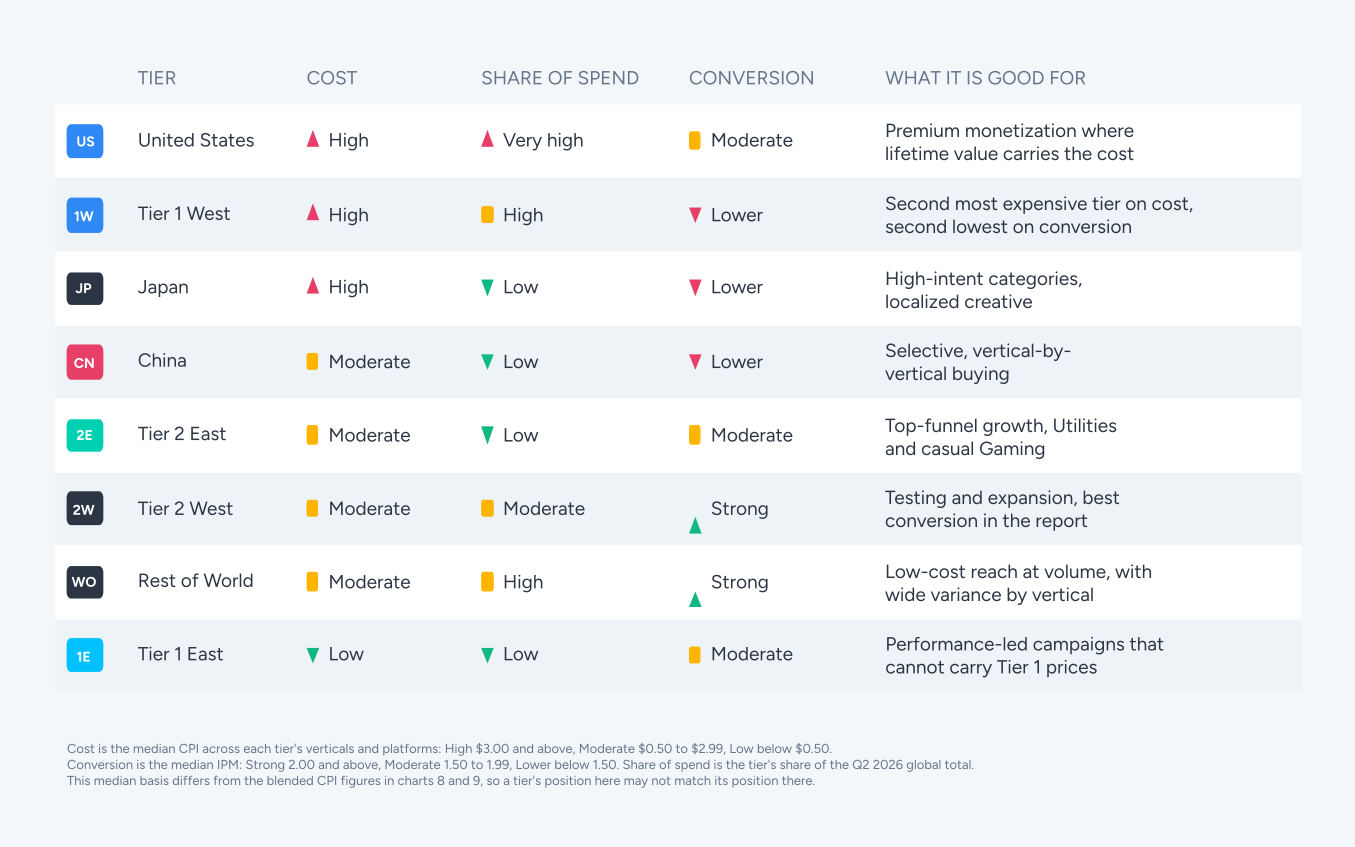
Country tier performance at a glance
Key vertical insights
Here are some of the insights we can draw from a vertical perspective:
Gaming
- Most efficient in Tier 1 East, at a CPI of $0.176 on Android with an IPM of 5.27, and Tier 2 East at a CPI of $0.214
- Most expensive in the United States, at a CPI of $5.09 on Android and $8.06 on iOS
- Holds 45.09% of global spend and grew 16.48%, so its movements largely set the global averages
Financial
- United States iOS carries a CPI of $11.52, the highest single figure in the report
- Most efficient in Tier 1 East, at a CPI of $0.098 on Android and $0.068 on iOS
- Blended CPI fell 25.60% against spend down 15.15%, so price dropped faster than budget
Entertainment
- Cheapest in Rest of World at a CPI of $0.202 on iOS, and Tier 2 East at $0.354 on iOS
- Most expensive in the United States, where Android and iOS CPI sit at near parity around $8.87
- Rest of World iOS delivers an IPM of 6.80, the strongest Entertainment conversion in the report
Utilities
- Among the cheapest Android positions in most regions, most notably China at a CPI of $0.062, Tier 1 East at a CPI of $0.122 and Tier 2 East at $0.193
- The four highest IPM positions in the report are all Utilities: Tier 1 East Android at 20.75, China iOS at 14.77, China Android at 14.65 and Rest of World Android at 13.60
- United States Android carries the highest CPM in the report at $27.96, and still converts at an IPM of 4.90
Travel
- Most expensive in Tier 1 West at a CPI of $5.11 on iOS, China at $3.76 on Android, and the United States at $3.52 on iOS
- Most efficient in Tier 1 East at a CPI of $0.142 on Android, and Rest of World at $0.415 with an IPM of 4.56
- Blended CPI rose 26.66% on spend that grew 25.20%, so cost and demand moved together
Health & Fitness
- United States delivers the strongest conversion in the vertical, with Android IPM at 8.07
- Most expensive in China at a CPI of $6.79 on iOS, then the United States at $2.94 on iOS and $2.59 on Android
- Runs one of the two most platform-neutral cost structures in the report, at a 2.1x iOS CPI multiple
On-demand
- Most expensive in China at a CPI of $6.49 on iOS, and the United States at $4.78 on Android
- Most efficient in Tier 1 East, at a CPI of $0.118 on Android and $0.406 on iOS
- Second largest vertical at 20.31% of spend, growing 13.99%
Education
- Most expensive in Japan at a CPI of $5.83, followed by China at $5.28 and Tier 1 West at $4.93, all on iOS
- Japan Android is the efficiency standout, at a CPI of $0.447 with an IPM of 6.56
- Spend fell 29.32% and CPI fell 24.36%, so the category is cheaper and less contested than it was
E-commerce
- Most expensive in Japan at a CPI of $6.44 on Android, and the United States at $6.08 on iOS
- Most efficient in Tier 1 East at a CPI of $0.209 on Android, and Rest of World at $0.138 on iOS
- Rest of World iOS delivers an IPM of 7.63, the strongest retail conversion in the report
Other vertical
- Most expensive in the United States at a CPI of $5.51 on iOS, and Tier 1 West at $3.54 on iOS
- Cheapest positions in the report: Tier 1 East Android at a CPI of $0.059 and Tier 2 East Android at $0.105
- Blended CPI rose 71.26%, the sharpest vertical increase in the report, on spend that grew 48.35%
Benchmarks tell you what acquisition costs. The next question is what those users are worth once they arrive, and which platform captures the value.
Monetization trends
Android drives scale and iOS drives value. That has been the working assumption for years.
Q2 2026 shows it holding in most categories and breaking clearly in two.
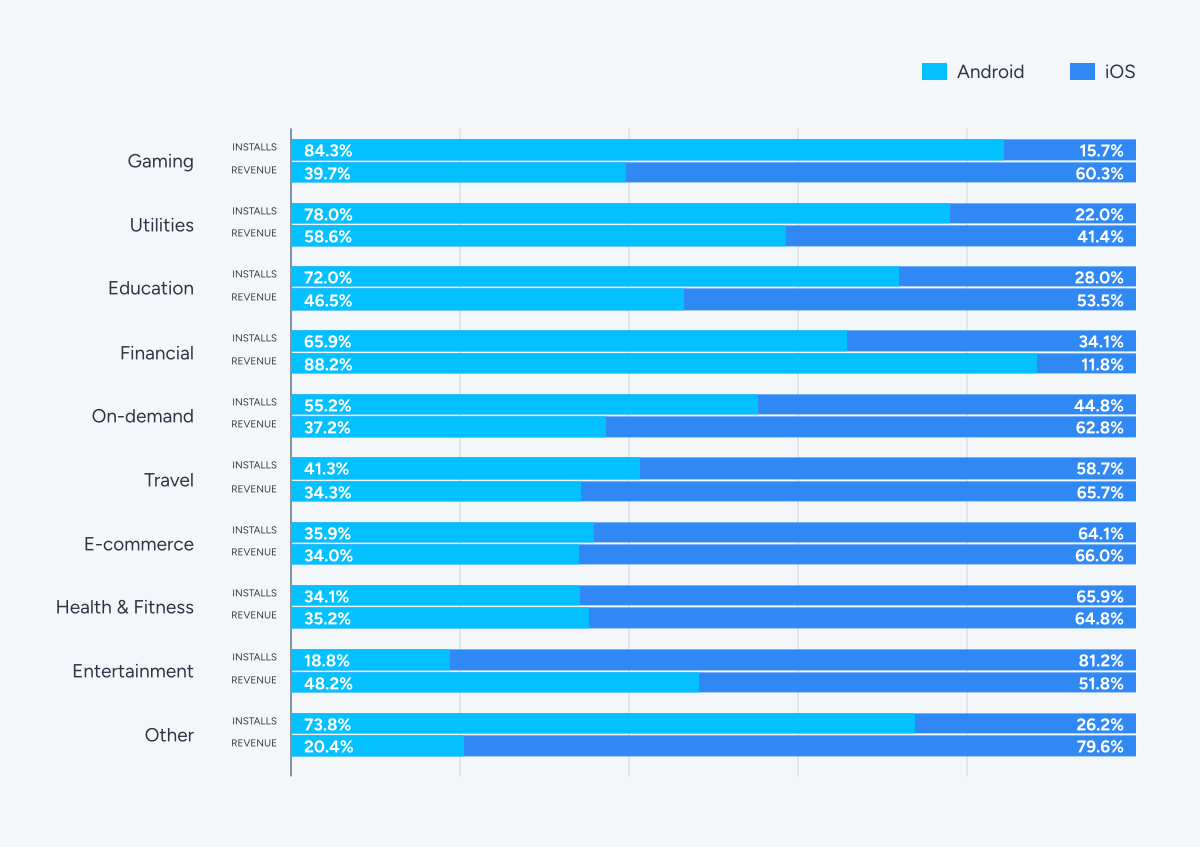
Gaming is the clearest illustration of the standard pattern. Android supplies 84.3% of installs while iOS takes 60.3% of 30-day revenue.
The install base is Android. The monetization engine is iOS. That has been true for as long as we have measured it.
The Other vertical runs the same shape, at 73.8% of installs against 20.4% of revenue.
Financial is the outlier, and by a wide margin.
Android holds 65.9% of installs and takes 88.2% of 30-day revenue, the strongest Android revenue position anywhere in the dataset. Close to nine dollars in ten come from Android in a category where most others split the other way.
That points at where fintech is actually growing, which is Tier 1 East and Rest of World, both Android-first markets where the vertical’s CPI runs under a dollar.
Utilities is the second Android revenue leader at 58.6%, consistent with an advertising-supported model and the platform constraints that limit the category’s iOS footprint.
Entertainment runs the opposite imbalance. Android takes only 18.8% of installs, the lowest of any vertical, yet contributes 48.2% of 30-day revenue.
The category acquires overwhelmingly on iOS and monetizes close to evenly, which makes each Android user worth several times an iOS one on a per-install basis.
Key insights by vertical
- Education: Android holds 72.0% of installs against 46.5% of revenue, over-indexing on installs relative to revenue by 25 points.
- E-commerce: installs and revenue sit close on both platforms. Neither holds a monetization premium.
- Entertainment: Android supplies 18.8% of installs but 48.2% of revenue, driven by ad-supported streaming on a large non-premium base.
- Financial: Android holds 65.9% of installs and 88.2% of revenue, the widest Android revenue majority in the dataset.
- Gaming: Android delivers 84.3% of installs while iOS contributes 60.3% of revenue.
- Health & Fitness: iOS leads both installs at 65.9% and revenue at 64.8%, consistent with a subscription-heavy model.
- On-demand: Android supplies 55.2% of installs and 37.2% of revenue, the most balanced install split of any large vertical.
- Other vertical: Android drives 73.8% of installs yet iOS captures 79.6% of revenue, the widest split between where installs come from and where revenue lands.
- Travel: iOS leads installs at 58.7% and revenue at 65.7%.
- Utilities: Android leads both installs at 78.0% and revenue at 58.6%, one of only two verticals where Android takes the majority of revenue.
Bottom line
Two verticals run Android revenue majorities this quarter, and Financial does so at 88.2%. The default assumption that iOS carries monetization holds in most categories and fails badly in a few, which is why platform strategy belongs at the vertical level rather than the company level.
Platform and vertical set where value comes from. The final data question is which networks captured the quarter’s additional spend.
Ad network share of spend: biggest winners
Every quarter Singular tracks which ad networks are gaining spend and advertisers among its customers.
Gaining spend means existing advertisers increased their allocation to that network. Gaining advertisers means new customers started using that network.
The strongest signal combines both. A network gaining spend from existing customers while adding new ones demonstrates durable, broad-based value.
All platforms combined
Basis spend: Google Ads led all networks on combined spend gained in Q2 2026. AppLovin ranked second and Moloco third, holding a top-five position as it has for several quarters.
Apple Ads placed fourth despite being an iOS-only channel. TikTok completed the top five.
Meta does not appear in the ad spend gained ranking this quarter. Its spend moved down 1.9% QoQ, and the gained-spend measure counts growth only, so a network holding flat or declining drops off the list entirely. This is a property of the metric rather than a judgment on the network, and Meta still leads on advertisers gained across all three cuts.
Basis advertisers: Meta led new advertiser additions, with Google Ads second and Moloco third. Moloco placing that high is unusual for a DSP, and it is the clearest sign in this quarter’s data that mid-market advertisers are adding programmatic partners.
TikTok ranked fourth and Apple Ads fifth, the latter consistent with its role as the standard iOS-first entry point for mobile UA teams. OpenAI enters the combined ranking in sixth, the first time an AI platform has appeared in this table, and places fifth on Android advertisers gained.
For most of the past decade the channel set has been effectively fixed. Search, social, programmatic, the app stores. New names appeared inside those categories, but the categories themselves did not move.
What has changed is where people go to ask. A growing share of app discovery now begins in a conversation with an assistant rather than a query box or a store listing, and advertisers have started buying into that surface.
The spend is still small next to the networks above it, and nobody needs to reallocate a budget this quarter. But this is the first genuinely new category of channel to enter this table in several years, rather than a new name inside an existing one. That is worth watching closely.
Index
Ad spend gained
Advertisers gained
1


2

3

4


5
6


7


8
9


10


Gainers by platform
Google Ads led Android spend gains, with AppLovin second and Moloco third. Adjoe and TikTok round out the top five.
On the advertiser side Meta led on Android, with Google Ads second, Moloco third, TikTok fourth and OpenAI fifth.
Index
Ad spend gained
Advertisers gained
1
2
3
4
5
6

7
8

9


10

Apple Ads led iOS spend gained, its strongest showing in this report.
Google Ads placed second and AppLovin third, with Moloco fourth and TikTok fifth.
The result follows the supply picture directly. iOS impressions contracted 5.40% while iOS spend grew 14.80%, and a search-intent channel is well positioned when impression supply tightens.
On iOS advertiser additions, Meta led, with TikTok second and Apple Ads third. Apple Ads adding the most iOS spend and ranking third on iOS advertisers is the strongest combined signal in this quarter’s network data.
Index
Ad spend gained
Advertisers gained
1
2
3
4
5
6
7
8
9

10
OpenAI is the only network in this quarter’s data to place on all three advertiser rankings and none of the three spend rankings. Advertisers are opening accounts faster than they are moving budget, which is what early adoption of a channel usually looks like.
The broader takeaway is diversification. Marketers are continuing to build multi-partner strategies that balance scale, intent and efficiency rather than relying on any single network to do everything.
Ad network share of voice by vertical
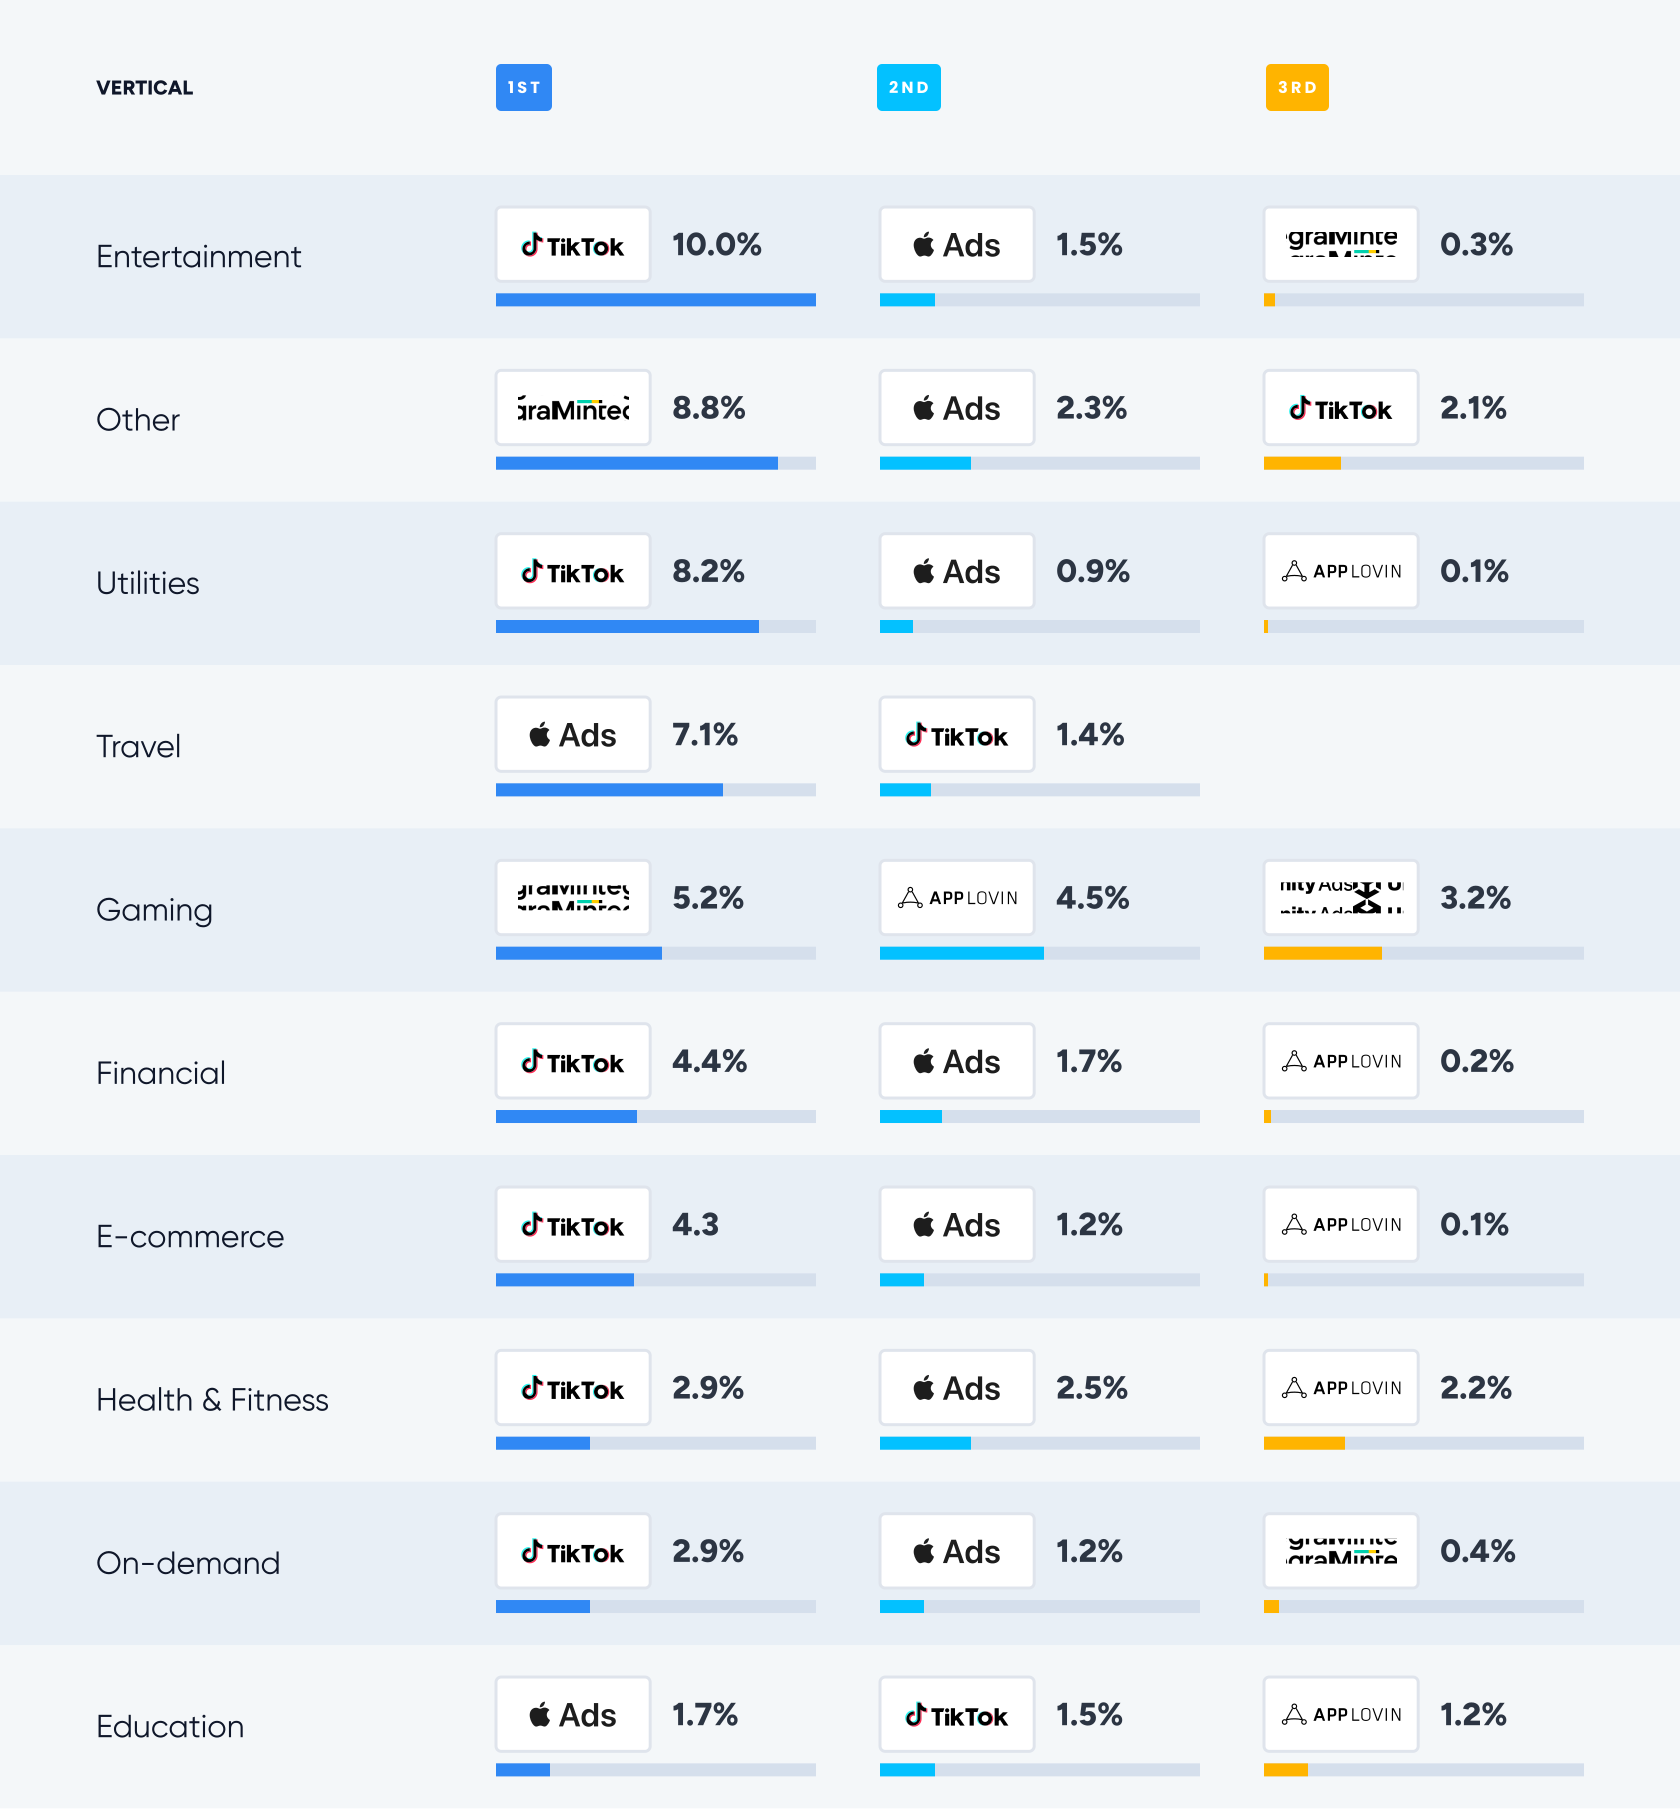
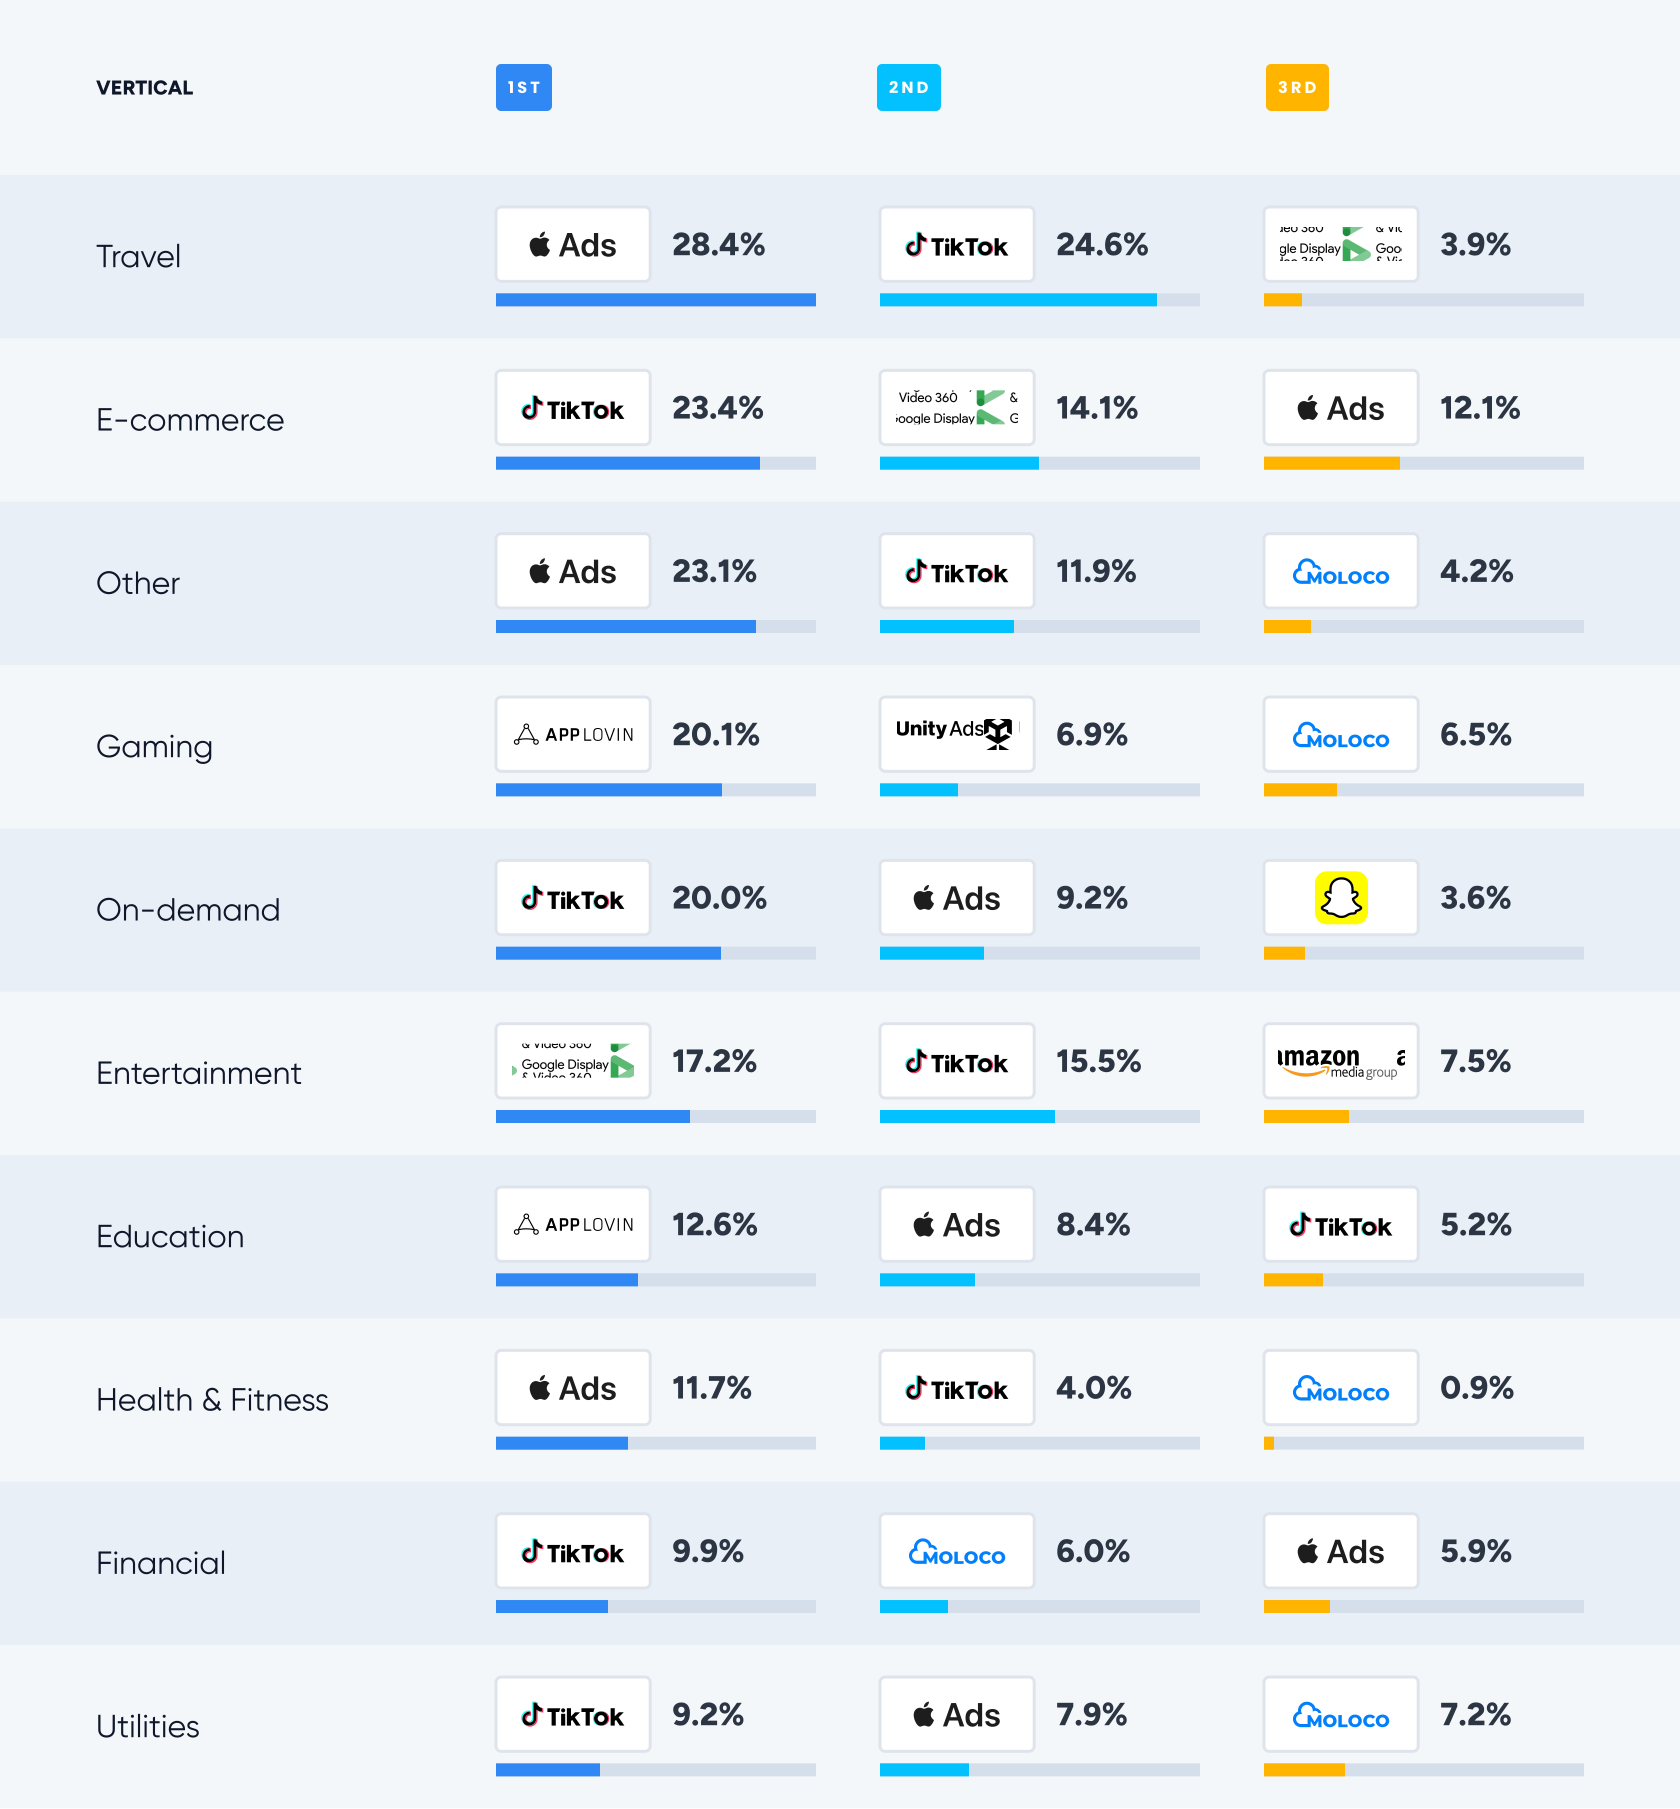
Important note: Google and Meta lead almost every vertical, so we have excluded them from these lists. The exclusion covers Google Ads and Meta’s owned placements only, not all Google-owned inventory. As you read each list of ad networks, mentally add Meta and Google to each.
Key findings
- Apple Ads owns the intent-driven verticals. Travel spend share at 28.4% is the highest single position for any non-Google or Meta network in the dataset, with Other at 23.1% and Health & Fitness at 11.7% following the same logic of users actively searching within a category.
- TikTok buys more efficiently than its peers. In Utilities its 8.2% install share runs close to its 9.2% spend share, where most networks show a much wider gap. It also holds the largest positions in the report for E-commerce at 23.4% of spend and On-demand at 20.0%.
- AppLovin concentrates in Gaming and Education. Its 20.1% Gaming spend share is the largest position any network holds in Gaming, and its 12.6% Education spend share leads that category.
- Mintegral leads on installs in two verticals, Gaming at 5.2% and Other at 8.8%. Only TikTok and Apple Ads top a vertical on install share anywhere else in the report.
- GCP (DV360) holds two distinctive positions and little else. Entertainment at 17.2% of spend and E-commerce at 14.1% reflect programmatic video buying for streaming and retail rather than a broad presence.
- Moloco appears across Gaming, Financial, Utilities and Other, and placed third on both combined spend gained and advertisers gained.
Bottom line
Beyond Google and Meta, vertical fit determines network value. Apple Ads owns high-intent iOS, TikTok owns retail and On-demand efficiency, AppLovin takes the largest share of Gaming and Education spend, Mintegral takes the most Gaming and Other installs, and Moloco is the broadest DSP challenger. The quarter’s clearest movement is Apple Ads leading iOS spend gained in the same quarter iOS impressions contracted.
That covers what Singular’s own data shows. Our partners this quarter add four views from outside the platform, on OEM inventory, retargeting and CTV, event-driven auction shifts, and AI-led app discovery.
Partner insights
AVOW

The OEM mix is expanding, and it’s playing out differently by vertical
OEM advertising covers ads and placements delivered through original mobile manufacturers such as Samsung, Xiaomi, Huawei, OPPO, and HONOR among others, directly on the device. AVOW puts the reach of the channel at over 1.85 billion daily active users globally, spanning 86% of the Android market.
Across that channel AVOW reports the same pattern regardless of category. Marketers are no longer choosing between reach-based inventory and intent-based targeting. They’re combining the two, and the results surface in different metrics depending on the vertical.
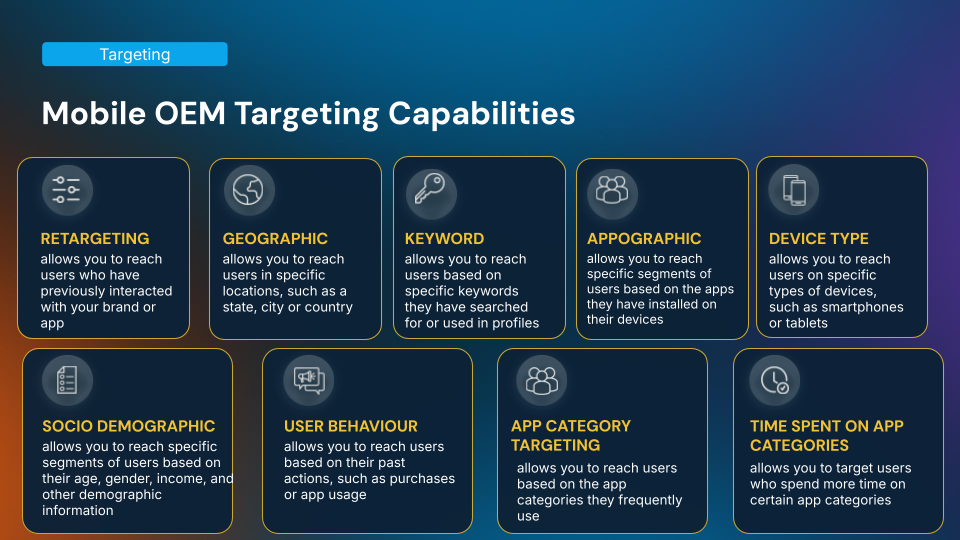
Mobile OEM targeting capabilities
1. Gaming: combining channels beats picking one
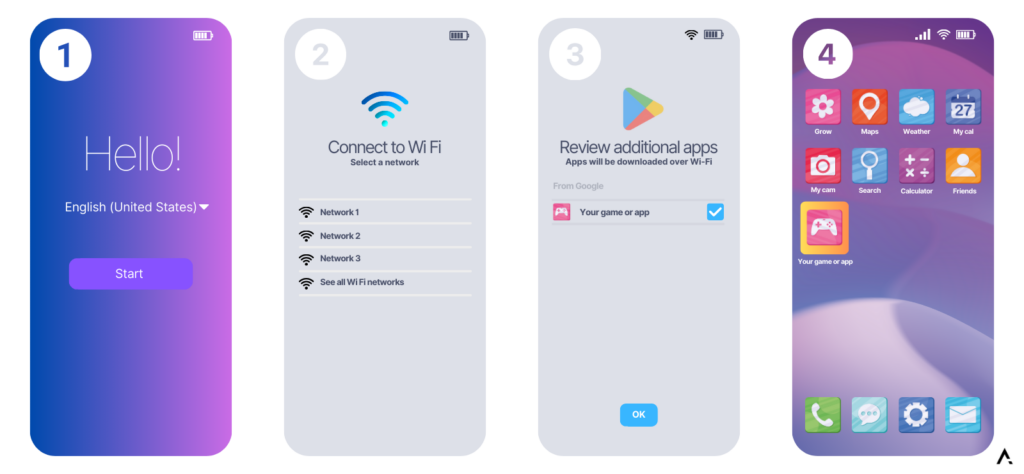
Tripledot Studios ran Display advertising alongside Dynamic Preloads (Google PAI) rather than relying on Preloads alone, and outperformed EMEA targets by 20%, with 15% higher performance than other preload-only campaigns.
Funvent Studios saw a similar effect, with Day 0 ROAS of 7% climbing to 18% by Day 7 alongside strong D1 and D7 retention.
AVOW’s read is that layering behavioral targeting and performance billing on top of reach-based inventory outperforms either approach on its own, so Dynamic Preloads and Display are a combination rather than a choice.
Dynamic Preloads user flow
2. Fintech: performance billing pays off hardest on high-value conversions
mPokket paired OEM and direct inventory to drive a 30% install-to-registration rate and a 15% registration-to-loan rate, contributing to a 60% increase in loan disbursements in a single month.
Fintech conversion events are expensive and high intent, which is where outcome-based buying shows the clearest ROI. The more valuable the downstream event, the more the shift matters.
3. E-commerce: reach with intent drives real purchase behavior
Magalu scaled its OEM investment 50% year over year while increasing average basket size and maintaining clean, fraud-free traffic. Milanuncios saw over 30% user growth with a 23% eCPA reduction.
In both cases the gain wasn’t only more installs, it was installs that converted into higher-value activity, which shows up in basket size rather than install counts.
The thread across all three, in AVOW’s view, is that marketers get the best results by adding intent-based targeting and performance billing on top of reach, rather than swapping one for the other.

Robert Wildner
CEO and Co-Founder, AVOW
Persona.ly

Incrementality becomes the new performance metric
Retargeting is no longer a nice-to-have. For most mobile advertisers it’s a permanent part of the marketing mix.
One of the clearest trends Persona.ly reports from its own campaigns is a growing emphasis on incrementality. The conversation has shifted from whether to invest in retargeting toward how much of the reported performance is actually incremental.
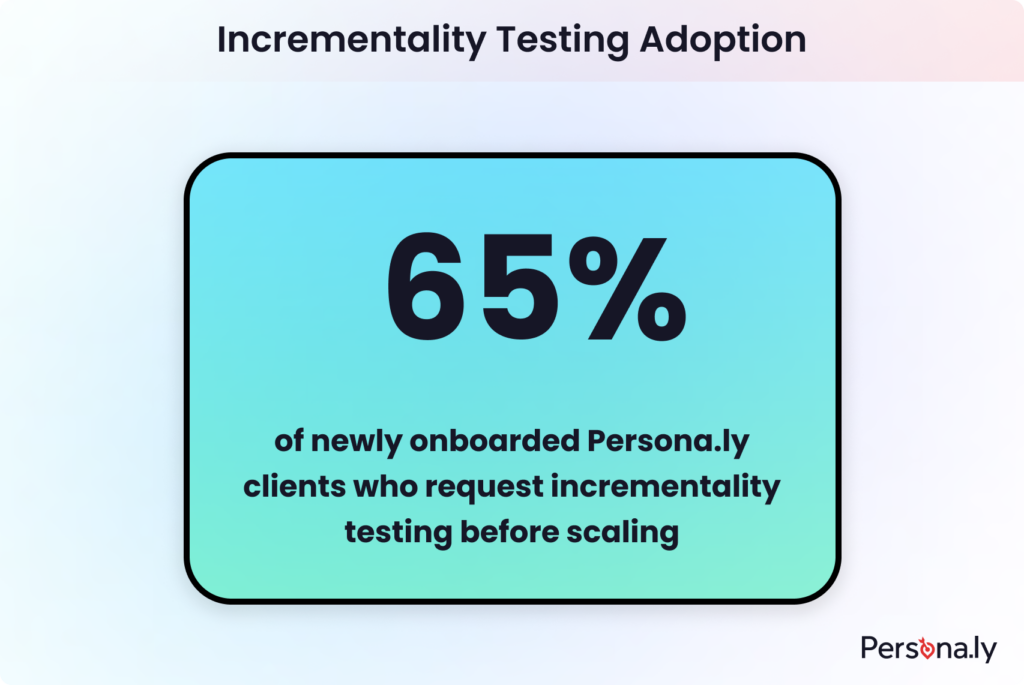
Incrementality testing has become a standard step before campaign scaling as a result. Over the past few months, around 65% of the new advertisers Persona.ly onboarded requested an incrementality test before increasing spend.
Incrementality testing adoption, 65%
The reasoning is simple. Picture two lapsed users who both reopen an app tomorrow. One returns because of the campaign, the other was already coming back after a CRM message or out of habit.
Traditional attribution often credits both. Incrementality asks the more important question: which user would not have returned had the ad never been served.
Advertisers are answering that question with increasingly sophisticated methods. Randomised holdout groups remain the most common, comparing exposed users against a small audience intentionally excluded from advertising. Ghost bidding builds a virtual control group by joining auctions without serving ads. Geo experiments measure lift across similar regions with and without exposure. Audience-level lift studies compare statistically similar cohorts to estimate the true contribution of retargeting across different segments.
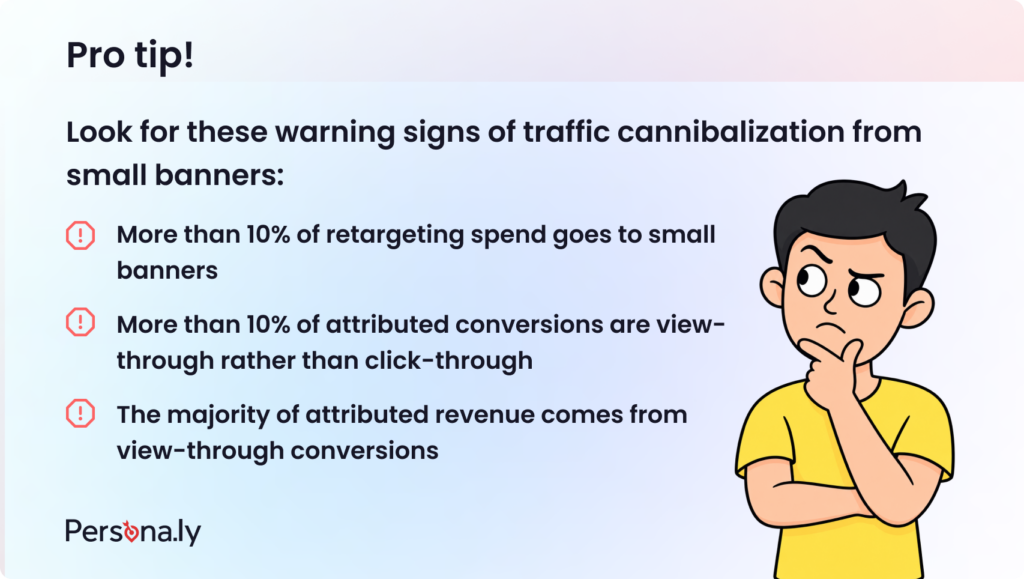
These methods strip out conversions that would have happened anyway, which gives a clearer picture of retargeting’s business impact. Persona.ly sees advertisers putting less weight on view-through attribution and low-impact banner inventory, and more on media that delivers measurable incremental lift.
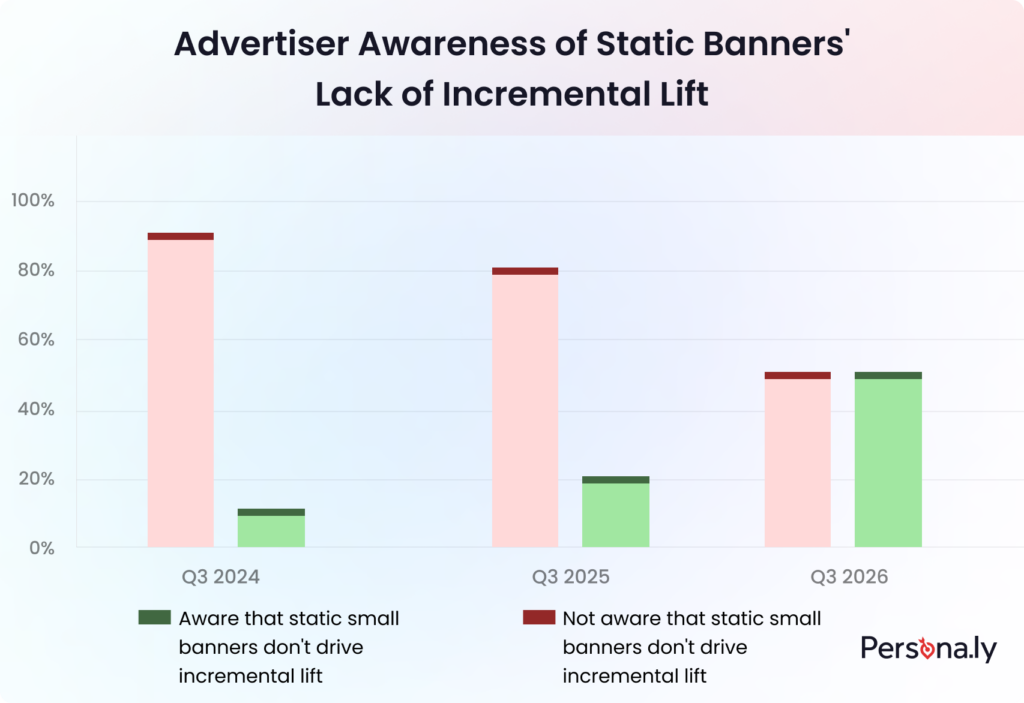
Static small banners are drawing particular scrutiny. Advertisers increasingly recognize that these formats can generate attribution without generating incremental revenue, especially when users were already likely to return organically. As incrementality testing becomes more common, tolerance for spending on this type of inventory without proof of lift is falling.
Advertiser awareness of static banners’ lack of incremental lift
Incrementality has also stopped being a reporting exercise from an engineering standpoint. It’s now part of campaign architecture, requiring coordination between DSPs, MMPs, internal data warehouses and experimentation frameworks so that audiences split correctly, exposure stays controlled, and results hold up statistically.
That demand led Persona.ly to launch IMPACT, its complimentary incrementality measurement platform, which gives customers access to the results of their incrementality tests for campaigns Persona.ly runs.
Attribution alone is no longer enough. Advertisers want confidence that every claimed conversion represents revenue that wouldn’t have existed without the campaign.
Warning signs of traffic cannibalisation from small banners
Not all CTV is created equal
CTV today feels a lot like programmatic did a decade ago. Early adopters proved the channel worked, and the next phase is learning that not every impression labeled CTV delivers the same value.
Persona.ly reports that advertisers are becoming far more discerning, separating premium CTV from broader OTT inventory and paying closer attention to inventory quality, transparency, and the environments where their ads run.
Pricing expectations are becoming more realistic too. US CTV inventory consistently clearing at $2 eCPMs should raise questions rather than confidence, because premium CTV doesn’t trade at commodity prices.
CTV inventory is getting more expensive and the trend is accelerating. Persona.ly’s data shows US eCPMs increasing 2% to 5% QoQ across the past year, reaching 8% in Q3 2026. As competition for quality inventory grows, advertisers need to look beyond CPM and ensure higher media costs are justified by stronger downstream performance.
CTV inventory costs are accelerating
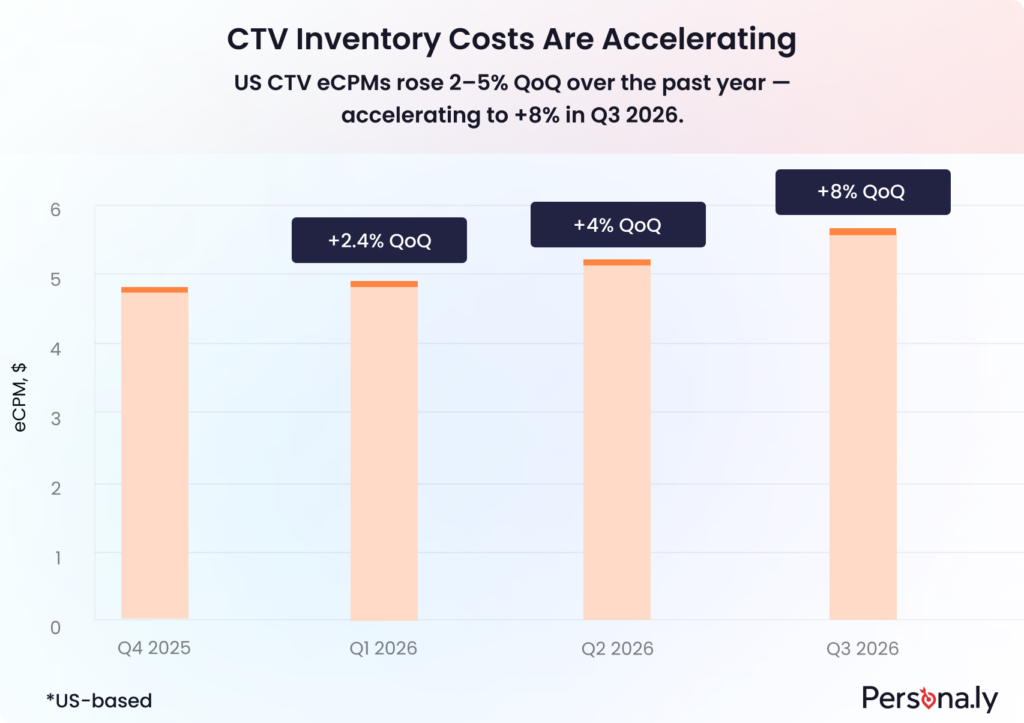
Persona.ly data, US market, covering Q4 2025 through Q3 2026.
Evaluation is getting more sophisticated as well, with ROI replacing delivery metrics as the primary measure of success while experienced buyers dig into placement and device reports.
Mobile inventory and non-premium OTT traffic wrapped under a broad CTV label is not uncommon, so looking beyond aggregate numbers matters as much as choosing the right DSP.
CTV and OTT inventory illustration

The convergence of CTV and retargeting may be the most interesting development. As identity resolution and household-level targeting improve, advertisers are increasingly treating CTV as a measurable performance channel.
Changing consumer behavior is accelerating that shift. Nearly 9 in 10 Americans use their phone while watching TV, turning second-screen behavior into an opportunity rather than a distraction. For mobile marketers, the largest screen in the home captures attention and creates intent, while the second screen enables action. CTV is becoming an increasingly important driver of measurable performance, not just brand awareness.
AdQuantum

What the FIFA World Cup taught us about performance marketing in Q3
The FIFA World Cup primarily affects sports-related advertisers, but AdQuantum’s data suggests the effects reached well beyond that vertical. Across multiple subscription-based non-gaming campaigns they observed measurable shifts in auction dynamics, conversion efficiency and media allocation during the tournament.
Meta: conversion rates temporarily declined
Subscription-based non-gaming campaigns on Meta saw a noticeable drop in post-click conversion rates once the tournament started. AdQuantum recorded a 10% to 12% decline in click-to-conversion rate, with performance recovering gradually and returning to baseline around July 19.
The conversion rate drop was the first signal that auction dynamics had changed. As conversion efficiency fell, CPA rose even though customer lifetime value held steady.
The timing points to increased auction competition as advertisers concentrated budgets around the World Cup, making user acquisition more expensive even for brands with no connection to sports.
Click-to-conversion rate index
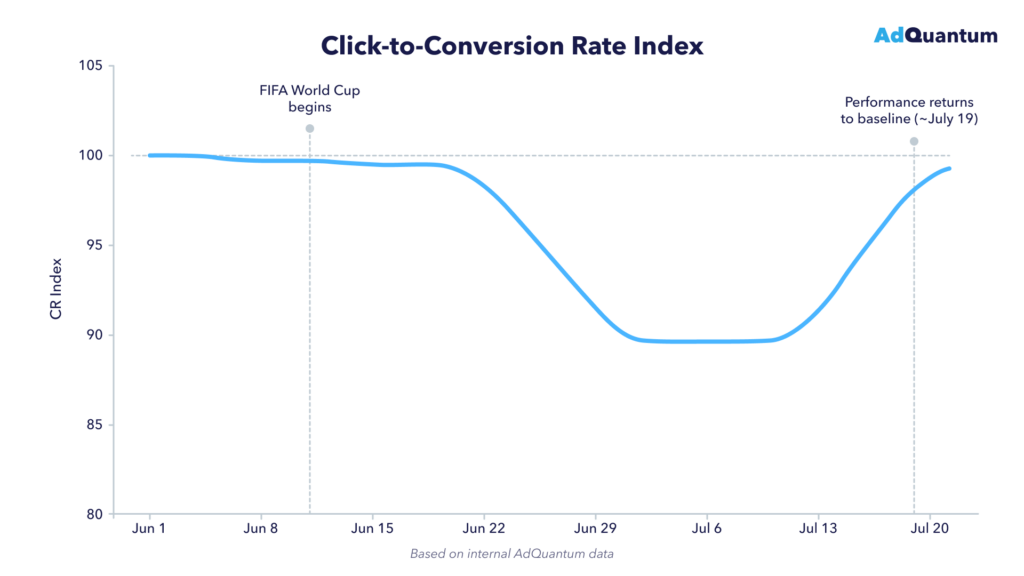
AdQuantum internal data, covering June and July 2026
Google Search: a more complex shift
On Google the trend appeared to be driven by several overlapping factors. Through late spring and into July, AdQuantum observed Search volume down more than 15%, CPA up roughly 10%, and ROI deteriorating by approximately 10% to 15% measured through the CAC ratio.
Seasonality and heightened competition around the World Cup likely contributed. At the same time Google’s rollout of AI Max for Search introduced broader query matching, AI-generated assets and more dynamic landing page selection, which changed how campaigns entered and competed in the auction.
To hold acquisition efficiency, AdQuantum reallocated approximately 20% of Search budget into Demand Gen, balancing short-term performance against broader audience discovery.
Key takeaways
- Major global events can influence advertising performance well beyond their core verticals, and increased auction competition may temporarily reduce conversion efficiency even for unrelated advertisers.
- Early changes in conversion rate can act as a leading indicator of broader auction shifts before CPA starts to rise.
- Large platform updates such as Google AI Max can amplify market-wide changes and make attribution harder.
- During periods of heightened volatility, flexible budget allocation across channels becomes more important.
“The World Cup reminded us that market-wide events can reshape performance even for advertisers completely unrelated to sports. The winners weren’t necessarily those spending more, they were the teams that adapted their channel mix and budget allocation quickly as auction dynamics changed.”

Anton Kuzmin
CMO, AdQuantum

AppTweak

App Store listings are ChatGPT’s most-cited source for app recommendations
AppTweak’s analysis draws on over 125,000 ChatGPT recommendation responses across 9,489 app prompts and more than 9,000 game prompts, taken from their AI Visibility Playbook for apps and games. These findings reflect ChatGPT recommendations in the US in May 2026, a snapshot of a fast-moving surface. Three findings stood out.
1. The app store is ChatGPT’s most-cited source
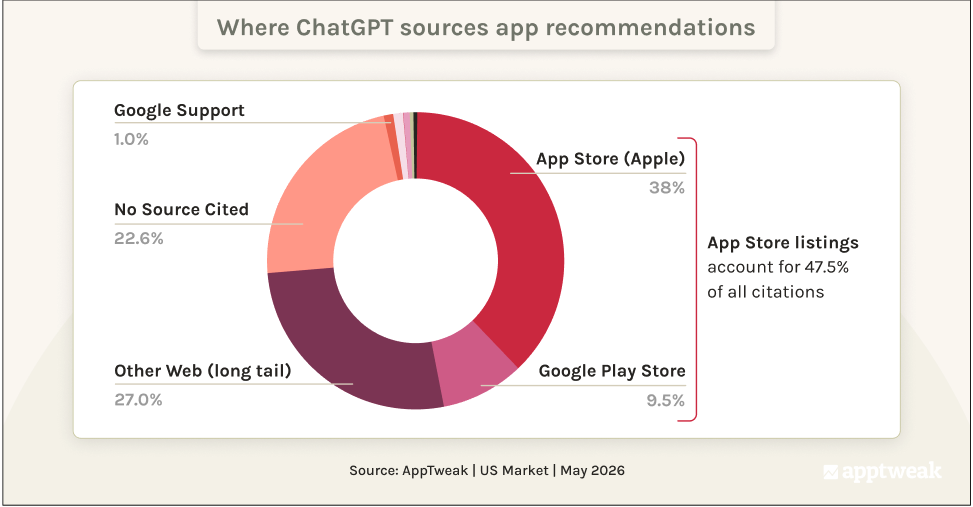
When ChatGPT backs an app recommendation with a source, it cites App Store listings more than anything else. Apple’s App Store accounts for 38% of citations and Google Play for 9.5%, so store pages together make up 47.5% of the total, with the open web adding another 27%.
The store listing has quietly become an AI retrieval surface as well as a conversion asset.
For marketers that means metadata in App Store Connect and the Play Console is now among the strongest inputs into how ChatGPT describes an app. A clear, use-case-led long description gives ChatGPT something specific to retrieve and repeat.
Where ChatGPT sources app recommendations
2. ChatGPT’s confidence drops sharply after the top positions
When ChatGPT recommends several apps it often ranks them, and the further down that ranking an app sits, the less likely ChatGPT is to cite a source for the pick.
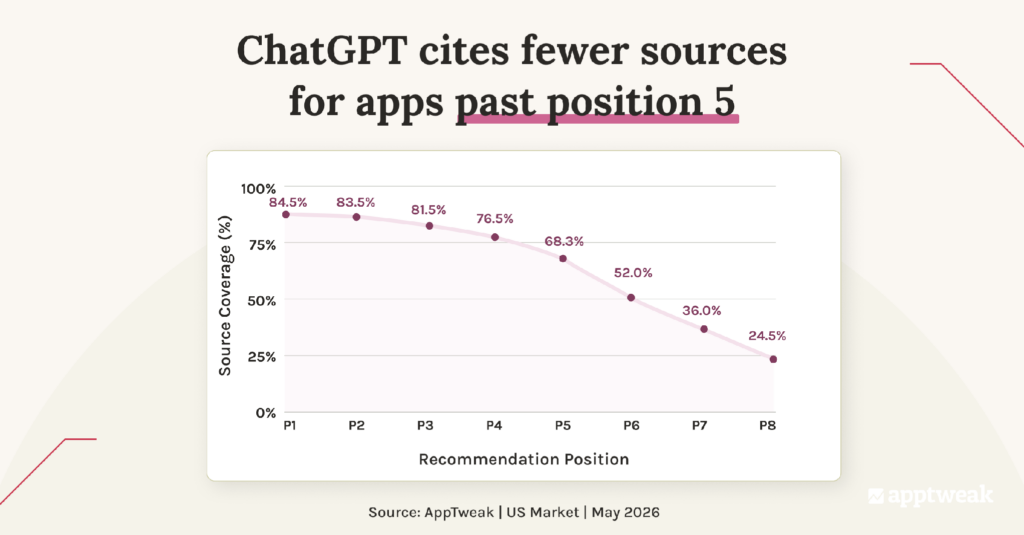
A source appears for 80% to 85% of recommendations in the top three positions, 68% at position five, under 50% by position seven, and under 25% by position eight. The lower an app sits, the more likely it was named from the model’s training associations rather than from a source ChatGPT can point to.
That gap maps what’s defensible. A rival holding position seven with no source behind it is far easier to displace than one at position three with consistent retrieval. Taking that spot means building the store and web signals it’s missing.
ChatGPT cites fewer sources for apps past position 5
3. For games, AI leans on the store and community even more
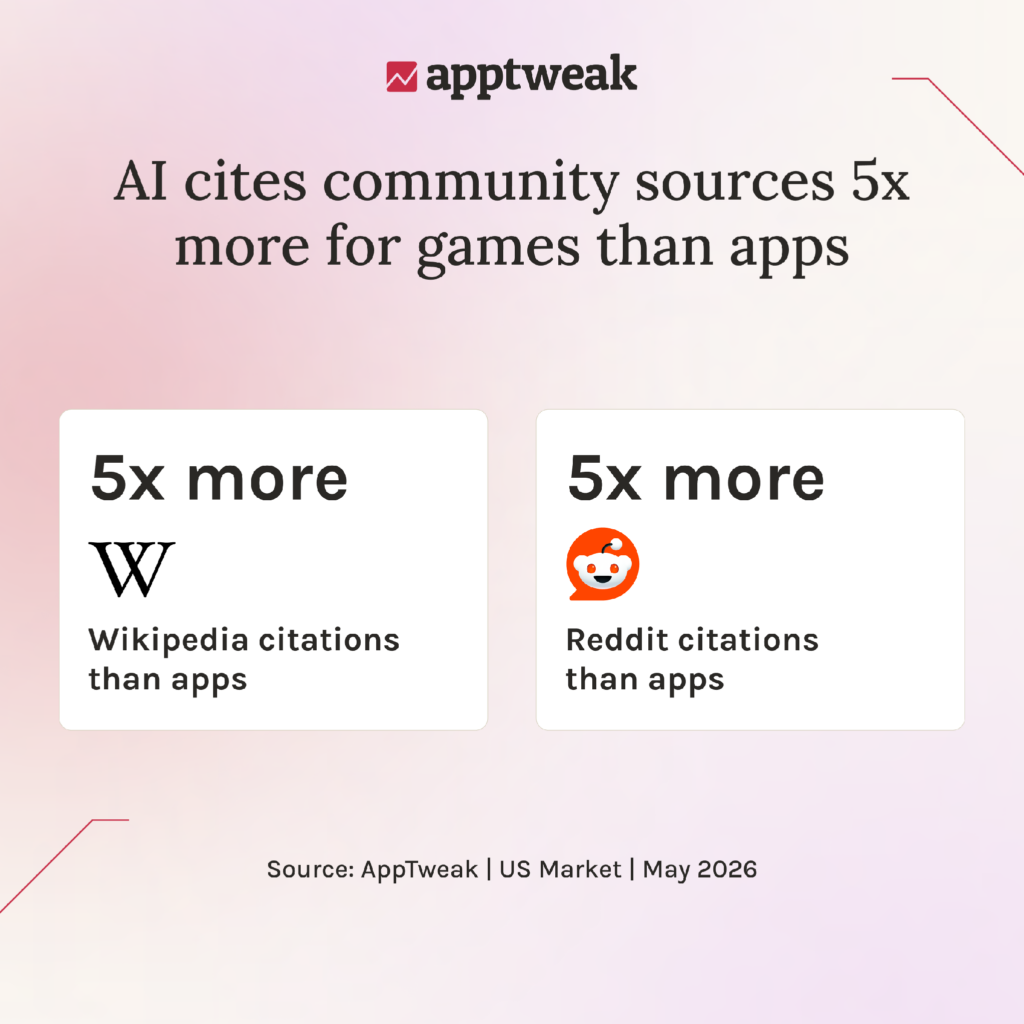
The same pattern holds for games, though the source mix tilts harder toward community. App Store and Google Play citations both run higher for games than for apps, and Reddit and Wikipedia are each cited roughly five times more often.
Games usually carry thinner owned web content, so AI search engines fill the gap with store pages and community sources alike.
For games teams that sets two priorities: a store listing that clearly explains what the game is and who it’s for, and a real presence in the communities where players discuss similar titles, from Reddit to fan wikis.
AI cites community sources 5x more for games than apps
AppTweak, US market, May 2026.
Footnotes
Countries and tiers
We look at global data through a number of filters. One is country tiers, which because of our customer base we define as:
- China
- Japan
- Rest of World
- Tier 1 East: Korea, India
- Tier 2 East: Taiwan, Indonesia, Turkey, Thailand, Philippines
- Tier 1 West: Canada, France, Germany, UK
- Tier 2 West: Australia, Mexico, Brazil, Spain, Italy, Netherlands, Poland
- United States
About this data
All of this data is based on Singular’s view of the adtech ecosystem. While we have a significant share of the Mobile Marketing Platform space and see a huge amount of data, our insights will be biased toward actively marketing and growing apps that are spending significantly on user acquisition.
A note on methodology.
The install definitions behind CPI, CVR and IPM count only installs with associated media spend, and every metric in this report is computed on a single consistent basis. Because the source computation has been refined since earlier editions, some figures may not line up exactly with numbers published in previous Quarterly Trends Reports.
Every figure here has been validated against source and is directly comparable within Singular’s own data in this report. Where a value did not meet those checks, it is withheld rather than adjusted.