Introduction and TLDR
Q1 2026 was the quarter utilities arrived.
The post-holiday pullback did not come. Total ad spend in Q1 2026 was up 0.94% from Q4 2025. In Q1 2025, spend fell 7.4% QoQ. Q1 typically contracts hard from Q4. This year it held. That is the first signal that something structural shifted in the market.
What changed was composition. Utilities spend surged 943% QoQ. Education grew 65.9%, the second-highest rate in the dataset – a small base, but a clear directional signal. Entertainment crossed a quarterly milestone, rising 50.1%. Financial grew 35.3%. These four verticals drove all incremental gain and then some, fully offsetting the collapse of On-demand (-30.5%) and E-commerce (-38.7%).
Platform cost dynamics are inverted. iOS impressions grew by 13.3%, while Android impressions fell by 6.4%. iOS CPM dropped 10.5%; Android CPM rose 7.3%. Android CPI climbed 15.1% to $0.76. iOS CPI declined 1.1% to $3.03.
In the ad network rankings, a streak ended. TikTok gained zero net ad spend in Q1 2026. Facebook led all networks. Moloco ranked second.
Q1 growth was not about expanding everywhere. It was about vertical rotation at speed. Utilities exploded, Education accelerated off a small base, Entertainment crossed a quarterly milestone, and the platforms that benefited most were those that could absorb the iOS inventory expansion.
Highlights and key takeaways
- Total spend grew 0.94% QoQ from a Q4 peak. Q1 is typically a contraction quarter.
- Utilities spend surged 943% QoQ – the largest single-vertical percentage increase in the dataset.
- Education grew 65.9% QoQ, the second-highest percentage increase in the dataset. Growth off a small base, but the directional signal is clear.
- Entertainment crossed a quarterly spending milestone for the first time (+50.1% QoQ).
- Android CPI rose 15.1% to $0.76; iOS CPI fell 1.1% to $3.03.
- iOS impressions expanded 13.3% QoQ, driving iOS CPM down 10.5%. Android impressions fell 6.4%, pushing Android CPM up 7.3%.
- On-demand fell 30.5%, and E-commerce fell 38.7%, ending the holiday-season lift.
- Facebook replaced TikTok as the top spend gainer. TikTok gained zero net ad spend.
- Health & Fitness flipped: iOS now leads on installs (56.3%), reversing the historical Android majority.
Bottom line
Q1 2026 defied the post-holiday gravity that defines most first quarters. Spend held. Composition rotated sharply. Platform costs inverted. The advertisers who read the rotation early found efficiency; those anchored to Q4 winners paid for the miss.
Total spend held, but the underlying mix shifted dramatically. Where did the growth come from?
As always, data in this report is based on a significant slice of Singular’s data:
Global ad spend trends
Global ad spend was up 0.94% from Q4 2025. Q4 is typically the highest-spend quarter of the year, and Q1 almost always gives some back. In Q1 2025, spend fell 7.4% QoQ. The fact that Q1 2026 held at Q4 levels confirms genuine demand expansion, not just seasonal maintenance.

- +0.43% Android ad spend QoQ (Q4 2025 to Q1 2026)
- +1.43% iOS ad spend QoQ (Q4 2025 to Q1 2026)
iOS held a slight spend lead over Android in Q1, continuing the Q4 pattern where iOS monetization premium sustains higher advertiser investment even at lower install volumes. The more significant platform story is in impressions, not spend.
When we look at global ad impressions by OS:
- Android change: -6.38% (decrease)
- iOS change: +13.32% (increase)
Total impressions were essentially flat (+0.64%), but the share shifted materially: iOS gained more than 13% of the impression inventory in a single quarter.
Ad spend by vertical
Spend grew roughly 1% QoQ overall, but the vertical breakdown tells the real story. Four verticals drove the growth. Six stayed flat or contracted.

Utilities is the most striking data point in this report. Spend grew 943%, reflecting the ongoing expansion of AI-powered utility apps, VPN services, and productivity tools aggressively entering paid acquisition. This category was effectively absent from Q4’s spend ranking; it now commands a meaningful and growing share.
Education grew 65.9%, the second-highest rate in the dataset. The base is small, but the directional signal is clear – mobile learning apps accelerated spend in Tier 1 East and Tier 2 West, where Education CPI is highly efficient. Entertainment crossed the milestone it had never reached in quarterly spend, jumping 50.1%. Financial grew 35.3%, driven by fintech and personal finance app expansion in both premium and emerging markets.
On-demand’s 30.5% contraction and E-commerce’s 38.7% decline are seasonal patterns amplified by the post-holiday cycle. Both verticals were elevated in Q4 by gift delivery and holiday commerce. The Q1 reset was predictable in direction; the magnitude reflects how strongly both had been funded during the holiday period.
Bottom line
Q1’s vertical map is unrecognizable from Q4’s. Utilities went from last to fastest-growing. Education has shown a steep growth. Entertainment crossed a quarterly milestone for the first time. On-demand and E-commerce gave back their holiday premium. This is a normalization and a rotation happening simultaneously.
Ad spend by region
The geographic concentration that defined Q4 2025 also unwound. Q4 was led by Tier 1 East (+25%) and the US (+17%). In Q1, Tier 1 East contracted by 12.9%, while the US was essentially flat.

Tier definitions: Tier 1 West = Canada, UK, France, Germany. Tier 1 East = Korea, India. Tier 2 West = Australia, Brazil, Mexico, and Western Europe. Tier 2 East = Indonesia, the Philippines, Thailand, Taiwan, and Turkey. Japan and China are tracked independently.
Rest of World led all tiers with an 11.1% increase, followed by Tier 2 East at 8.5% and Japan at 5.3%. These are markets that had modest or flat Q4 spend and are picking up in Q1 as the holiday concentration disperses.
Tier 1 East’s 12.9% contraction and China’s 22.5% decline represent the reversal of the aggressive year-end push seen in those markets in Q4. These are the sharpest absolute contractions in the dataset for this quarter. They signal a pullback from premium inventory concentration, not a structural exit from these markets.
The US held with a 0.3% increase, essentially flat against its Q4 peak. That stability, combined with a 6.9% increase in US impressions, contributed to the CPM dynamics: the US saw modest spend growth but significantly more impression supply, which is consistent with a competitive but not hyperinflated auction environment in Q1.
Bottom line
Q4’s geographic concentration unwound sharply in Q1. Tier 1 East reversed from +25% to -12.9%. Rest of World led gains at +11.1%. The US held. Q1 is where dollars are redistributed before the next concentration builds.
With the overall spend picture in focus, the next layer is measurement infrastructure. How much of iOS activity can advertisers actually track? And how is that signal distributed across verticals?
ATT and IDFA availability
ATT opt-in rates measure the share of iOS users granting tracking permission at app open. Rates vary significantly by vertical, driven by the perceived value exchange between users and apps. Q1 2026 shows broad stability across most verticals, with one notable mover: Entertainment declined from 0.80% in Q4 2025 to 0.30% in Q1 2026, the largest single-vertical decline in the dataset. Utilities has been low for multiple consecutive quarters: 0.33% in Q4 2025 and 0.30% in Q1 2026, reflecting an app mix dominated by tools, VPNs, and productivity apps where users have no functional reason to consent to tracking. The overall Q1 2026 opt-in rate is 2.80%.

ATT acceptance by vertical
On-demand (4.6%), Gaming (4.1%), and Other (5.0%) lead the dataset, where functional engagement and immediate value exchange make opt-in more likely. Financial and Education hold at 2.7% each. H&F sits at 1.7%, reflecting the privacy sensitivity around health data. Travel, E-commerce, Entertainment, and Utilities all fall below 1.5%.

The structural takeaway: the verticals with the most advertisers and the fastest growth in Q1 are also the least measurable. Entertainment is at 0.3% despite the vertical’s strong growth. Utilities is at 0.3% despite a 943% surge. Incrementality testing is not a supplementary measurement for these categories; it is the primary measurement.
Bottom line
The verticals that grew fastest in Q1 have the lowest opt-in rates. Utilities at 943% spend growth with 0.3% opt-in is the starkest example. High spend with low signal requires incrementality infrastructure. There is no shortcut.
Tracking availability tells you how much of your iOS activity you can measure directly. But the headline cost and efficiency metrics cut across both platforms. How did CPI, CPM, CTR, and IPM move in Q1?
Global metrics: big picture
From Q4 to Q1, costs rose sharply while conversion efficiency declined. CPI climbed 12% to $1.24. CPM barely moved (+0.3%). CTR rose 14.8% to 5.2%. IPM fell 10.5% to 2.27. The global +0.3% CPM masks a platform split: Android CPM rose 7.3% (spend stable, impressions down 6.4%) while iOS CPM fell 10.5% (impressions up 13.3%). One number, two opposite stories.

The 14.8% increase in CTR warrants a methodological note. CTR figures continue to be influenced by rewarded ad formats, SKOverlay behavior, and other mechanics that trigger clicks without equivalent user intent. The CTR increase signals rising ad activity, not necessarily rising user interest. Treat CTR as a relative metric within campaign types rather than a proxy for engagement quality.
The real signal in Q1 is the gap between CPI and CPM. CPM barely moved, meaning ad inventory didn’t get significantly more expensive at the impression level. CPI rose 12% despite that. The explanation: IPM fell 10.5%. Advertisers are generating fewer installs per thousand impressions than in Q4. This is a funnel efficiency problem, not primarily a media cost problem. The ad is getting shown. The user is not converting.
Rising CPI driven by declining IPM rather than rising CPM means the fix is downstream of the ad buy, in creative quality, landing page experience, or audience precision, not in media cost negotiation.
Bottom line
CPI rose 12% while CPM held at +0.3%. The math is clear: fewer installs per impression at similar cost. This is a funnel efficiency problem, not a media cost problem. Fix the conversion, not the bid.
The global metrics show the headline. The regional and vertical breakdown shows where to act. Which markets are driving the CPI surge, and which are getting cheaper?
CPI deep dive: geos, verticals, genres
CPI by OS
CPI moved in opposite directions by platform in Q1 2026. Android CPI rose 15.1% to $0.76. iOS CPI fell 1.1% to $3.03.

Android’s 15.1% increase reflects demand pressure concentrated in the categories that surged in Q1: Utilities, Entertainment, and Financial, where the rapid influx of new advertiser spend competed for Android inventory that also contracted 6.4% in total impressions. More spend chasing fewer impressions on Android is the primary driver of Android CPI inflation.
iOS CPI declining 1.1% is counterintuitive at first read. Q1 is not typically a low-demand quarter for iOS. The explanation is the supply expansion: iOS impressions grew 13.3% QoQ. More inventory absorbed the spending increase, keeping CPM lower and CPI relatively stable. The dynamic on iOS in Q1 was supply-led, not demand-led.
The iOS-Android CPI gap now stands at $2.27 ($3.03 vs $0.76). This is narrower than the $2.41 gap in Q4 ($3.07 vs $0.66). The platforms are slowly converging on cost, driven by Android inflation rather than iOS deflation.
Bottom line
Q1 was overwhelmingly an Android cost story. Android CPI climbed 15.1% while iOS fell 1.1%. Advertisers who expected iOS to stay elevated and planned accordingly found themselves underallocating to an increasingly efficient channel. Platform-specific budgeting is not optional when the two platforms move in opposite directions in the same quarter.
CPI by region
The regional breakdown makes the iOS story more precise: iOS CPI fell almost everywhere except the United States. Android CPI rose in most markets, but especially in the US, Rest of World, and Tier 1 East.
Chart Title: Global CPI Change by Region (Android)

Chart Title: Global CPI Change by Region (iOS)

The US is the only major market where iOS CPI increased meaningfully: from $4.04 to $4.60, a 13.8% jump. US iOS remains the most expensive inventory in the dataset for absolute cost. That said, at $5.09, US Android CPI now exceeds US iOS CPI, a pattern that holds only in this one market and reflects how severely Android inventory tightened in North America.
China saw the sharpest iOS decline: from $4.00 to $2.58, a 35.4% drop. Japan fell 15.1% on iOS. Tier 1 West fell 12.3%. Tier 2 West fell 17.1%. Tier 1 East fell 20.4%. Outside the US, buying iOS has become materially cheaper in Q1 2026 than in Q4 2025.
Android tells a different regional story. Tier 1 East rose 24% on Android, Rest of World 20.2%, and Tier 1 West 8.4%. These are markets where Android inventory tightened, likely due to new advertiser entry in Utilities and Financial categories targeting emerging-market Android users.
Bottom line
Q1 cost inflation was driven by priority markets on Android and by the US on iOS. The iOS efficiency gains available outside the US are real and measurable. Advertisers with global or Asia-Pacific iOS strategies had a cheaper Q1 than Q4 across almost every metric. The US was the exception, not the rule.
CPI by vertical
Financial and Health & Fitness remain the most expensive categories globally, driven by high downstream value and intense competition for quality users. Travel holds steady, with CPI essentially flat QoQ at $2.21. Utilities and Other sit at the opposite end of the spectrum, combining low CPIs with strong engagement and conversion rates. The notable shift this quarter is Utilities, up 254% to $1.24, as new advertisers entered the category at scale and paid the discovery premium that comes with it.

CPI by vertical and OS
The chart below shows global average CPI by vertical for Q1 2026, across both Android and iOS. Use them to calibrate relative vertical cost and the iOS premium before campaigns launch.

On Android, CPI stays below $1 for most verticals. Financial ($2.00) and H&F ($1.86) are the outliers. On iOS, Financial CPI at $14.97 is 7.5x its Android equivalent and more than 3x the next most expensive iOS vertical.
Utilities Android CPI of $0.84 is among the lowest in the dataset. Spend grew 943% while CPI stayed contained. That is a meaningful efficiency signal for this vertical at scale.
Entertainment’s iOS-Android CPI gap is 1.5x, the smallest in the dataset. Neither platform is structurally more expensive in this category.
Gaming CPI rose 18.5% while spend grew only 9.3%. Cost inflation outpaced category growth. Advertisers paid more per install without a corresponding demand surge.
Financial (+9.3% CPI, +35.3% spend) and Entertainment (+22.8% CPI, +50.1% spend) are the only verticals where CPI and spend grew together. Genuine demand intensity in both.
Education (-56.1% CPI, +65.9% spend) and H&F (-39.8% CPI, +7.6% spend) saw sharp CPI declines. Tier 1 East and Tier 2 West spend growth at low CPIs pulled the global average down.
Bottom line
The iOS premium is not uniform. Financial runs at 7.5x; Entertainment runs at 1.5x. The outliers in both directions are where strategic platform allocation pays off. Target iOS where LTV justifies the premium. Shift Android where iOS is structurally cheaper or at parity.
CPI by game genre
Gaming CPI follows a power-law distribution. It rose 18.5% QoQ in Q1 2026, compared with Q4 2025. The increase did not spread evenly. Premium genres absorbed most of the pressure while the long tail stayed largely unchanged.
On Android, Social ($29.02) and Casino ($14.43) operate in their own pricing tier, well above everything else. RPG, Hypercasual, and Strategy form a mid-range cluster between $2 and $5. Below that, the long tail of puzzle, casual, and educational genres stays at or below $1 and shows no meaningful movement.

On iOS, the distribution is sharper. Social ($33.37) and Casino ($31.25) sit at near-parity at the very top. Sports is the Q1 story: at $9.93 iOS versus $0.93 Android, it carries a 10x cross-platform gap driven by sports betting app expansion. The mid-tier clusters tightly between $3 and $8, with most genres close together.

On iOS, the distribution is sharper. Social ($33.37) and Casino ($31.25) sit at near-parity at the very top. Sports is the Q1 story: at $9.93 iOS versus $0.93 Android, it carries a 10x cross-platform gap driven by sports betting app expansion. The mid-tier clusters tightly between $3 and $8, with most genres close together.
Bottom line
Premium genres got more expensive; the long tail stayed cheap. Sports emerged as a new iOS premium in Q1. Advertisers in Social, Casino, or iOS Sports need LTV models that justify CPIs 10-20x above the market floor.
The CPI picture shows where costs sit at market level. To calibrate against your specific category, channel, and geography, the following section provides the full regional and vertical benchmark table
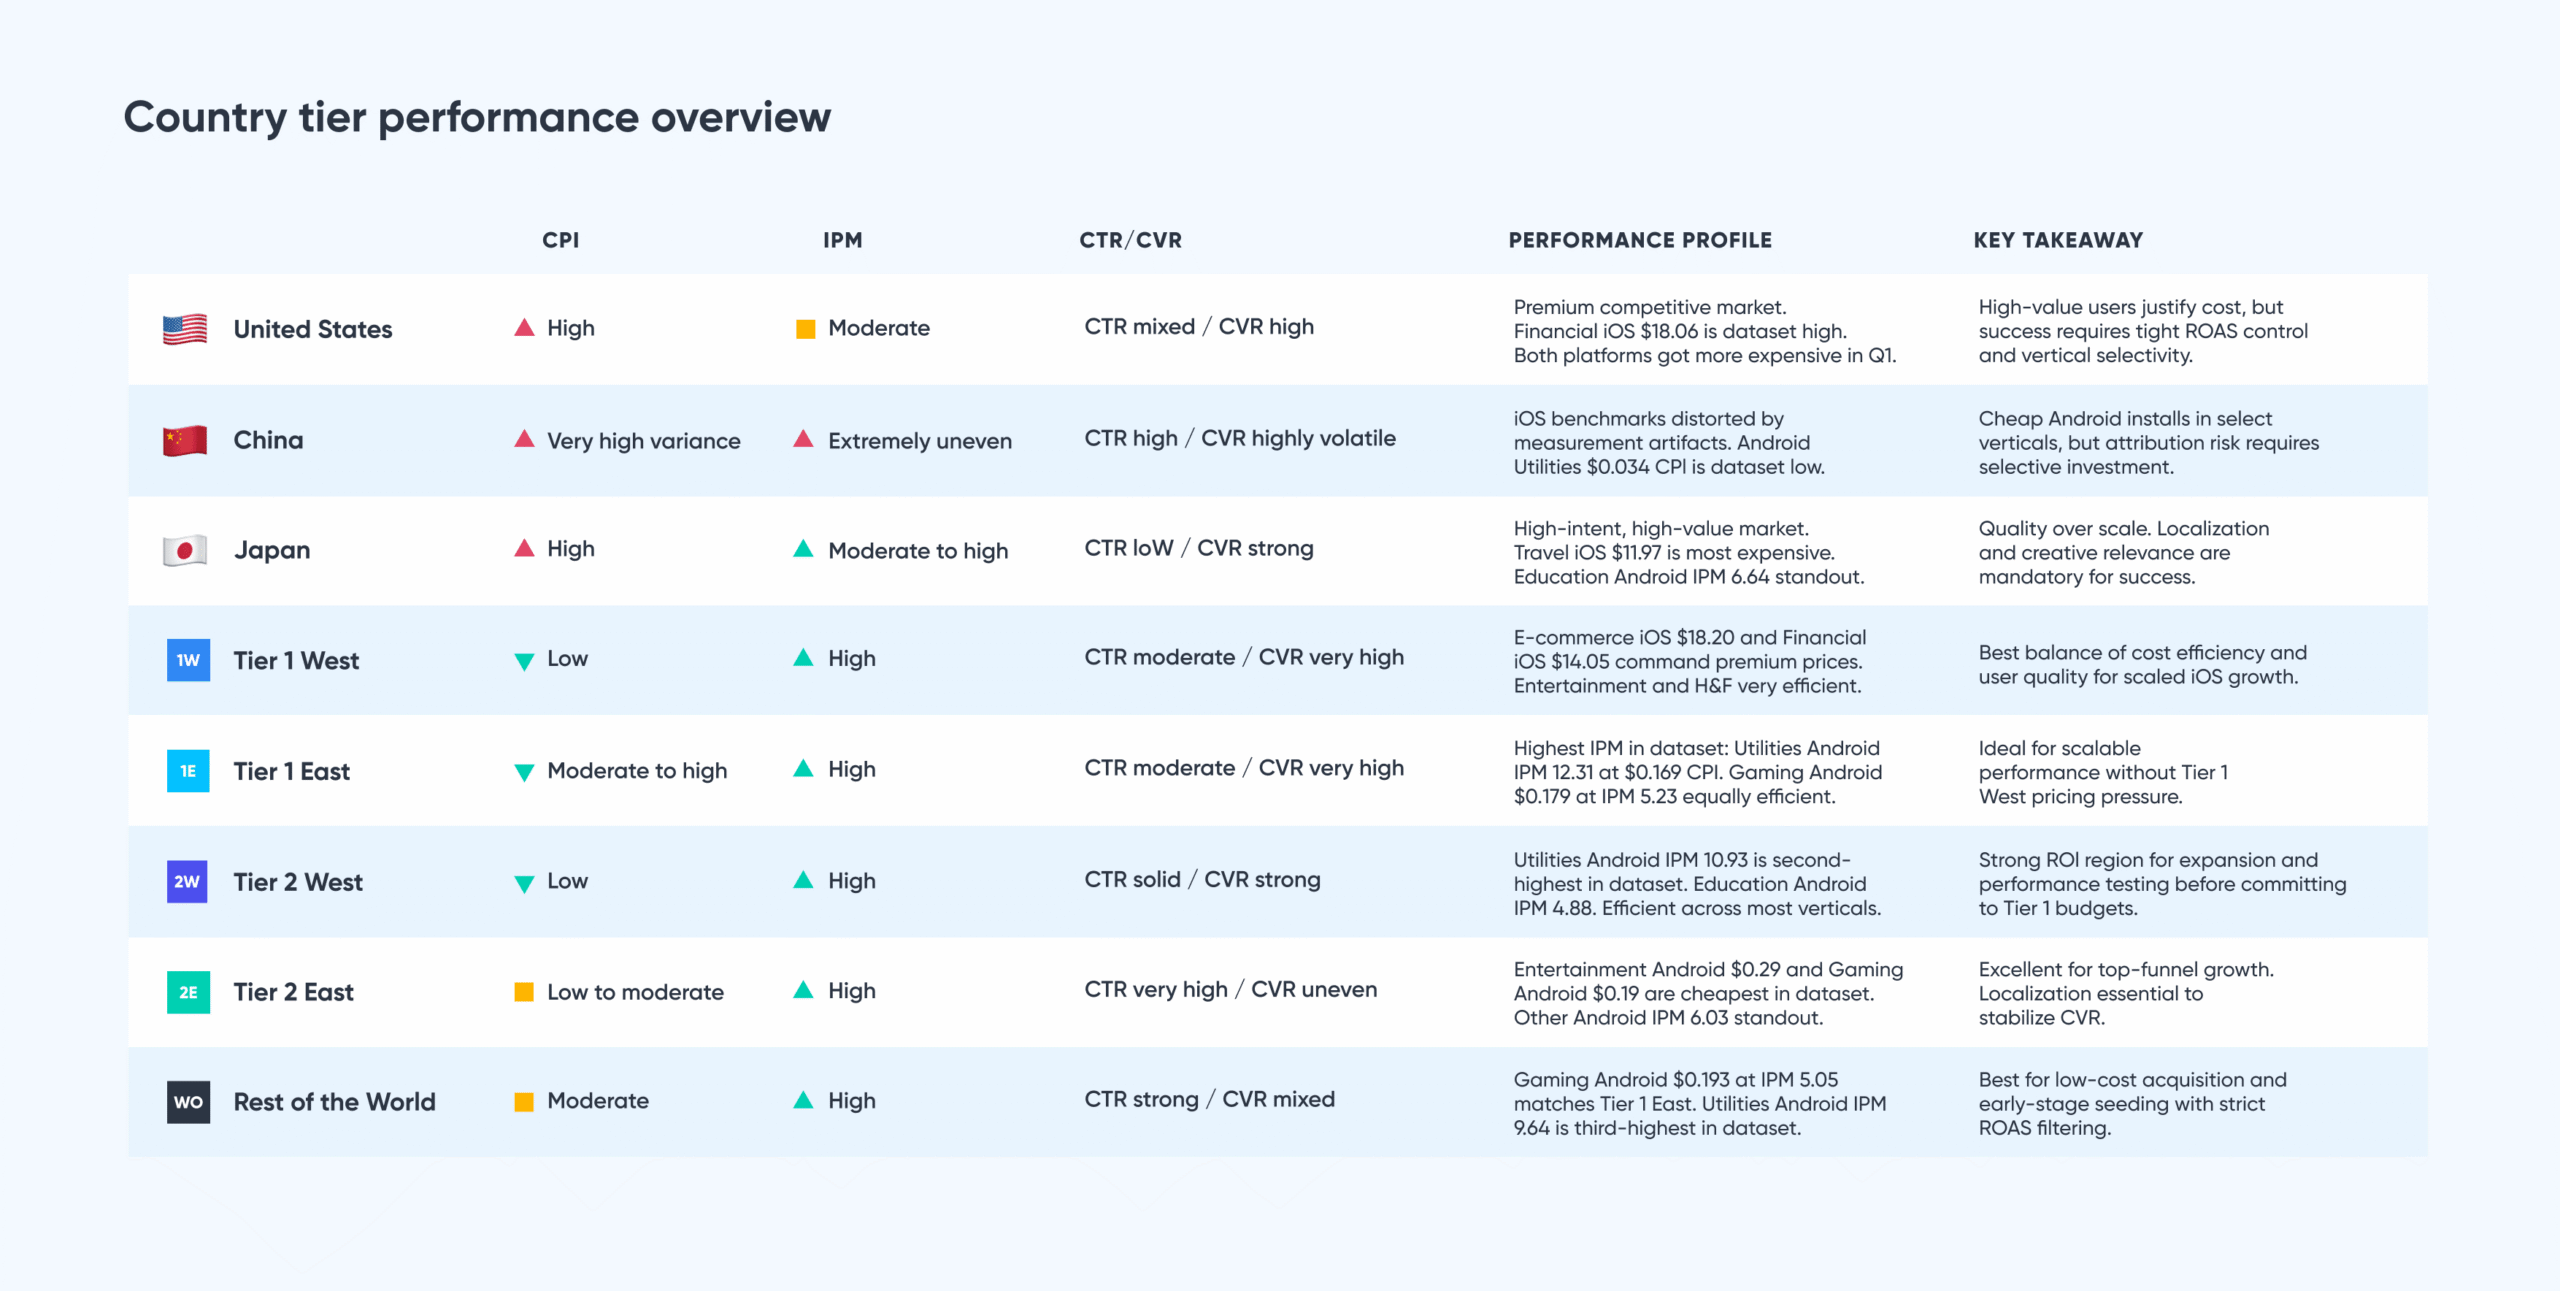
Key metrics by country tier and vertical
Singular’s regional tier system organizes the data below. All performance metrics (CPI, CPM, CTR, IPM) are Q1 2026 figures from Singular’s dataset. They represent the performance of actively marketing apps that invest significantly in paid user acquisition.
These benchmarks are pre-launch calibration tools. Set your pass/fail thresholds here before a test launches, not after a campaign runs.

Here’s the data:
Key regional insights
Let’s look at the highlights in each market segment:
United States: Expensive traffic with high monetization potential
- Financial iOS at $18.06 is the highest CPI in the dataset. The Utilities Android CPM of $23.02 is the highest
- Entertainment inverts the standard model: Android CPI of $7.18 is more than 4 times iOS’s at $1.66. The US is the only major market where this happens
- Education vertical on Android delivers strong IPM at 4.39 despite a $3.86 CPI. IPM for Travel is at 4.61, holding up well for a premium market
- Both platforms got more expensive simultaneously, the only geo where this happened in Q1
- Optimizing right across Travel, Utilities, and Gaming pays off even at these price levels
China: Huge scale but a highly fragmented ecosystem
- Extreme efficiency variance by vertical
- Very low CPIs in select categories, but inconsistent conversion quality
- On-Demand vertical for Android devices at $0.255 CPI with IPM at 7.94 is the cheapest On-demand combination globally.
- Tracking and platform constraints distort benchmarks
- Best approached selectively, especially for Gaming, Entertainment, and Utilities
Japan: High-intent, high-value, high-cost market
- Travel is the most expensive vertical, with a CPI of $6.81 on Android and $11.97 on iOS
- Financial vertical on Android at $8.56 CPI ranks among the highest outside the US
- Education is the standout efficiency story: $0.535 Android CPI with IPM 6.64. Utilities Android IPM at 8.21 is strong for a Tier 1 market
- Japan is now cheaper than the US on iOS across most verticals. On-Demand iOS at $1.31 is notably efficient for this market
- Lower CTR but strong CVR and downstream value. Creative localization is not optional here
- Behaves more like the United States than the rest of Asia Pacific
Tier 1 West: Much cheaper than the United States, with strong CVR
- E-commerce iOS CPI at $18.20 and Financial iOS CPI at $14.05 are the most expensive verticals in this tier, reflecting Western European premium inventory pricing
- Entertainment is the standout efficiency story: Android’s $2.51 and iOS’s $1.69 are some of the lowest Entertainment CPIs outside Tier 2
- H&F’s iOS IPM at 4.22 and Utilities’ Android IPM at 6.13 show strong conversion well beyond what the CPMs suggest
- Lower CTR, but installs convert well. Excellent balance of cost and quality for scaled growth
Tier 1 East: Premium audience quality with better cost efficiency
- Utilities Android IPM at 12.31 with CPI $0.169 is the highest IPM in the entire dataset
- Gaming on Android at $0.179 CPI with IPM of 5.23 is one of the most efficient combinations globally
- Travel Android at $0.282 CPI with IPM 5.60 also stands out. Three verticals deliver IPM above 5 in this tier
- Spend fell 12.9% QoQ, reversing Q4’s surge. The efficiency case is unchanged
- Ideal for performance-led global campaigns that cannot afford United States-level CPIs
Tier 2 West: Cost-efficient region for scalable growth
- Utilities Android IPM at 10.93 with CPI $0.41 is the second-highest Utilities IPM in the dataset
- Education Android at $0.897 with IPM 4.88 and Other Android at IPM 6.28 are both standout combinations
- Gaming Android at $0.40 and Entertainment Android at $0.64 are efficient at scale
- iOS performs solidly: H&F iOS IPM 2.39 and Entertainment iOS at $0.98 CPI with IPM 1.87
- Strong region for testing, expansion, and volume growth before committing to Tier 1 budgets
Tier 2 East Massive install volume at bargain CPIs
- Entertainment on Android at $0.290 CPI and Gaming Android at $0.192 are among the cheapest in the dataset
- The Other vertical on Android, with an IPM of 6.03, and the Travel vertical on Android, with an IPM of 4.45, show that volume and efficiency can coexist here
- High CTR with more variable conversion rates. Localized creative is essential to sustain CVR
- Best suited for top-funnel growth, Utilities, and Casual Gaming at scale
Rest of World: Very cheap reach with mixed user quality
- Gaming Android at $0.193 CPI with an IPM of 5.05 matches Tier 1 East efficiency at a broader scale
- Utilities Android at $0.273 CPI with IPM 9.64 is the third-highest Utilities IPM in the dataset
- Travel on Android at $0.404 CPI with IPM of 4.35, and Entertainment on Android at $0.312 CPI with IPM of 3.31 are both highly efficient
- Strong CTR but inconsistent CVR. Tight optimization and filtering are needed to protect ROAS
- Best suited for low-cost content, utility-driven apps, and early-stage market seeding
Or, if you prefer a simple chart
Key vertical insights
Here are some of the insights we can draw from a vertical perspective:
Education
- Most efficient in Tier 1 East ($0.337 Android CPI) and Tier 2 West ($0.897 Android CPI), where IPM approaches 4 to 5
- Japan’s Education vertical in Android is the standout: $0.535 CPI with an IPM of 6.64 – exceptional value for a Tier 1 market
- Most expensive in the US (CPI: Android $3.86, iOS $5.70) and Japan (CPI: $6.35 iOS), driven by high CPMs
- Intent-driven installs produce strong IPM in Tier 1 East and emerging markets. Performs best where user intent is high, and CPMs are low
Entertainment
- Cheapest CPIs globally in Rest of World (Android $0.312) and Tier 2 East (Android $0.290), with IPM above 3.3 in both
- Most expensive in the United States (CPI: Android $7.18) and Japan (CPI: Android $5.22), where streaming competition drives up costs
- iOS Entertainment is cheaper than Android in the US and Japan, an unusual reversal versus most other verticals
- Works well at scale globally outside the United States and Japan
Financial
- The US Financial iOS CPI of $18.06 is the highest across verticals. Financial vertical in Japan for Android follows at $8.56
- Low CTR and IPM across all markets reflect friction, regulation, and compliance barriers inherent to the category
- Most efficient CPI in Tier 1 East (Android $0.447) and Tier 2 West (Android $0.870), though neither is cheap by global standards
- Returns depend entirely on long-term user value. Acquisition efficiency is rarely the winning metric here
Gaming
- Most efficient at scale in Tier 1 East (Android CPI at $0.179, IPM at 5.23) and Tier 2 East (Android CPI at $0.192, IPM at 4.05).
- CPI for Rest of World Gaming Android is $0.193, with IPM at 5.05, matching Tier 1 East efficiency and delivering broader geographic reach.
- iOS CPI spikes in Japan ($3.44) and the United States ($7.75), especially in premium genres.
- Highest volume category with strongest global ROI when market selection is disciplined.
Health and Fitness
- Tier 1 West delivers the best balance: H&F iOS CPI at $1.66 with IPM being at 4.22.
- Most expensive in iOS in Japan ($8.93) and the United States ($5.73), reflecting subscription-heavy demand from high-value users
- Tier 1 East CPI in H&F iOS is $0.667, which is notably low for a premium vertical and worth testing for subscription apps
- High-quality users across all tiers. ROI depends on avoiding premium-market CPI inflation
On-demand
- Most efficient Android CPI in Tier 1 East ($0.291) and Rest of World ($0.466), where CPIs fall sharply from US levels
- United States’ On-demand Android CPI at $4.88 and Japan’s Android at $2.10 are the most expesive geo combinations
- Japan’s On-demand vertical in iOS stands at $1.31 CPI – a notable exception in an otherwise expensive market
- Competitive vertical with tight unit economics. Success depends on LTV discipline more than acquisition efficiency
E-commerce
- Most expensive CPI in Tier 1 West (iOS at $18.20) and the United States (iOS at $12.59), where CPMs are also very high
- Most efficient in Tier 1 East (Android $0.482) and Rest of World (Android $0.465), where CVR is materially stronger
- Japan is expensive on both platforms: Android $7.64, iOS $9.85. Not an easy entry market for E-commerce advertisers
- Requires precise bidding and market selectivity. Seasonal and promotional competition heavily inflates costs in Tier 1 markets
Travel
- Most efficient in Tier 1 East (Android CPI at $0.282, IPM at 5.60) and Rest of World (Android CPI at $0.404, IPM at 4.35).
- Most expensive CPI in Japan (iOS at $11.97) and Tier 1 West (iOS at $6.82), though high-intent users justify the premium in both.
- Strong CTR and CVR globally, driven by visual and intent-rich creatives.
- Tier 2 East also delivers solid results: Android CPI at $0.494 with an IPM of 4.45. Strong vertical when timing and seasonality are managed
Utilities
- Lowest CPI across nearly every region, most notably Tier 1 East (Android at $0.169) and Tier 2 West (Android at $0.410)
- Highest IPM globally: Tier 1 East Android at 12.31, Tier 2 West Android at 10.93, Rest of World Android at 9.64
- United States’ Android CPM of $23.02 is the highest. Even at that cost, IPM 4.76 holds strong.
- Performance powerhouse vertical: cheap, efficient, and easy to scale across all tiers.
Monetization trends
Android drives scale and iOS drives value, but the split is not universal.
In most verticals, Android delivers the majority of installs while iOS captures a disproportionate share of revenue. This is most pronounced in Gaming, On-demand, and Other, where iOS generates 53-65% of revenue despite a much smaller install base.
There are clear exceptions in Q1 2026. Three verticals inverted the standard pattern. Health & Fitness flipped entirely: iOS now leads on both installs (56.3%) and revenue (64.9%), a complete reversal from prior quarters when Android held the majority. Entertainment flipped the revenue side: Android generates 74.1% of revenue despite having 60.1% of installs, driven by ad-supported streaming monetization. E-commerce also reversed: Android now leads revenue at 86.6%, above even its 82.7% install share, where iOS had historically captured disproportionate value.
The takeaway is clear. Platform strategy must be vertical-specific by design. iOS remains the monetization engine in most categories, but three reversals in a single quarter make the assumption of iOS-leads-value increasingly fragile.

Key insights by vertical
- E-commerce: Android drives 83% of installs and now leads revenue at 87%, a reversal from prior quarters when iOS captured disproportionate revenue. Reflects contracting premium iOS E-commerce spend and growing Android-focused emerging market monetization.
- Education: Android holds 84% of installs and a near-identical share of revenue (84%), making this the most platform-neutral vertical in the dataset. Platform-neutral monetization structure across both ecosystems.
- Entertainment: iOS accounts for 40% of installs but Android dominates revenue at 74%, an unusual reversal driven by the ad-supported streaming model. Android’s larger install base in non-premium markets generates more aggregate ad revenue than iOS subscriptions in this category.
- Financial: Android accounts for 77% of installs, with revenue now at near-parity (50.3% iOS, 49.7% Android). In prior quarters, iOS held a significantly larger share of Financial revenue. The compression is structural, as Android fintech monetization improves across Tier 1 East and EMEA.
- Gaming: Android delivers 85% of installs while iOS contributes 65% of revenue, one of the clearest examples of extreme monetization skew toward iOS. The install base is Android; the monetization engine is iOS.
- Health & Fitness: iOS now leads installs at 56%, a complete reversal from prior quarters where Android held a clear majority. iOS also drives 65% of revenue, consistent with the subscription-heavy monetization model of the category.
- On-demand: Android supplies 72% of installs, but iOS generates 53% of revenue, punching well above its 28% install share. The 4.6% ATT opt-in advantage in On-demand gives iOS advertisers here better measurement coverage than most other categories.
- Other: Android drives 86% of installs, yet iOS captures 65% of revenue, a 4.7x revenue multiplier over its install share. Consistent with the catch-all category skewing toward high-LTV iOS users in premium markets.
- Travel: Android holds 67% of installs and a closely matched share of revenue (65%), a 2-point gap that makes this the most balanced high-volume vertical. Neither platform holds a meaningful monetization premium over the other.
- Utilities: Android dominates both installs (88%) and revenue (77%). One of only two verticals where Android leads revenue outright. Driven by the ad-revenue monetization model and Apple restrictions that limit iOS Utilities footprint.
Bottom line
Three verticals inverted the standard pattern in Q1. H&F flipped on installs. E-commerce flipped on revenue. Entertainment runs an Android revenue premium. Platform strategy must be set at the vertical level, not assumed.
Ad network share of spend: biggest winners
Every quarter Singular tracks which ad networks are gaining spend and advertisers among its customers. Gaining spend means existing advertisers increased their allocation to that network. Gaining advertisers means new customers started using that network.
The strongest signal combines both: a network gaining spend from existing customers and adding new ones demonstrates durable, broad-based value.
All platforms combined
Basis spends: Facebook led all networks on combined spend gained in Q1 2026, ending TikTok’s multi-quarter run as the top gainer. Moloco ranked second, consolidating its position as a consistent top-5 DSP. GCP/DV360 entered the top four for the first time as a distinct vehicle from Google App Campaigns (adwords). adwords itself gained zero net spend. It is effectively saturated in its customer base and gains through new advertiser onboarding rather than budget expansion from existing ones.
Basis advertisers: adwords led new advertiser additions at 83, a reflection of how thoroughly App Campaigns have penetrated its customer base. Almost every new customer uses some adwords. Facebook added 76 new advertisers. Apple Search Ads added 43, consistent with its role as the standard iOS-first entry point for mobile UA teams. TikTok added 35 new advertisers despite gaining zero net spend: new customers are onboarding to TikTok, but existing advertiser budgets did not scale their TikTok allocation in Q1.
Index
Ad spend gained
Advertisers gained
1


2

3


4


5

6


7


8

9


10

11


12


13


14


15


Gainers by platform
GCP/DV360 led Android spend gains in Q1 2026, the first quarter a Google programmatic product other than App Campaigns topped the Android spend rankings. Unity Ads ranked second, consistent with its Gaming vertical concentration. Moloco, Adjoe, and Liftoff round out the top five. TikTok gained zero Android spend. adwords led Android advertiser additions at 70, with Facebook adding 45 – both reflecting new customer onboarding rather than budget expansion.
Index
Ad spend gained
Advertisers gained
1
2
3
4
5
6
7
8
9
10
Facebook’s iOS dominance in Q1 is striking: it gained nearly 5x the second-place network (Moloco). This reflects Facebook’s ability to capitalize on the iOS impression supply expansion, where 13.3% more inventory became available. Facebook’s scale and optimization infrastructure captured a disproportionate share of that new supply. Apple Search Ads added 43 new iOS advertisers, the most of any non-Meta/Google network, reinforcing its position as the primary high-intent iOS acquisition channel.
Index
Ad spend gained
Advertisers gained
1
2
3
4
5
6
7
8

9
10
The broader takeaway is diversification. Marketers are increasingly building multi-partner strategies that balance scale, intent, and efficiency, rather than relying on any single network to do everything.
Ad network share of voice by vertical
Here’s another way to look at the data: top ad networks by vertical in a table format.
Important note: Google and Meta are tops in almost everything, so we’ve excluded them from this list. As you see each list of ad networks, just mentally add Meta and Google to each.
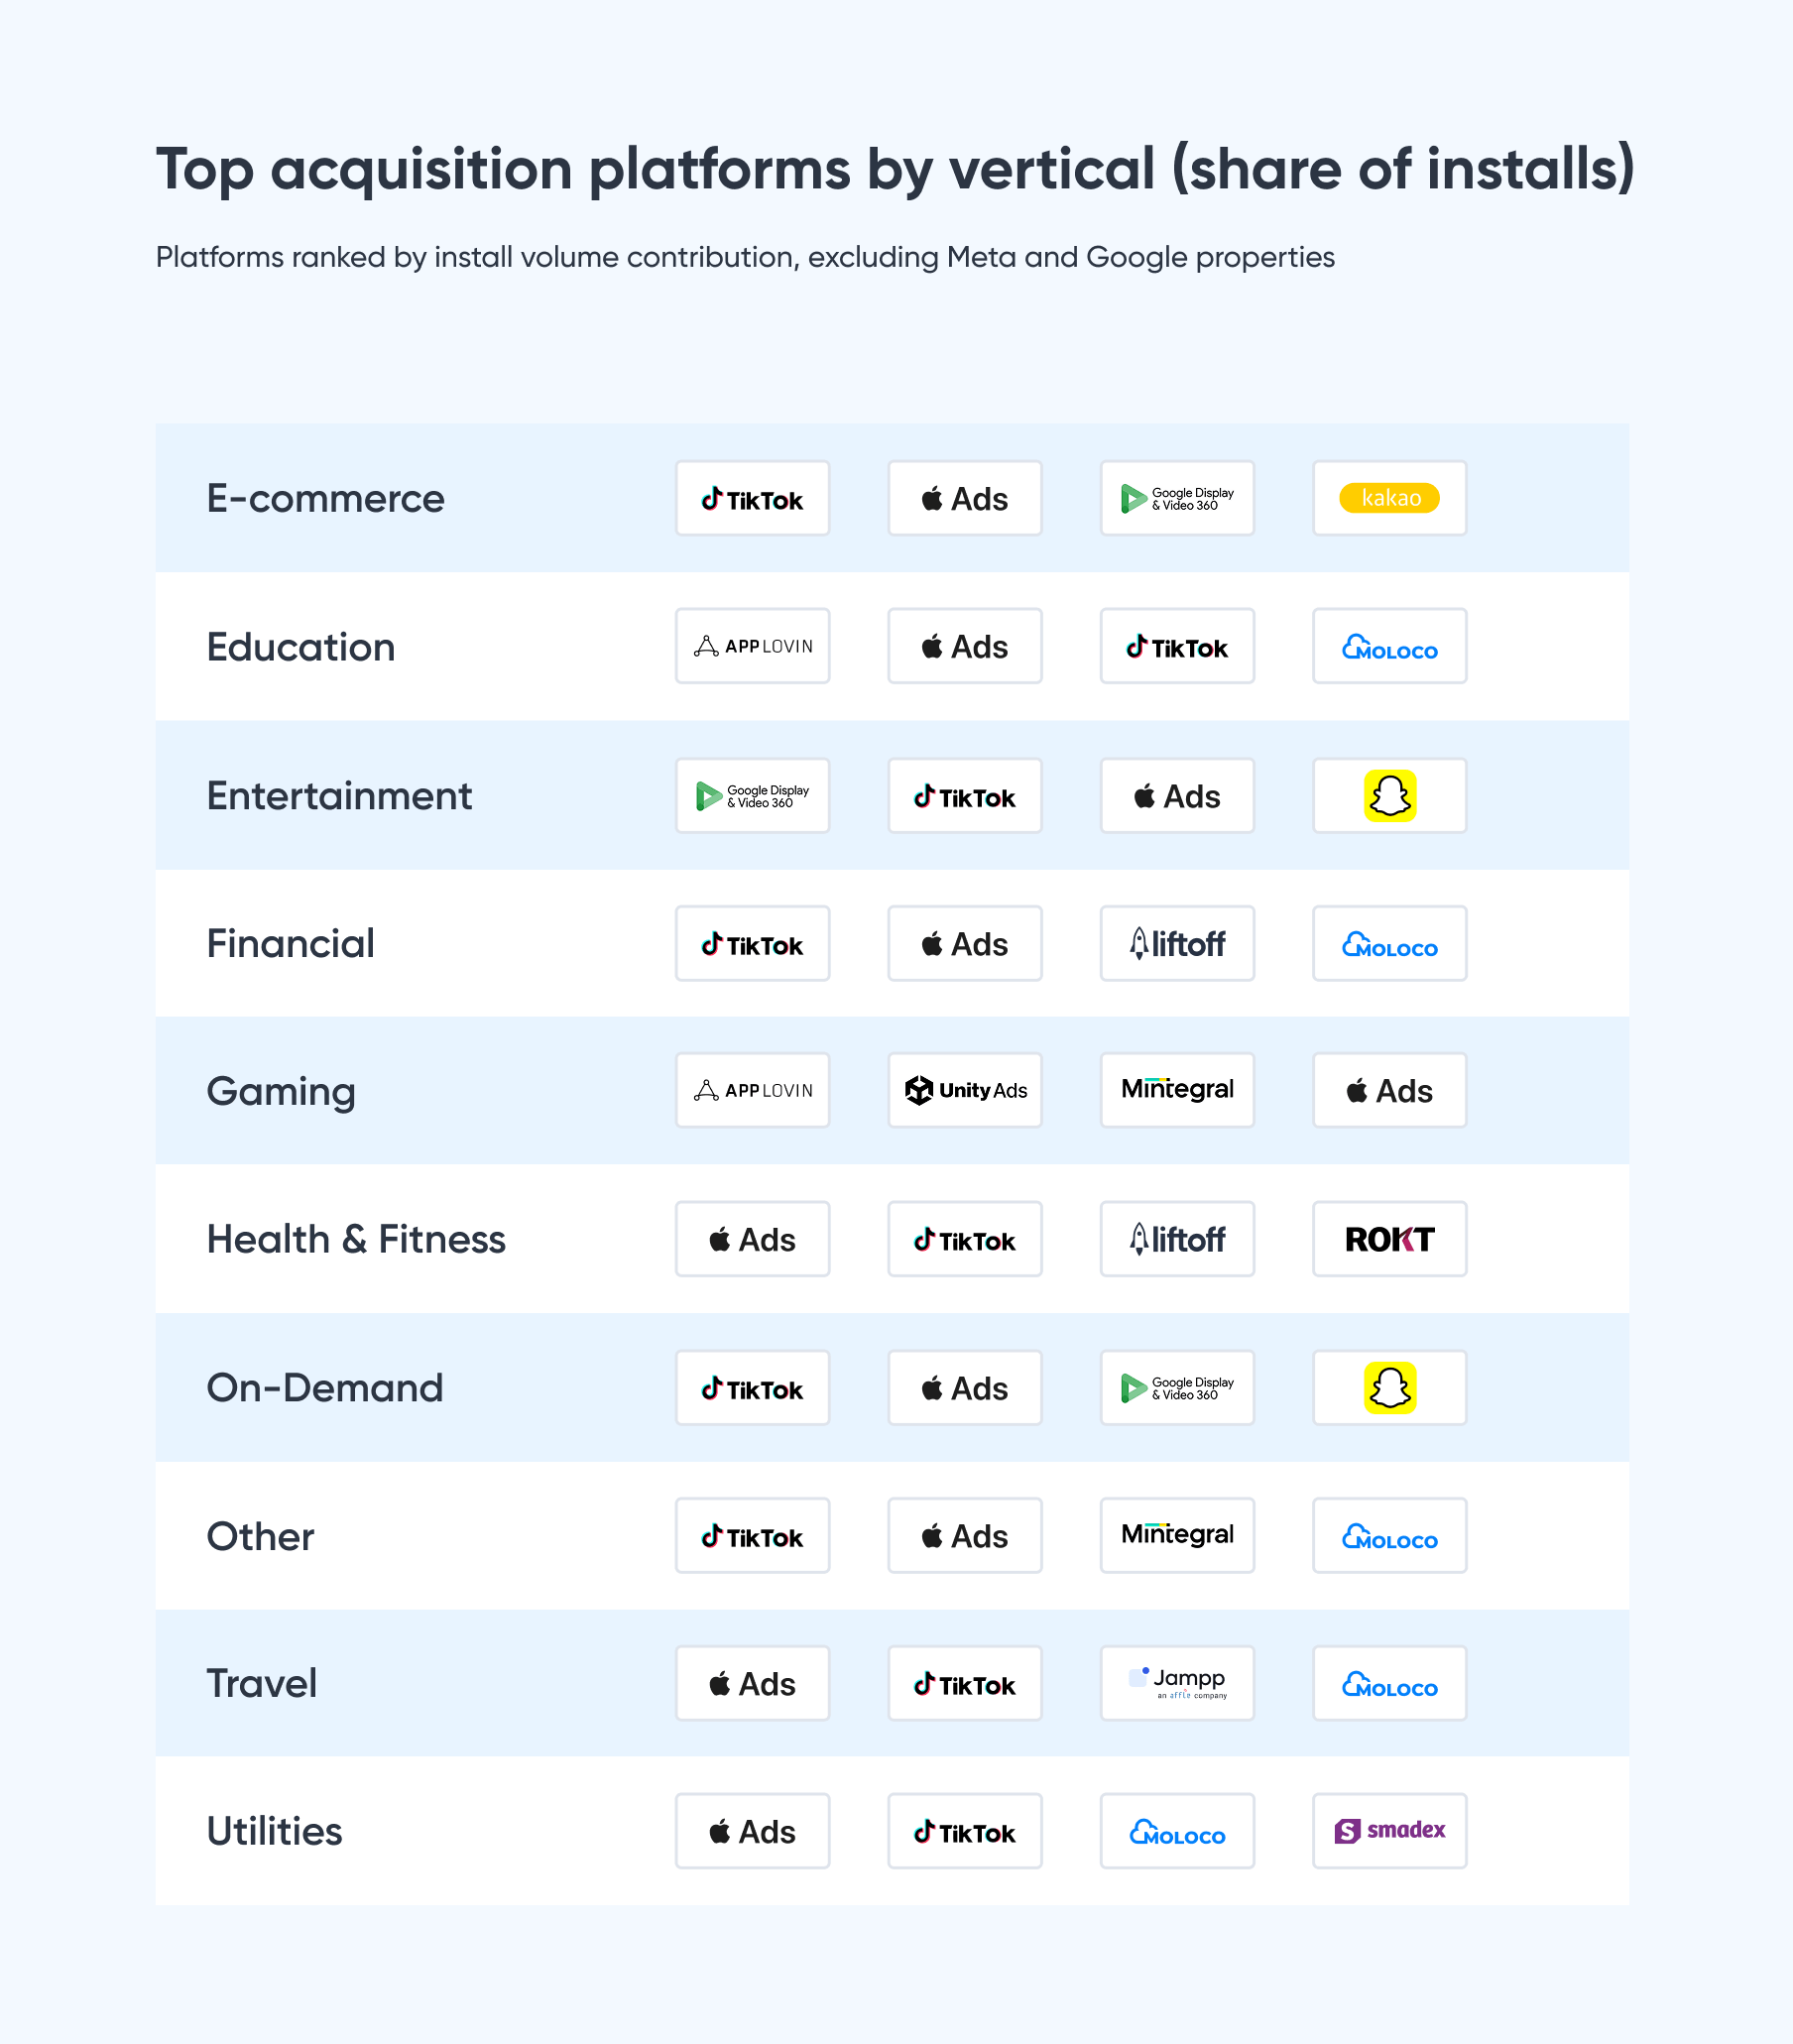
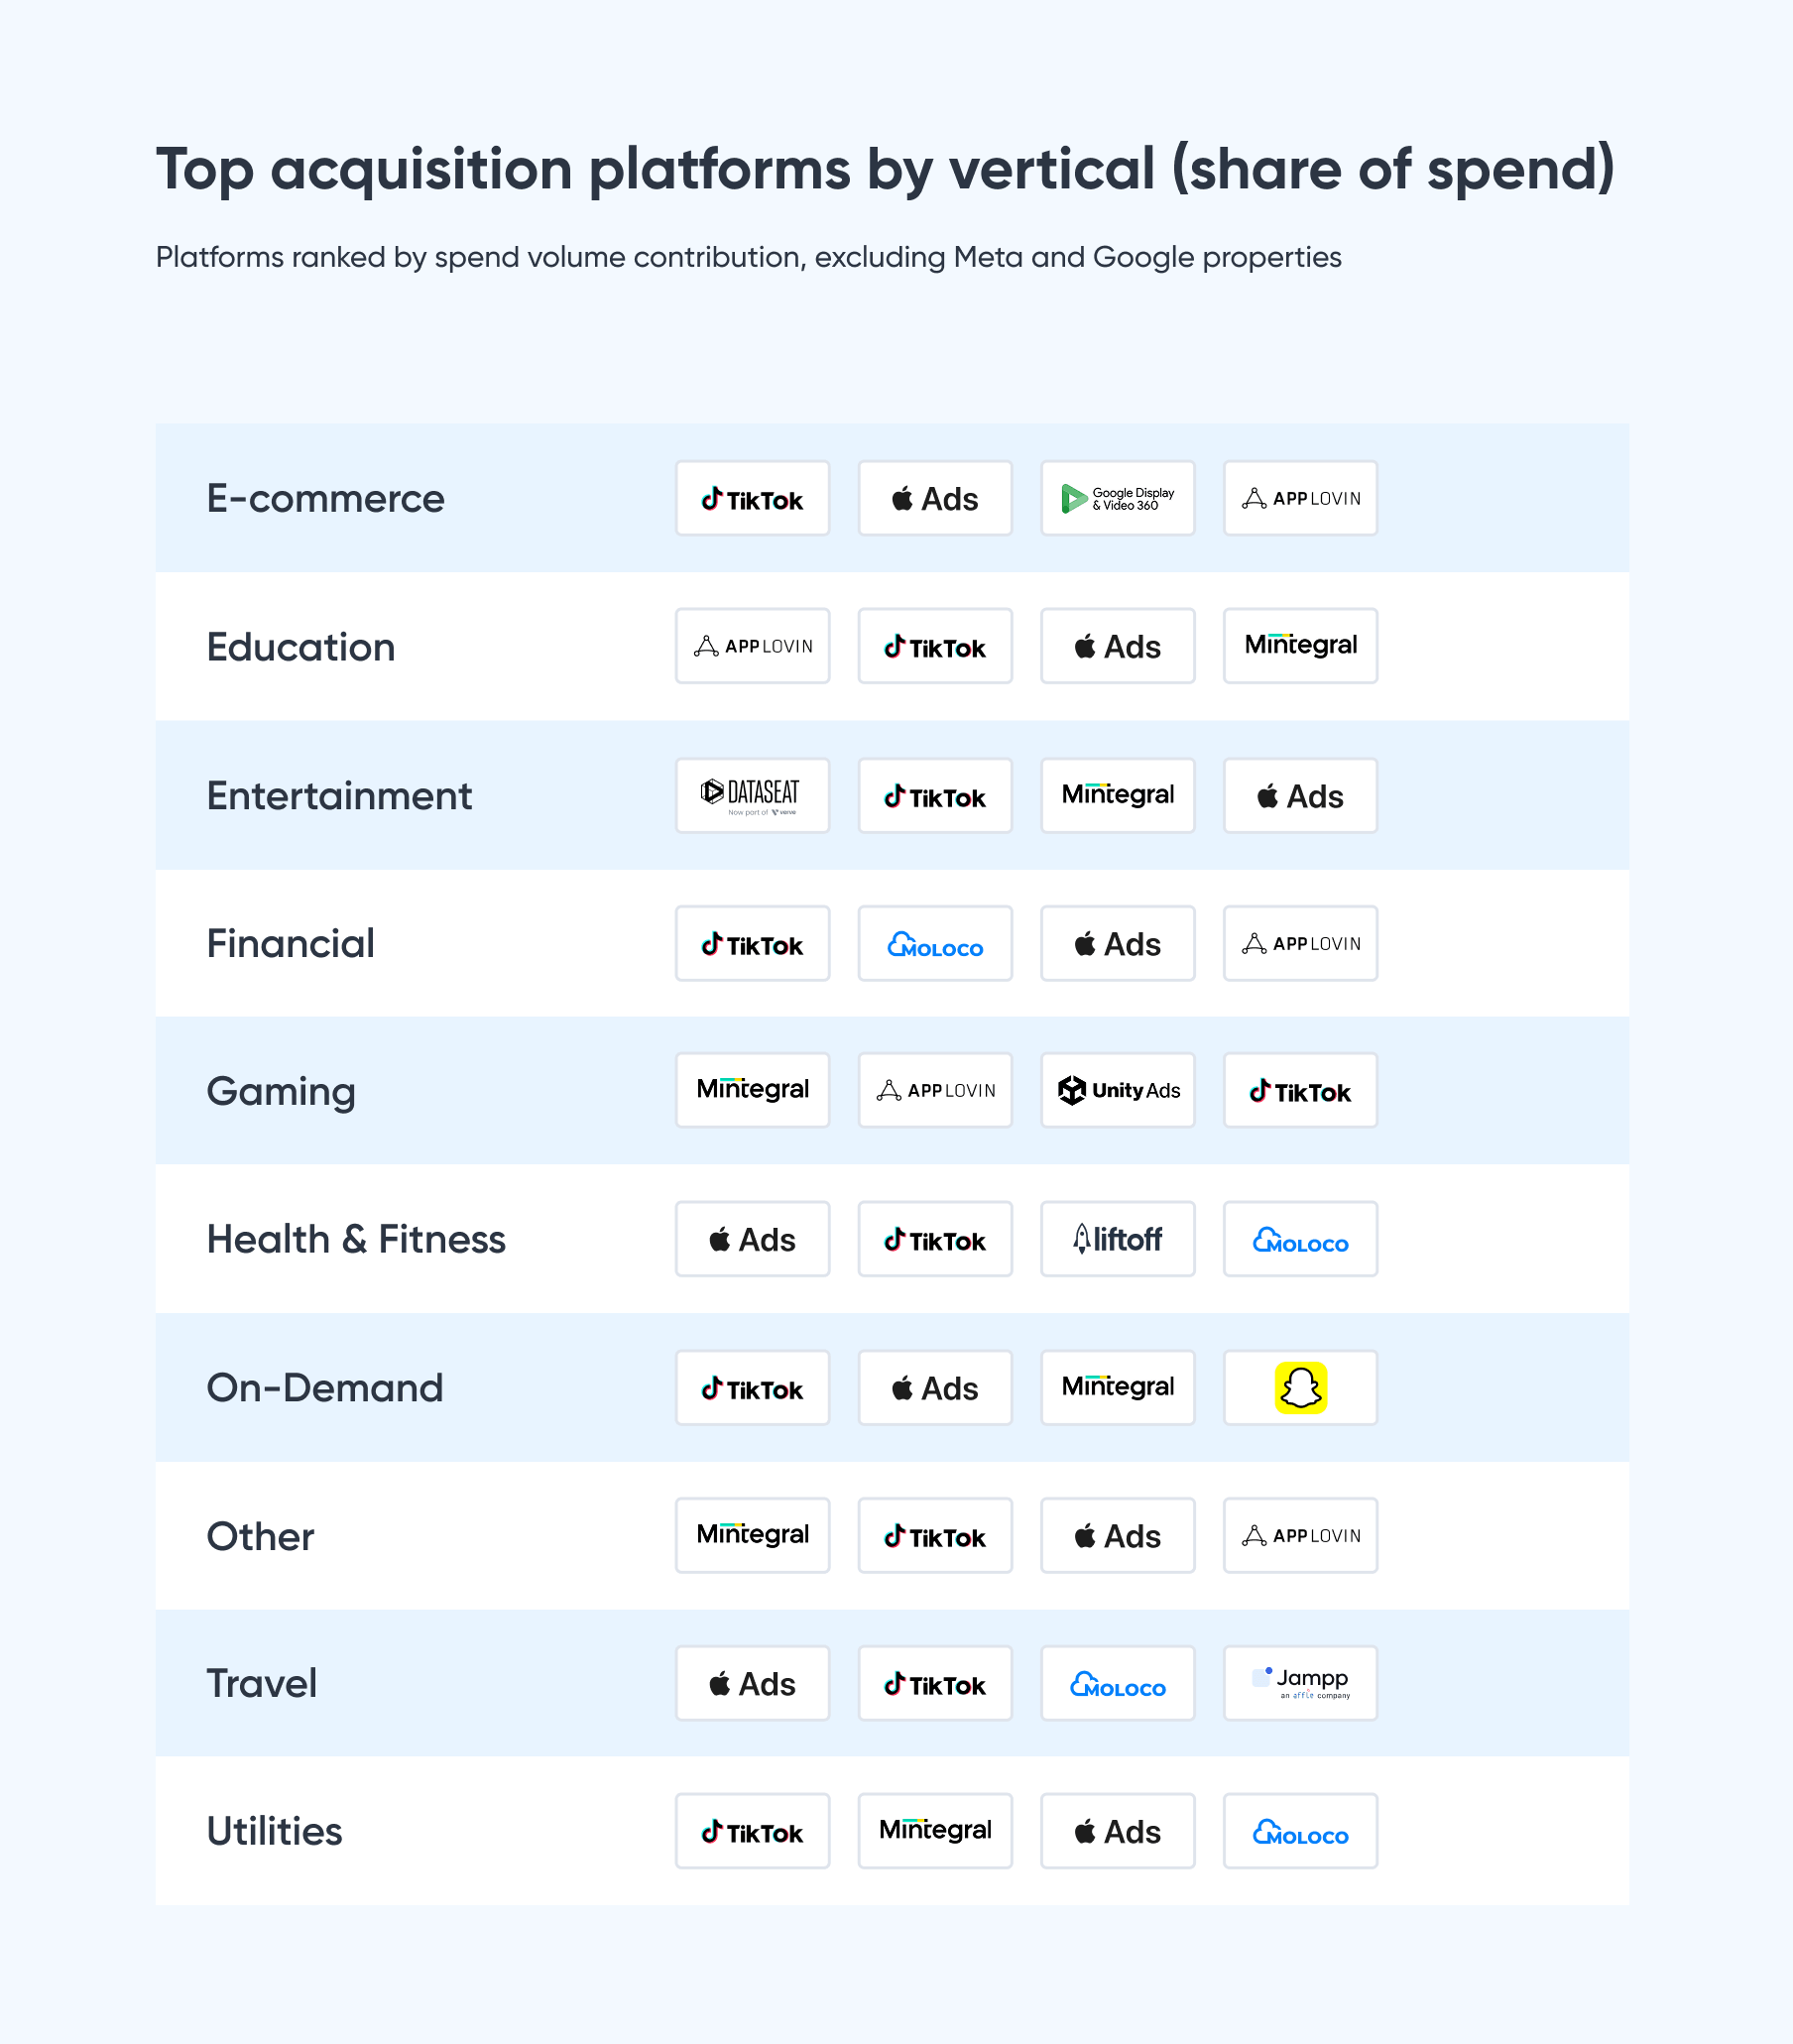
Key findings
- Google leads spend and installs in every vertical. Utilities and Travel are the deepest positions. The 65.7% Utilities install share is the highest single-network vertical figure in the dataset.
- Meta’s strongest positions are where audience quality matters most. H&F (51.3% installs), Financial (40.1%), and Education (39.8%) are not volume plays. They reflect premium user targeting at a premium price.
- TikTok holds real vertical positions despite zero net spend gain this quarter. E-commerce is the standout: 10.6% of spend but 34.5% of installs. More installs per dollar spent than any other network in that vertical. Travel shows the same pattern.
- Apple Search Ads owns the high-intent iOS verticals. Travel install share at 32.6% is the highest single position for any non-Google or Meta network in the dataset. H&F and On-demand follow the same logic: users actively searching for an app in a specific category.
- Mintegral concentrates in Gaming and Other. Spend share in both runs well ahead of install share, consistent with premium inventory commanding higher CPIs.
- GCP/DV360 has one distinctive position: 20% Entertainment install share. It barely registers elsewhere. This is programmatic video for streaming app acquisition, not a broad play.
- Moloco shows up consistently across Gaming, Financial, and Entertainment on both tables. Its Gaming install share (4.8%) is four times its spend share (1.1%), the clearest efficiency signal of any DSP in the dataset.
Bottom line
Beyond Google and Meta, vertical fit is what determines network value. TikTok owns E-commerce and Travel efficiency. Apple Search Ads owns intent-driven iOS. Mintegral owns Android Gaming and Other. GCP/DV360 owns Entertainment programmatic. Moloco is the consistent DSP challenger. Use each network where the data says it outperforms.
Partner insights
REPLUG
Post-Click Conversion Trends: The Store Layer as a Driver of Paid Efficiency (2026)
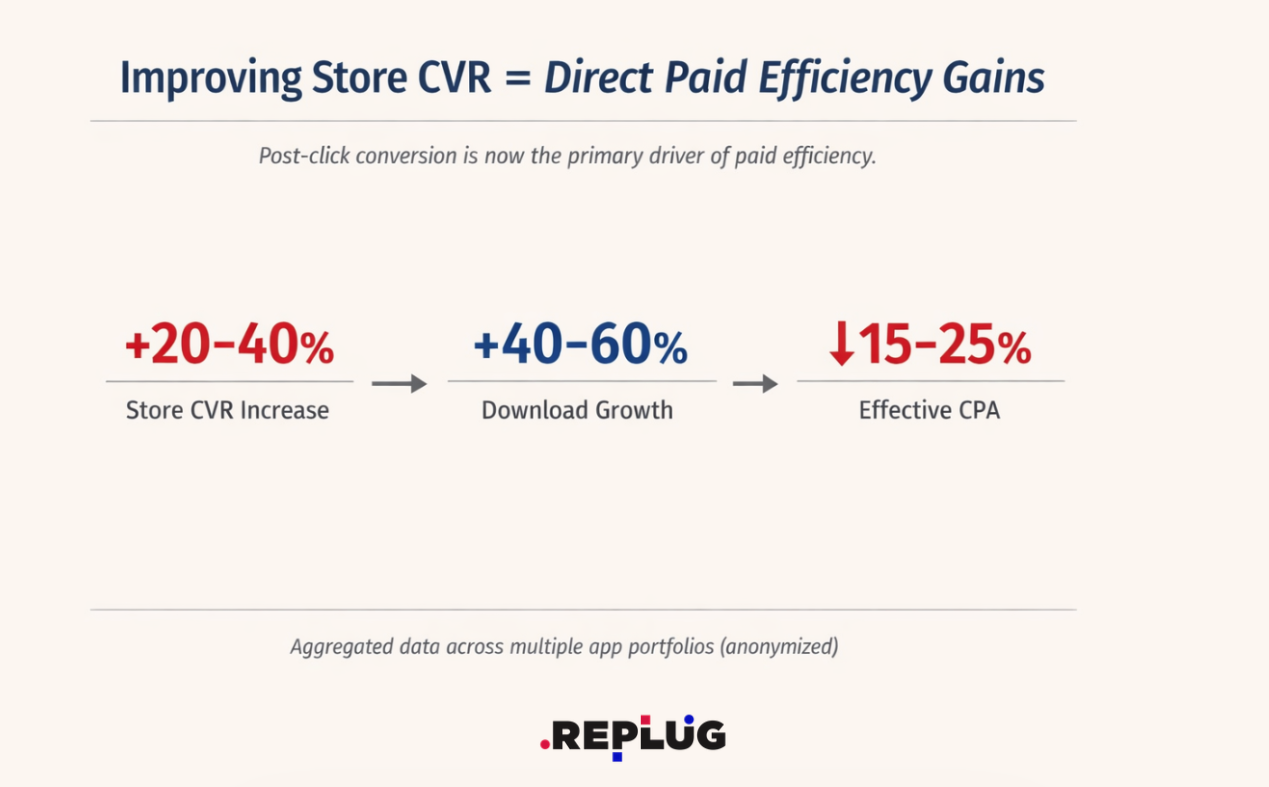
Across multiple app portfolios, improving store conversion rate consistently reduced acquisition costs and improved paid efficiency, without requiring increases in spend.
From the data gathered by REPLUG, ASO-led testing and creative refinement drove 20-40% improvement in CVR, while broader storefront optimization contributed to 40–60% growth in downloads across markets.
In parallel, stronger storefront performance reduced acquisition costs and improved ROI, showing that post-click conversion is now a measurable efficiency lever, not just an organic growth metric.
This is happening because user acquisition systems are getting better at buying traffic than converting it, and that gap is where efficiency is lost.
Targeting, bidding, and delivery are increasingly automated across major channels, which means competitive advantage shifts downstream to the moment where intent is either captured or lost: the store page.
When screenshots, positioning, and metadata do not reinforce the promise made in ads, the system leaks value after the click. As a result, store CVR is no longer an ASO-only KPI; it is part of overall paid efficiency.
For marketers, the takeaway is to treat the app store page as a performance surface, not a publishing asset. Scaling paid UA without improving store conversion increasingly leads to diminishing returns.
The teams seeing the best efficiency gains are not separating ASO from UA; they are managing the store layer as part of the acquisition funnel. In practice, that means prioritizing continuous CVR testing, evaluating creatives based on install efficiency rather than aesthetic preference, and measuring the store page by how much paid traffic it converts.
1. Store Creatives Are Becoming Part of the Same Creative System as Ads
Across multiple app portfolios, improving store creatives directly impacted acquisition performance, not just storefront metrics.
Rigorous testing of screenshots and creative assets drove 20–40% gains in conversion rates, while broader creative and metadata optimization contributed to 40–60% growth in downloads and stronger ROI. The pattern is consistent: when store creatives improve, paid performance improves with them.
The reason is that users experience ad and store assets as one continuous journey, even if teams still manage them separately.
Ads generate the click, but store creatives determine whether that intent converts. When the message hierarchy, visual language, or value proposition shifts between the ad and the product page, intent decays before conversion — resulting in a direct loss of paid efficiency.
This makes the store page an extension of the creative system rather than a separate ASO layer.
For marketers, the implication is clear: creative strategy should be judged end to end.
Creative doesn’t fail in the ad, but it does fail on the store page. Winning ad concepts should inform store-page variants, and store learnings should feed back into paid creative development.
The opportunity is not just higher CVR in isolation, but less post-click conversion loss across the entire acquisition system.
2. Testing Velocity Is Emerging as a Growth Constraint
Execution speed is increasingly a performance variable, not just an operational detail.
Across multiple app portfolios analyzed, streamlining ASO processes reduced optimization timelines by 30–40%, while faster launch and iteration cycles were associated with ~30% faster growth rates for newly optimized apps.
The pattern is clear: faster implementation leads to faster performance gains.
This matters because store experiments only create value when learnings are implemented quickly. In today’s environment, paid teams can refresh creatives rapidly, competitors shift positioning faster, and user expectations evolve in shorter cycles.
The bottleneck is no longer a lack of ideas, but slow decision-making, fragmented ownership, and subjective approval loops. When implementation lags, performance stalls, even when the right insights are already available.
For marketers, testing velocity should be treated as a performance metric. The goal is not to run more A/B tests, but to shorten the path from insight to rollout.
Teams that reduce implementation lag can compound gains faster, maintain efficiency as market conditions shift, and turn ASO into an always-on performance lever rather than a periodic optimization channel.
VYBS
Rewarded Isn’t the Future of Mobile UA. It’s the Present.
Three reasons rewarded platforms quietly took the majority of UA spend at top mobile game studios – and why the rest of the industry is next.
VYBS is an AI-powered rewarded platform that connects mobile games with a high-intent player base through intelligent matching models. We don’t deliver installs – we deliver activated, qualified, engaged players. Our bidding model optimizes against the metrics studios actually care about: ROAS and long-term retention. Across over 3 million activations delivered to mobile-game studios in the past year, the data tells a clear story: the rewarded channel has matured.
A few years ago, rewarded was a useful supplement – a way to top up volume after a studio had exhausted other media channels. In the last year that role has flipped at the studios paying the closest attention. Walk into the UA war room of a top-grossing mobile game studio today and you’ll see rewarded platforms sitting at the top of the spend pie chart. Three structural shifts drove the reversal.
1. Faster recouping – studios take less risk and sit on the cash
Payback is the metric that separates UA decisions in 2026 from UA decisions in 2022. With LTV tails compressing under signal loss and tighter cash discipline at every studio, the question is no longer will this cohort recoup? – it’s how fast will we know?
Faster recoup means less working capital tied up in unproven cohorts. It means more reinvestment cycles per quarter. It means studios can scale aggressively because the floor of risk is lower. In a market where capital is the constraint, that compounds.
2. Technology – ROAS optimization, because not all users are alike
The old rewarded model treated every user the same. Set a bid, take whatever traffic the network sent, hope the average paid out. The result was the perception problem rewarded has lived with for a decade – it worked on aggregate, but variance was brutal, and the high-quality users were buried in noise.
VYBS broke that. Our ROAS Optimization model bids on every individual user against the studio’s actual ROAS target, using prior-behavior signals, category-affinity scoring, and more – to decide who’s worth what, in real time, on every impression. When a studio tells us “we want a Day-30 ROAS of 50%,” we don’t lower a bid floor and pray. We bid up on the users we predict will hit that target and bid down – or to zero – on the ones we predict won’t.

3. User quality – the “low-quality rewarded user” myth is over
The hardest perception to shake is the oldest: that rewarded users churn the moment the reward lands, never pay, and never come back. That’s not how rewarded works anymore – and it hasn’t for some time.
The shift is structural. The rewarded platform of 2026 isn’t the rewarded network of 2018. Today’s platform runs on behavioral data – engagement patterns, retention signals, value scoring – and uses it to surface high-quality players, not just whoever’s around. That’s a categorical change, not a degree-of-rewarded change.
The bottom line
Rewarded won the budget conversation at the top of the market because it solved three things at once that mobile UA has rarely combined in one channel: faster cashflow, smarter bid mechanics, and a higher-quality user pool than its reputation suggests. Studios that adopt rewarded properly – bidding against deep events, leaning on platform-level prior-behavior signals, treating it as performance UA rather than incentive arbitrage – are not running an alternative to paid social. They’re running ahead of it.
The next twelve months won’t decide whether rewarded becomes a meaningful UA channel. That decision is already made. The next twelve months will decide which studios were early enough to compound the advantage, and which ones were still arguing about whether rewarded counts as “real” UA while their competitors were already done.
Smadex
CTV Performance and Its Impact on UA Strategies
Connected TV is moving from an experimental line item to a complementary performance channel for Apps and Games. Smadex presents proprietary platform data alongside industry benchmarks to demonstrate that CTV is no longer a brand-awareness play – it is a measurable, scalable driver of mobile User Acquisition and Re-Engagement.
- The Power of the “Second Screen”
It’s a well-established truth (no expert fact-checker needed) that 88% of your audience engages in mobile multitasking while watching TV. Most of us keep our phones close or in hand while binge-watching our favorite shows. This represents a huge opportunity for mobile apps and games to seamlessly engage with a receptive audience in the comfort of their living rooms.
This behavioral reality allows performance marketers to bridge the gap between the storytelling power of the Big Screen and mobile UA precision. The synergy between the 85-inch and 6-inch screens set the perfect stage for simultaneous sensory engagement that drives intent. By leveraging the power of the “second screen,” we can turn high-impact impressions into a direct conversion funnel for apps.
CTV Performance Snapshot
Smadex CTV Performance Snapshot
| Metric | What the Data Shows | Why It Matters |
| CTV Spend Growth | Over a 2,000% increase from 2023 to 2026, with significant acceleration in 2025. | CTV is transitioning from experimental budgets to an always-on UA strategy. |
| Cross-Screen Behavior | Consistent correlation between CTV exposure and near-term mobile app install activity. | TV is functioning as a measurable driver of mobile performance. |
| US Reach | 90% household penetration; 250M+ viewers. | Near-universal access to audiences beyond existing mobile channels. |
| Supply Path Discipline | Spend concentrated across premium, signal-rich publishers with reduced intermediary layers. | Cleaner supply paths support transparency, fraud resilience, and stable optimization. |
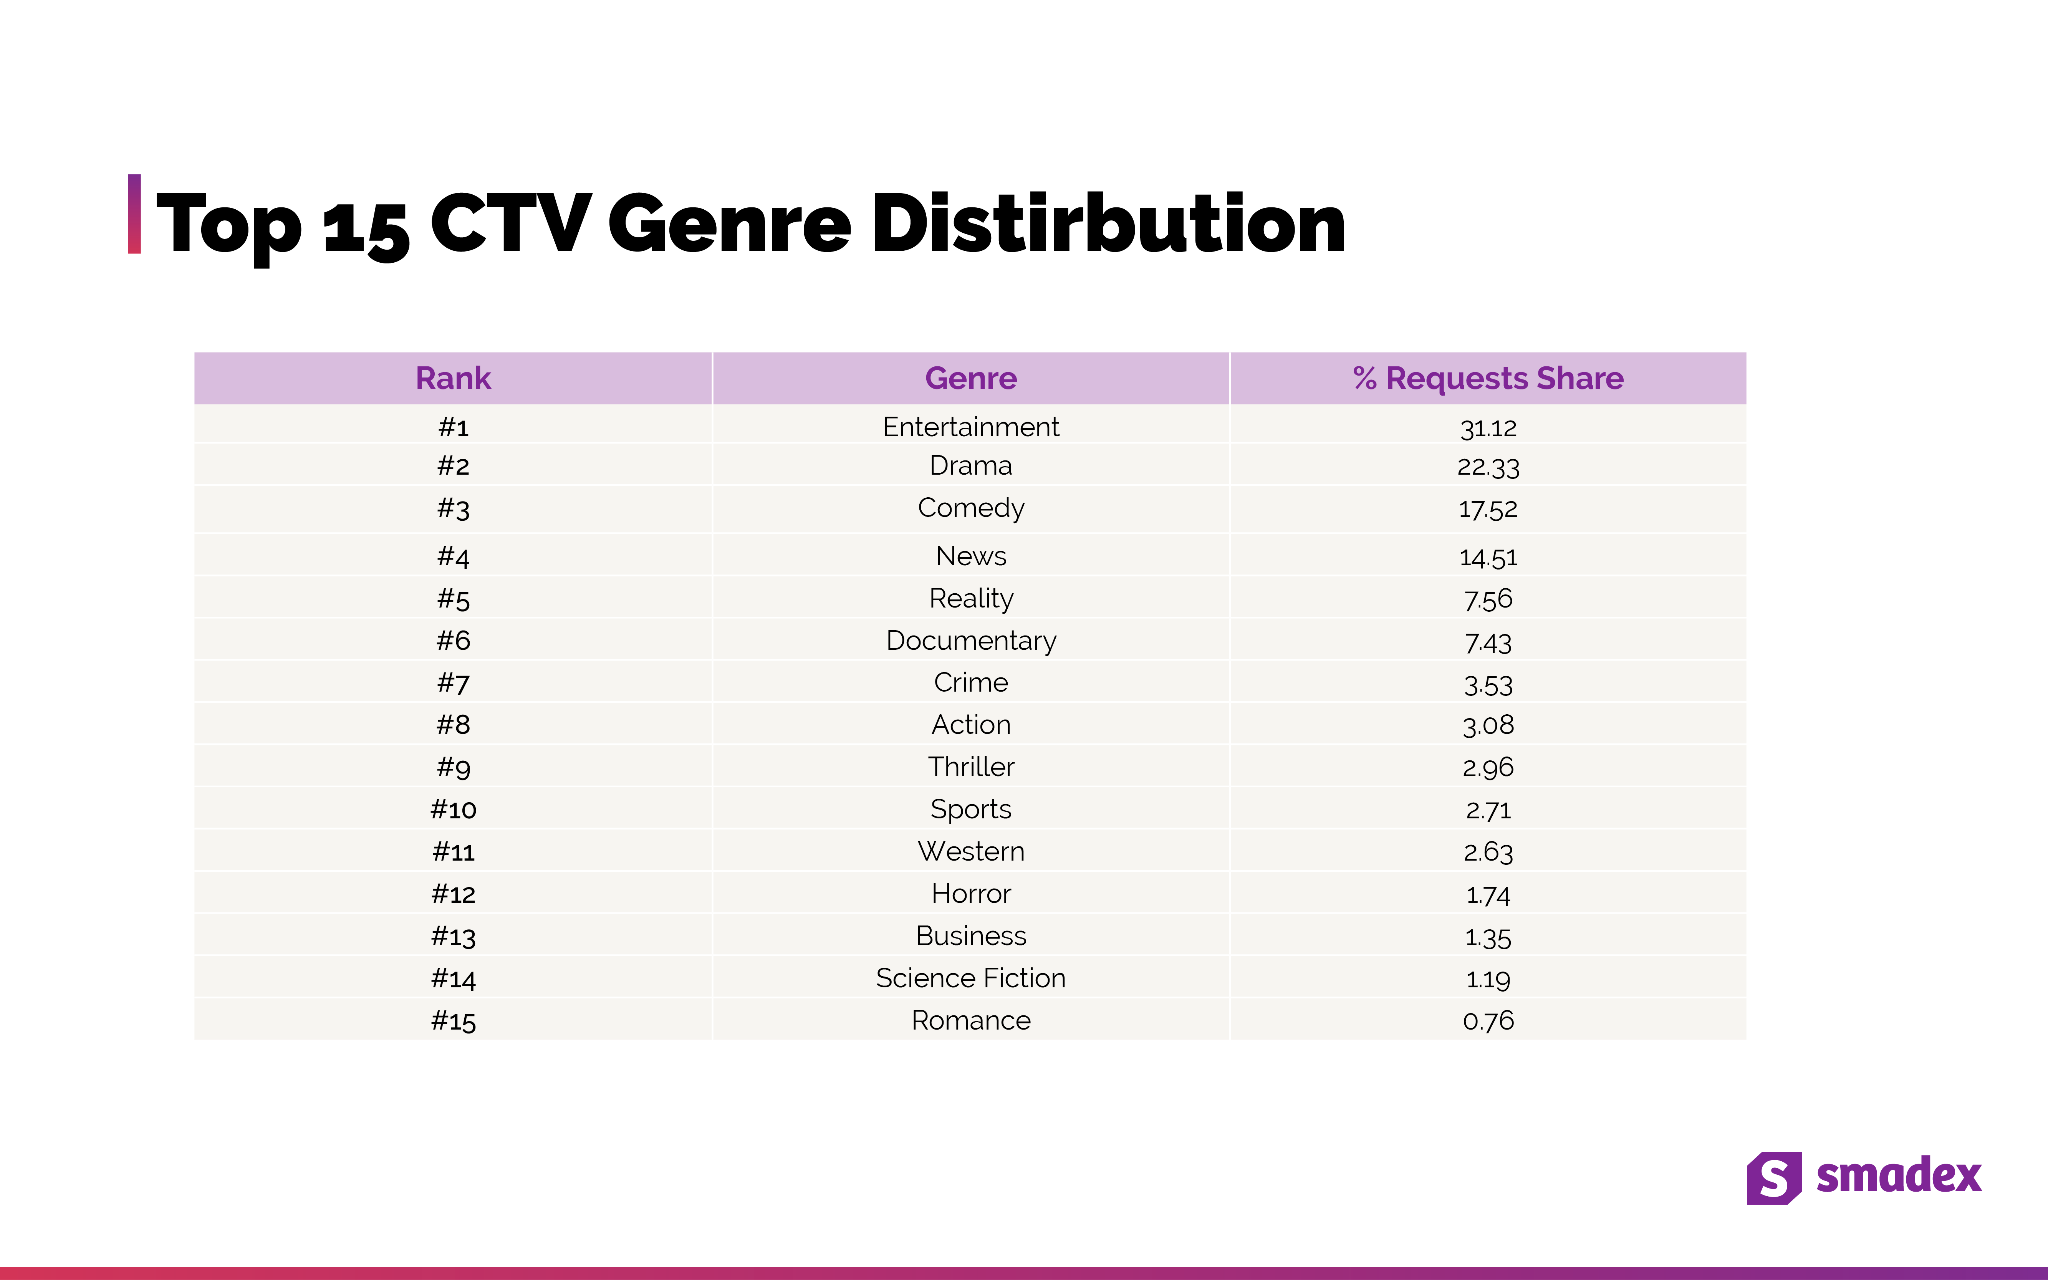
| Signal Coverage | High contextual signal availability at the content (93%) and genre (76%) level. | Signal completeness directly supports predictive AI bidding and optimization accuracy. |
| Genre Distribution | Inventory is strongest in Entertainment (31%), Drama (22%), Comedy (18%), and News (15%). | Performance scale aligns with high-engagement content categories. |
| Vertical Adoption | Strongest adoption in Gaming, RMG, Finance, Social, and Education apps. | ROAS-driven verticals are integrating CTV into measurable UA strategies. |
Additionally, innovative CTV ad placements help further bridge the gap. Home Screen Native Ads capitalize on being the first point of interaction from the moment the TV is turned on to content selection, offering a 100% share of voice. Similarly, Pause Ads turn a user-initiated break in viewing into an unparalleled high-impact conversion opportunity. During this extended time, where dwell time is around 2.5 minutes, marketers have the ideal environment to test tools such as QR codes, enabling users to seamlessly bridge their engagement from the TV screen to a direct action on their mobile devices, which is surely nearby.
This convergence of TV and mobile behavior presents a clear roadmap for performance marketers. By recognizing the ‘second screen’ reality and utilizing innovative CTV ad formats like Home Screen Native and Pause Ads, advertisers can move beyond simple awareness to directly drive mobile conversion. The living room is now a prime, engaged conversion environment, waiting to be leveraged.
- Data-Driven CTV Success: Proven Incrementality
One of the most common objections to CTV is that it “steals” credit for organic installs. An 81,4% install rate within the first hour of an impression puts that fear to sleep. An extensive incrementality test using a compressed 1-hour attribution window to specifically measure the immediate “upper-funnel to mobile” impact showed that CTV is a measurable driver of mobile growth.
The results were definitive: not only did a vast majority of installs occur immediately following the TV ad, but 91.2% of those households had no prior interaction with the app. The immediate, incremental uplift in mobile installs, overwhelmingly driven by new users, demonstrates CTV’s power to directly influence high-value outcomes for app marketers.
This success is possible thanks to Smadex’s pre-trained AI-engine. Our proprietary DNN technology evaluates 9 million queries per second, leveraging decades of mobile intelligence to recognize high-value users before a single dollar is spent. By syncing CTV signals with mobile devices in the household, we create a unified strategy. Every impression feeds back into the system, which continuously learns and refines predictions in real time, ensuring we target the right users with precision.
Signal Architecture: What Drives Performance
From a platform perspective, CTV performance is influenced by signal availability and quality. Smadex bid-stream analysis shows the following signal coverage levels
- Content: 93%
- Genre: 76%
- Content Rating: 73%
- Language: 61%
- Channel: 23%
- Title-Level: 17%
Higher coverage at content and genre level provides strong contextual inputs for machine learning optimization. Lower coverage at title and episode level reflects broader ecosystem-level data limitations rather than platform-specific constraints.
Source: Smadex internal CTV bid-stream and request-share analysis (2025/26).
Genre request-share distribution indicates that performance inventory is most concentrated in:
- Entertainment (31%)
- Drama (22%)
- Comedy (18%)
- News (15%)
This distribution reflects where scale and contextual signal availability intersect most consistently in CTV environments
The synergy between Connected TV (CTV) and mobile behavior has made the living room a powerful conversion environment for User Acquisition (UA) strategies. The nature of the “second screen” allows performance marketers to bridge TV’s high-impact storytelling with mobile precision through innovative formats. By leveraging technologies like Smadex’s pre-trained engine for precision targeting, performance marketers can solidify CTV as an essential, high-value driver of mobile growth and new user acquisition.
AdQuantum
Trend 1:
Meta’s Andromeda update has fundamentally shifted UA toward a creative-first model
Meta’s Andromeda rollout has redefined how performance is driven on the platform, making creative the primary lever for scale rather than targeting or account structure. At the same time, it is forcing marketers to prioritize creative quality over sheer volume: while AI has made ad production faster and cheaper, often leading to an oversupply of lower-quality assets. Meta is introducing new thresholds and filtering mechanisms to restore structure and ensure a more efficient auction environment.
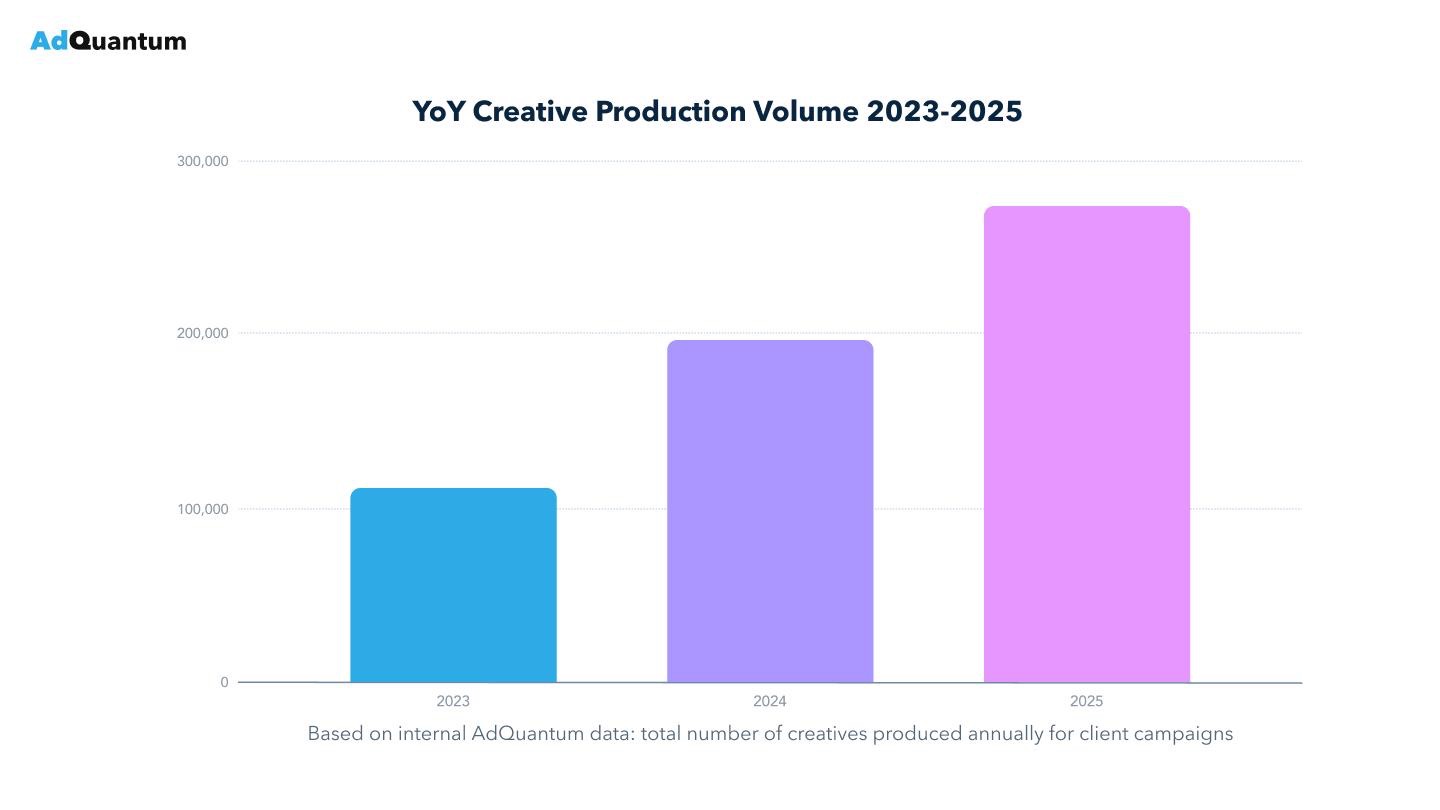
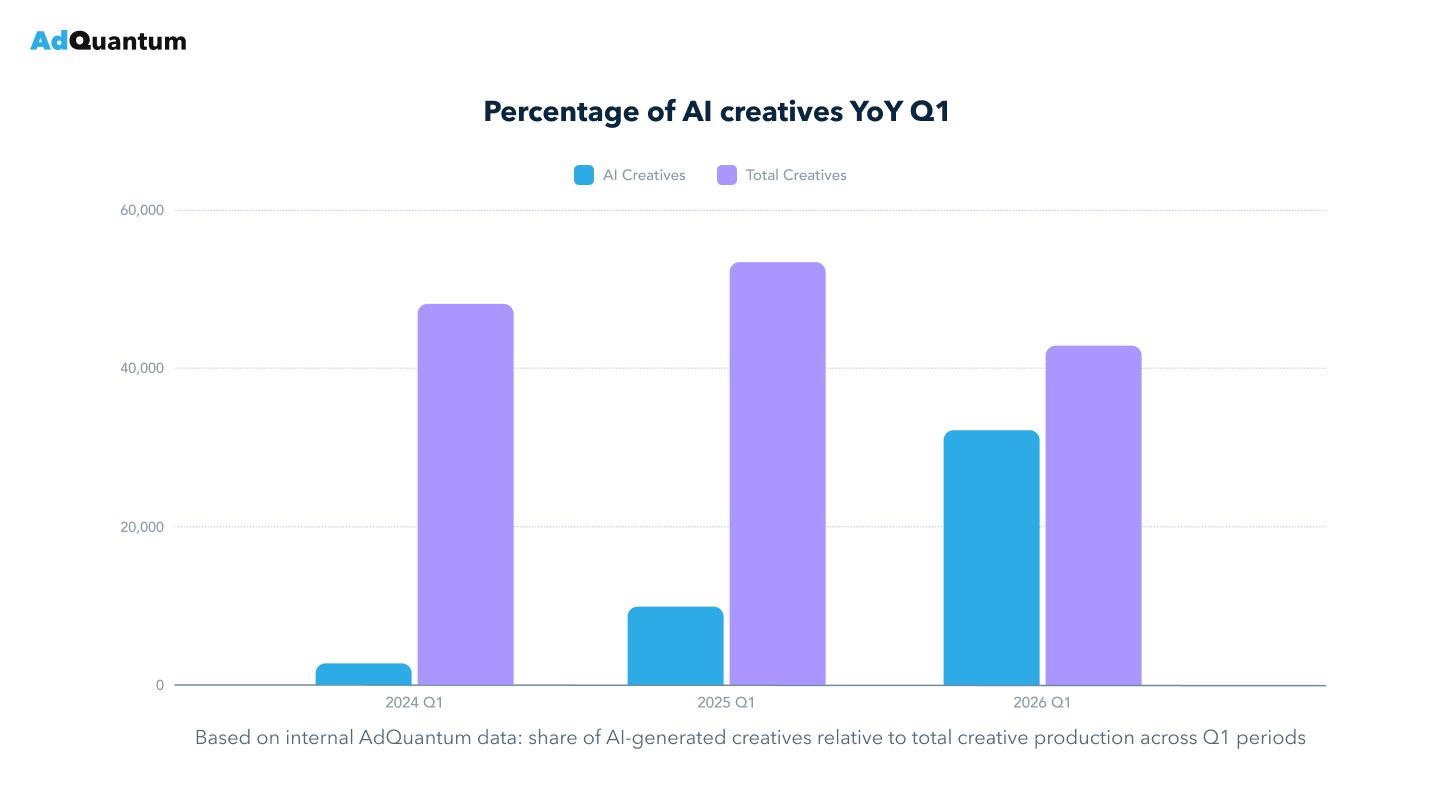
This shift becomes especially clear when looking at how creative production evolved over time. In 2023, AI in creative production was still largely experimental: tools like Midjourney and Stable Diffusion were used in isolated cases, often locally, and rarely made it into production-ready ad creatives. Over the past year, however, rapid adoption of AI significantly increased the overall volume of creatives, as reflected in the growing number of assets produced across campaigns.
Meta no longer treats minor AI variations as unique inputs, which reduced their effectiveness. Combined with growing user fatigue toward AI-style creatives, this has driven a shift back to concept-driven production.
Post-Andromeda, user behavior has also adapted. As AI-generated creatives became more widespread, audiences started to develop fatigue toward recognizable patterns and styles, which further reduces their effectiveness compared to more original, human-like concepts.
This shift is also visible in the data: after rapid growth in AI-driven creative adoption between 2024 and 2025, the share of AI creatives has already declined in Q1 2026, signaling a transition from variation-based scaling to more concept-driven approaches.
As a result, creative now has a stronger impact on performance than ever before. Meta’s algorithm has become significantly better at interpreting both static and video creatives and using them as core signals for audience matching. In practice, this means that creative has effectively become the new targeting, enabling broader setups where performance is defined by how well the creative communicates value.
Trend 2:
Andromeda has made Meta’s testing more selective and learning more signal-driven
The Andromeda update has introduced a more aggressive filtering mechanism in the learning phase, fundamentally changing how testing and optimization work on Meta.
In high-volume testing setups, up to 90-95% of creatives may receive little to no spend, as the system quickly prioritizes only the strongest signals. This has turned testing into a high-stakes selection process, where only clearly differentiated creatives can break through.
At the same time, CPMs have increased by ~15%, raising the cost of experimentation and making inefficient testing significantly more expensive. Pixel learning has also slowed down, often taking up to 2× longer, but this reflects a shift toward higher-quality signal processing rather than speed. For example, persistently high CPMs at the top of the funnel now act as a strong diagnostic signal that the algorithm is struggling to understand the product or identify the right audience.
Andromeda has also invalidated legacy scaling strategies. Campaign duplication and excessive account fragmentation no longer produce results, leading to a clear shift toward simpler, more consolidated account structures.
Advertisers who adapt to these dynamics, focusing on creative quality, signal clarity, and structured testing are seeing more stable learning and longer campaign lifecycles, while those relying on legacy tactics are facing diminishing returns.
Footnotes
Countries and tiers
We look at global data through a number of filters. One is country tiers, which because of our customer base we define as:
- China
- Japan
- Rest of world
- Tier 1 East: Korea, India
- Tier 2 East: Taiwan, Indonesia, Turkey, Thailand, Philippines
- Tier 1 West: Canada, France, Germany, UK
- Tier 2 West: Australia, Mexico, Brazil, Spain, Italy, Netherlands, Poland
- United States
About this data
All of this data is based on Singular’s view of the adtech ecosystem. While we have a significant share of the Mobile Marketing Platform space and see a huge amount of data, our insights will be biased towards actively marketing and growing apps that are spending significantly on user acquisition.