
Introduction and TLDR
Q4 2025 was the quarter where pressure peaked.
As the year closed, global ad spend climbed again, but performance did not rise with it. Instead, advertisers found themselves paying more to hold ground, especially on iOS, where demand surged into a limited pool of high-value inventory. CPIs spiked sharply, efficiency softened, and the gap between scale and value widened further.
Android continued to deliver reach and volume, but revenue growth remained firmly anchored in Apple’s ecosystem. Across most verticals, iOS drove a disproportionate share of monetization, even as installs skewed heavily toward Android. The result was a familiar but intensifying tradeoff: scale on Android, value on iOS.
Growth in Q4 was also highly selective. Rather than expanding broadly, marketers doubled down on markets and verticals where performance was predictable and monetization was proven. Gaming rebounded strongly, On-Demand continued to dominate non-gaming installs, and Health & Fitness posted meaningful gains. Meanwhile, Utilities, Education, and E-commerce saw budget pullbacks as advertisers reallocated toward higher-confidence opportunities.
The big story is focus. Q4 was not about experimentation or cheap growth. It was about defending efficiency under peak pressure, prioritizing markets that convert, and paying premiums where lifetime value can justify the cost.
Highlights and key takeaways
- Global ad spend increased modestly QoQ, but growth was concentrated rather than broad-based
- Android CPI surged +16% QoQ, the sharpest increase in over a year
- iOS remained cost-stable, absorbing scale without matching inflation
- Gaming and On-Demand drove the majority of incremental spend
- Tier 1 East and the United States captured most budget growth
- ATT opt-in rates softened slightly, reinforcing the need for post-IDFA measurement strategies
- iOS continued to drive 70–90% of revenue across many verticals despite a minority of installs
Bottom line
Mobile marketers are paying more for fewer, higher-value users. Android delivers reach, but revenue growth is increasingly concentrated on iOS, where competition is fiercest and precision matters most.
As always, data in this report is based on a significant slice of Singular’s data:
Global ad spend trends
Global ad spend edged upward in Q4, but the topline number masks a more nuanced shift underneath. While spend increased, impression supply tightened slightly, signaling constraint rather than broad expansion.

- 13% Increase in Android Ad Spend from 2025 Q3 to 2025 Q4
- −3.25% Decrease in iOS Ad Spend from 2025 Q3 to 2025 Q4
Platform dynamics diverged late in the quarter. Android softened modestly, while iOS grew slightly and gained share as advertisers prioritized monetization over pure volume during peak competition.
The takeaway is subtle but important. Q4 growth was driven by competition, not supply expansion, setting the stage for the CPI inflation and efficiency pressure that followed.
When we look at global ad impressions by OS, we see:
- Android Change: −0.75% (decrease)
- iOS (unified) Change: +0.28% (increase)
Bottom line: Total impressions dipped slightly QoQ, driven by a modest Android decline, while iOS grew slightly and picked up share.
Ad spend by vertical
Overall ad spend grew roughly 4% QoQ, but gains were highly concentrated.

Gaming and On-Demand accounted for the majority of incremental spend, reaffirming their roles as the two most reliable growth engines under pressure. Health & Fitness also posted strong relative growth, albeit from a smaller base.
At the same time, several verticals pulled back meaningfully. Utilities, Education, E-commerce, and Other all saw pullbacks, signaling budget reallocation rather than market weakness. In a peak quarter, advertisers chose to fund verticals with proven monetization and predictable returns, even if that meant stepping back from cheaper but less certain opportunities.
Ad spend by region
Spend accelerated in Q4, but the gains were highly concentrated in mature, performance-driven markets. Tier 1 East led by a wide margin with a 25% quarter-over-quarter increase, followed by the US at 17%. These markets absorbed the bulk of incremental budget as advertisers leaned into regions with strong monetization and predictable returns during the year-end push.

Growth elsewhere was positive but more restrained. Tier 2 markets, Japan, and China all saw single to low double-digit increases, signaling steady expansion rather than aggressive scaling. Meanwhile, Tier 1 West and rest of the world posted only modest gains, suggesting budget discipline or reallocation toward higher-confidence regions.
Q4 growth was not about expanding everywhere. It was about doubling down where returns are clearest, making optimization speed, measurement accuracy, and marginal gains decisive under peak pressure.
ATT and IDFA availability
ATT opt-in rates declined slightly from Q3 to Q4, dropping from 9% to 8%. While the change is directional, it is not dramatic.

The more important signal is stability. The overwhelming majority of users remain opted out, and Q4 showed no structural shift in consent behavior. For marketers, this reinforces a reality that has now fully settled in: performance success depends far more on modeling, aggregation, and signal recovery than on hoping for opt-in growth.
ATT acceptance by vertical
Q4 opt-in gains were incremental and concentrated in verticals where opt-in already performs well. Categories with strong user value exchange and mature onboarding flows continued to inch upward, while low-performing verticals remained constrained.

This pattern suggests that ATT improvements are driven by vertical-specific UX and value clarity, not broad changes in user sentiment. There is no universal fix. Winning opt-in remains a product and experience problem, not a market trend.
Global metrics: big picture
From Q3 to Q4, costs increased while efficiency softened. CPI rose 8.4% to $1.12, and CPM increased 4.6% to $2.88, reflecting heavier competition for inventory as budgets ramped in Q4.
At the same time, performance metrics moved slightly down. CTR fell 1.3% to 4.50%, and IPM declined 3.5% to 2.56, signaling weaker engagement and fewer installs per thousand impressions.
The takeaway is straightforward. Q4 pressure came from demand, not improved performance. Advertisers paid more to maintain scale, making creative quality, optimization speed, and measurement precision critical to protecting efficiency.

CPI deep dive: geos, verticals, genres
CPI by OS
CPI increased QoQ on both platforms. Android saw a larger relative increase from a lower base, while iOS remained significantly more expensive in absolute terms, continuing to absorb the majority of cost pressure.

From Q3 to Q4, CPI increased on both platforms, but the magnitude was very different. iOS saw a modest jump, rising from $3.44 to $3.83, a roughly 11% QoQ increase, reflecting intense competition and higher auction pressure on iOS inventory late in the year. This reinforces how quickly costs escalate in constrained, high-value environments when demand spikes.
Android CPI rose more significantly, increasing from $0.57 to $0.66, or about 16% QoQ. While directionally consistent with iOS, the scale of change is far smaller, highlighting Android’s relative cost stability and broader inventory availability.
The takeaway is clear. Q4 cost inflation was overwhelmingly an Android story. Advertisers paid a steep premium to maintain scale on Android, while iOS remained comparatively efficient. This gap underscores why platform-specific budgeting and ROI expectations matter most during peak demand periods.
CPI by region

In Q4 2025, CPI rose across most regions, but the increase was concentrated in high-value markets. The US remained the most expensive and climbed further, while Japan saw the sharpest jump, signaling intensified competition and tighter supply late in the year.
Elsewhere, increases were more modest. China and Tier 2 West moved up, while Tier 1 West, Tier 1 East, Tier 2 East, and rest of the world remained relatively stable and low-cost.
The takeaway is focus. Q4 cost inflation was driven by priority markets, not broad-based pressure, reinforcing the need for region-specific bidding, budgets, and ROI expectations in peak quarters.
CPI by vertical
Retail, Financial, and Travel remain the most expensive categories, driven by intense competition and high downstream value. Utilities and Other sit at the opposite end of the spectrum, combining low CPIs with strong engagement and conversion rates.

CPI by vertical and OS
When split by platform, the gap widens further. iOS CPIs are materially higher across every vertical, often by multiples rather than percentages. Android offers efficiency and scale, but advertisers continue to pay a premium on iOS where user value can justify the cost.

CPI by game genre
From Q3 to Q4, CPI pressure concentrated at the top rather than rising evenly across genres. The overall ranking stayed largely the same, but Q4 stretched the high end of the cost curve.
On Android, increases were selective. Casino, Role-Playing, Simulation, Action, and Party became more expensive, while most other genres moved only slightly and remained low cost. Android continues to offer stability outside of a few premium genres.

On iOS, the shift was sharper. Casino and Role-Playing pulled further ahead, with clear inflation also showing up in Sports, Party, and Strategy. Even mid-tier genres edged up, widening the gap between top and bottom.

The takeaway: Q4 amplified polarization. Advertisers paid more to compete in high-value genres, especially on iOS, while low-intent genres stayed relatively insulated.
Key metrics by country tier and vertical
At Singular, we look at data by regions:

Here’s the data:
Key regional insights
Let’s look at the highlights in each market segment …
United States
- Expensive traffic with high monetization potential
- Significant variance by vertical
- Strong competition continues to drive CPI inflation
- Smart optimization pays off, especially in Travel, Utilities, and Gaming
China
- Huge scale but a highly fragmented ecosystem
- Extreme efficiency variance by vertical
- Very low CPIs in select categories, but inconsistent conversion quality
- Tracking and platform constraints distort benchmarks
- Best approached selectively, especially for Gaming, Entertainment, and Utilities
Japan
- High-intent, high-value, high-cost market
- Behaves more like the United States than the rest of APAC
- Lower CTR but strong CVR and downstream value
- CPI inflation is most pronounced in Finance, Travel, and Gaming
- Creative localization is essential for success
Tier 1 West
- Much cheaper than the United States
- Strong CVR and IPM across most verticals
- Utilities and Gaming show outsized efficiency gains
- Lower CTR, but installs convert well
- Excellent balance of cost and quality for scaled growth
Tier 1 East
- Premium audience quality with better cost efficiency
- Sweet spot for scaling without United States-level CPIs
- Gaming and Travel perform exceptionally well
- High engagement with solid conversion rates
- Ideal for performance-led global campaigns
Tier 2 West
- Cost-efficient region for scalable growth
- Low CPIs paired with healthy CTR and CVR
- Monetization per user may lag premium markets
- Strong IPM in Utilities and Gaming
- Well suited for testing, expansion, and volume growth
Tier 2 East
- Massive install volume at bargain CPIs
- Excellent for top-funnel growth and rapid experimentation
- High CTRs with more variable conversion rates
- Requires localized creative and cultural relevance
- Best suited for Utilities and Casual Gaming
Rest of world
- Very cheap reach with mixed user quality
- Strong CTRs but inconsistent CVR and monetization
- Effective for awareness and early-stage seeding
- Requires tight optimization and filtering to protect ROAS
- Best suited for low-cost content and utility-driven apps
Or, if you prefer a simple chart

Key vertical insights
Here are some of the insights we can draw from a vertical perspective …
Education
- Moderate CPI with consistently strong CVR across regions
- Most efficient in Tier 1 East and Tier 2 West, where CVR approaches 20%
- Most expensive in the United States, driven by high CPMs
- Intent-driven installs lead to strong IPM in emerging and Tier 1 East markets
- Performs best in high-engagement, lower-CPI regions with clear user intent
Entertainment
- Moderate CPI with solid CTR and CVR globally
- Strong IPM in Tier 1 West, Tier 2 East, and Rest of World, indicating cost-efficient installs
- Most expensive in the United States and Japan, reflecting premium streaming and media competition
- Balanced vertical with broad appeal and scalable performance
- Works well globally, especially outside the United States
Financial
- One of the highest CPI verticals globally, exceeding $10 in the United States and Japan
- Low CTR and IPM due to friction, regulation, and compliance barriers
- Most profitable in the United States, where high LTV can justify cost
- Rarely cheap in any market, even in Tier 2 regions
- Highly competitive vertical where returns depend on long-term value, not efficiency
Gaming
- Mid-range CPI overall, but extreme variance by market
- Strong IPM in Tier 1 East, Tier 2 East, and Rest of World, driven by low CPI and solid engagement
- CPI spikes sharply in Japan and the United States, especially on iOS
- Most cost-efficient at scale in Tier 2 East and Tier 1 East
- High-volume category with strong global ROI when market selection is disciplined
Health & Fitness
- Moderate CPI in premium markets, typically higher in the United States and Japan
- Strong CVR in Tier 1 West, reflecting intent-driven behavior
- Mid-range IPM overall, with weaker efficiency in Tier 1 East and China
- Most profitable in Tier 1 West, where cost and engagement balance best
- High-quality users, but ROI depends on avoiding premium-market CPI inflation
On-Demand
- Consistently high CPI in premium markets, especially the United States and Japan
- Moderate CTR and CVR, resulting in limited IPM upside
- Most efficient in Tier 1 West and Tier 2 East, where CPIs drop meaningfully
- Competitive vertical with tight unit economics
- Success depends on LTV discipline more than raw acquisition efficiency
E-commerce & Shopping (Retail)
- Among the most expensive verticals, with extreme CPI in the United States and Japan
- Low CTR in premium markets, paired with high CPMs
- More efficient in Tier 1 East and Tier 2 West, where CVR is materially higher
- Holiday and seasonal competition heavily inflate United States costs
- Requires precise bidding, real-time optimization, and market selectivity
Travel
- Highly variable CPI by region, very high in the United States and far more efficient elsewhere
- Strong CTR and CVR globally, driven by visual and intent-rich creatives
- High IPM in Tier 1 East and Rest of World, indicating efficient installs
- Most profitable in Tier 1 West and Tier 1 East, balancing premium users with manageable CPI
- Strong vertical when seasonality and timing are well managed
Utilities
- Lowest CPI across nearly every region, especially Tier 1 East, Tier 2 East, and Tier 2 West
- Consistently highest IPM globally, often exceeding 6 to 10 installs per thousand impressions
- Strong CTR and CVR reflect low-friction, universal use cases
- Most profitable in Tier 1 West and Tier 2 East, combining scale and efficiency
- Performance powerhouse vertical that is cheap, efficient, and easy to scale
Monetization trends
Android drives scale and iOS drives value, but the split is not universal.
In most verticals, Android delivers the majority of installs while iOS captures a disproportionate share of revenue. This is most pronounced in Gaming, Financial, and Health & Fitness, where iOS generates 70–87% of revenue despite a much smaller install base.
There are clear exceptions. Utilities is overwhelmingly Android-led on both installs and revenue, while Entertainment flips the model, with iOS leading installs but Android generating nearly 80% of revenue.
The takeaway is simple. Platform strategy must be vertical-specific by design. iOS remains the monetization engine in most categories, but Android can outperform when scale and monetization mechanics align.

Key insights by vertical:
- E-commerce & Shopping
Android drives 85% of installs, but iOS captures 45% of revenue, showing materially stronger monetization per user on iOS despite lower scale. - Education
Installs are relatively balanced (53% Android, 47% iOS), with iOS slightly outperforming on revenue share, indicating higher paid adoption on iOS. - Entertainment
iOS leads installs (58%), but Android dominates revenue (79%), an unusual reversal driven by stronger monetization on Android in this category. - Financial
Android accounts for 85% of installs, yet iOS generates nearly 70% of revenue, reinforcing that iOS users are significantly more valuable. - Gaming
Android delivers 90% of installs, while iOS contributes 87% of revenue, one of the clearest examples of extreme monetization skew toward iOS. - Health & Fitness
Android leads installs (66%), but iOS drives nearly 80% of revenue, highlighting a strong premium subscription bias on iOS. - On-Demand
Android supplies the majority of installs (87%), but revenue is more balanced, with iOS still punching above its weight at 43% of revenue. - Utilities
Android overwhelmingly dominates both installs (98%) and revenue (89%), reflecting platform constraints and distribution limits on iOS. - Travel
Android leads installs (66%), but iOS slightly outperforms on revenue, making this one of the more balanced verticals across platforms. - Other
Android drives nearly all installs (97%), yet iOS captures a disproportionately large share of revenue (43%), signaling higher monetization efficiency on iOS.
Ad network share of spend: biggest winners
All platforms combined
Looking at ad network share of spend reveals how marketers are diversifying acquisition strategies beyond the largest platforms.
Across all platforms combined, TikTok stands out as the fastest-growing channel by both spend and advertiser adoption. Its strength spans multiple verticals, signaling continued confidence in its ability to deliver both scale and performance.
Ad spend gained
Advertisers gained
1

2


3


4
5


6

7

8


9

10

11

12

13


14


15


Gainers by platform
On Android, growth is driven by a mix of platforms, including Google, Meta, TikTok, and a growing set of DSPs that excel in gaming and utility-driven use cases. This reflects Android’s openness and breadth of inventory, where specialization can outperform sheer scale.
Ad spend gained
Advertisers gained
1
2
3
4
5
6
7

8

9

10
On iOS, Apple Search Ads remains a cornerstone for high-intent acquisition, particularly in verticals like Education, Travel, Financial, and Health & Fitness. TikTok also continues to gain share, reinforcing its role as a cross-platform performance channel rather than a top-funnel-only play.
The broader takeaway is diversification. Marketers are increasingly building multi-partner strategies that balance scale, intent, and efficiency, rather than relying on any single network to do everything.
Ad spend gained
Advertisers gained
1
2
3
4
5
6
7
8
9
10

Ad network share of voice by vertical
Here’s another way to look at the data: top 5 ad networks by vertical in a table format.
Important note: Google and Meta are tops in almost everything, so I’m excluding them from this list. As you see each list of ad networks, just mentally add Meta and Google to each.


Key findings
- A diverse set of platforms play meaningful roles across verticals, highlighting how app marketers are increasingly building multi-partner acquisition strategies beyond the largest platforms.
- TikTok shows broad and consistent strength across verticals
- Particularly prominent in Utilities
- Appears as a leading platform in Financial, On-Demand, Education, and E-commerce
- Demonstrates versatility across both install volume and spend-driven use cases
- Particularly prominent in Utilities
- Apple Search Ads is a cornerstone for high-intent acquisition
- Ranks among the top platforms in Education, Travel, E-commerce, Health & Fitness, and Financial
- Continues to be a key driver for quality users and strong downstream value on iOS
- Ranks among the top platforms in Education, Travel, E-commerce, Health & Fitness, and Financial
- DSPs deliver standout performance in vertical-specific use cases
- Mintegral is especially strong in Gaming, with additional presence in Utilities and Other
- AppLovin shows leadership in Gaming and consistent presence across Entertainment, Education, and On-Demand
- Unity Ads is a core platform within Gaming, reflecting its deep specialization in the category
- Liftoff appears across Health & Fitness, Financial, and E-commerce, aligning well with performance-focused strategies
- Moloco maintains steady representation across Gaming, Utilities, Education, and Health & Fitness, reinforcing its cross-vertical applicability
- Mintegral is especially strong in Gaming, with additional presence in Utilities and Other
- Specialized platforms reinforce their category strengths
- Roku features prominently in Entertainment, aligning with connected TV and streaming use cases
- Taboola appears in Entertainment, reflecting its strength in content discovery and native placements
- Kakao shows relevance in E-commerce, highlighting its impact in Korea and APAC-driven acquisition
- Adjoe surfaces in Health & Fitness and Entertainment, reflecting engagement-driven user acquisition
- X continues to show presence in Financial and On-Demand, supporting performance and mid-funnel strategies
- Roku features prominently in Entertainment, aligning with connected TV and streaming use cases
Partner insights
Persona.ly
Retargeting: From the Sidelines to the Main Stage
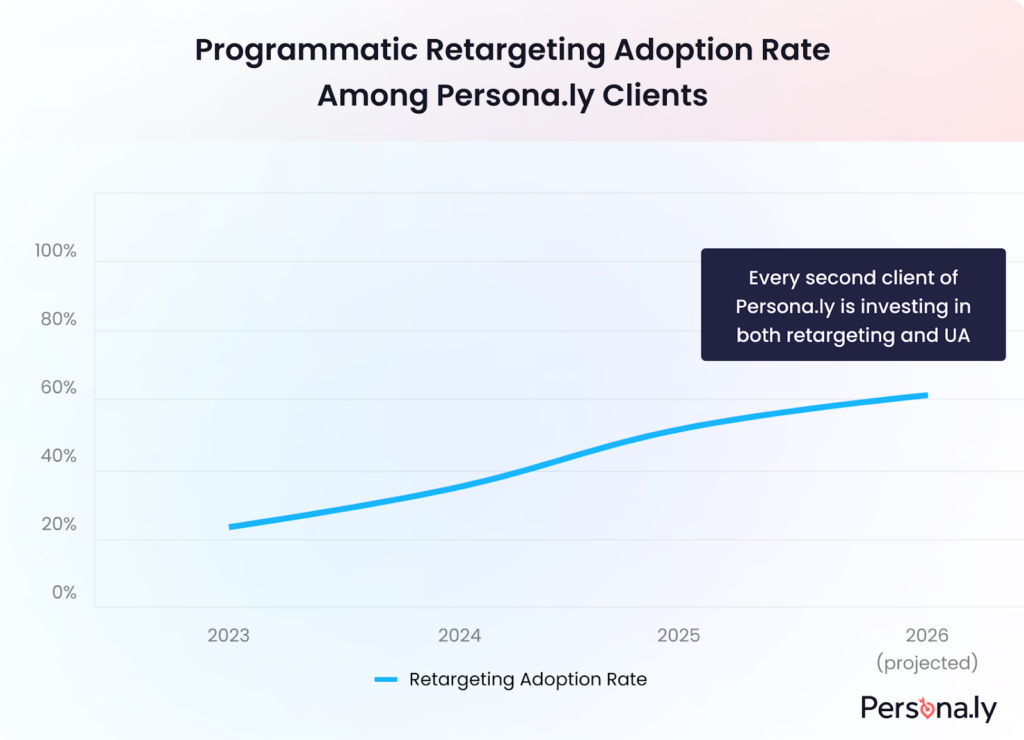
As the UA costs keep soaring and marketers are forced to pay significantly higher CPMs, retargeting is gaining momentum. Beyond rising UA costs – especially on iOS – there are several pragmatic reasons why retargeting has become a critical part of the modern marketing mix.
- Shorter user attention spans. Even the most thoughtfully designed apps struggle to hold user attention over time, making churn inevitable without ongoing engagement.
- Fierce competition for high-value users. Acquiring a user is no longer the finish line. Winning the install means very little if you’re not actively defending that user – churn today is often just someone else’s ad working better than yours.
As the UA costs keep rising with increasing CPMs (while the LTV stays the same), ROAS on UA channel keeps declining. For mobile marketers, hitting UA goals has become harder than ever. That’s where retargeting comes into play.
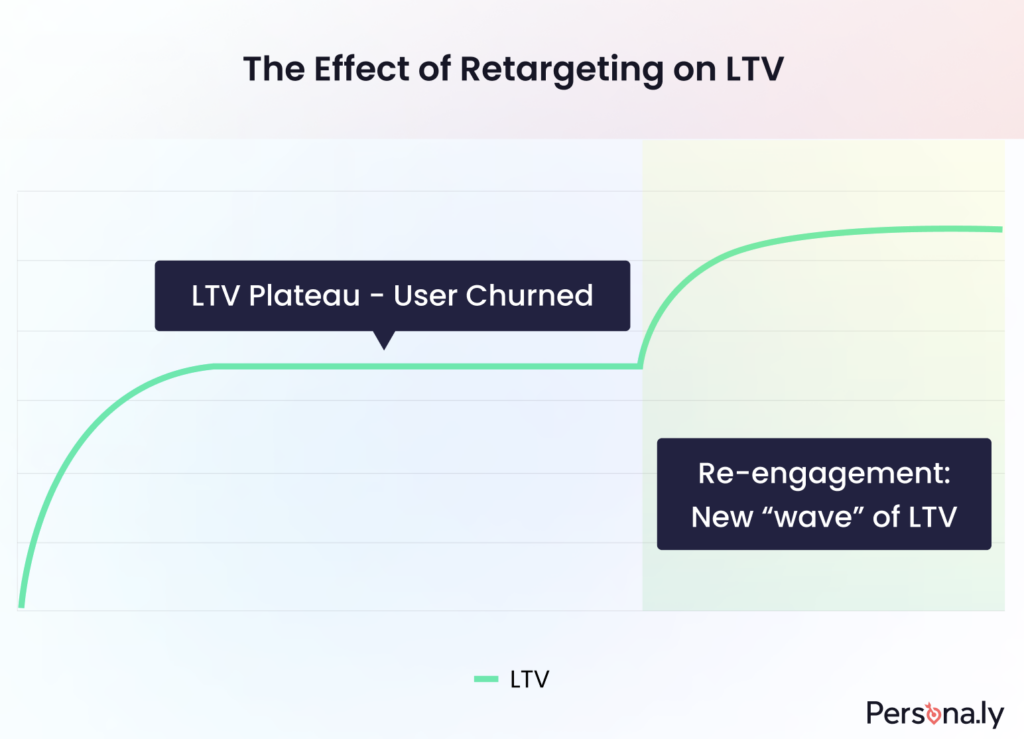
Retargeting serves as a re-engagement channel for lapsed users once the organic (CRM-related) channels have exhausted themselves and a user needs an extra push to return to using the app. While retargeting is still executed programmatically – meaning CPMs don’t magically get cheaper – bringing a user back is a worthwhile investment helping increase the LTV by a significant margin.
There are several reasons why retargeting consistently delivers high ROI:
- Highly constrained, high-intent audiences. Retargeting campaigns are delivered to a deliberately limited audience, even for apps with tens of millions of installs. This narrow focus on users naturally drives higher conversion rates compared to broad UA efforts.
- High-impact video creatives drive incremental lift. Full-screen interstitials, while more expensive, usually give the biggest lift.
Pro tip: If most of your retargeting budget is still flowing into banners, run an incrementality test. Those 320×50 units might be quietly cannibalizing your organic traffic by claiming view-through conversions that aren’t truly incremental.
- No onboarding, no education gap. These users already know your app. There’s no need to explain the value proposition or guide them through first-time experiences – you can drive them directly to the core app experience.
High ROI and increasing LTV make more and more top-grossing app publishers look into highly targeted programmatic re-engagement solutions.
Hitting the Sweet Retargeting Spot
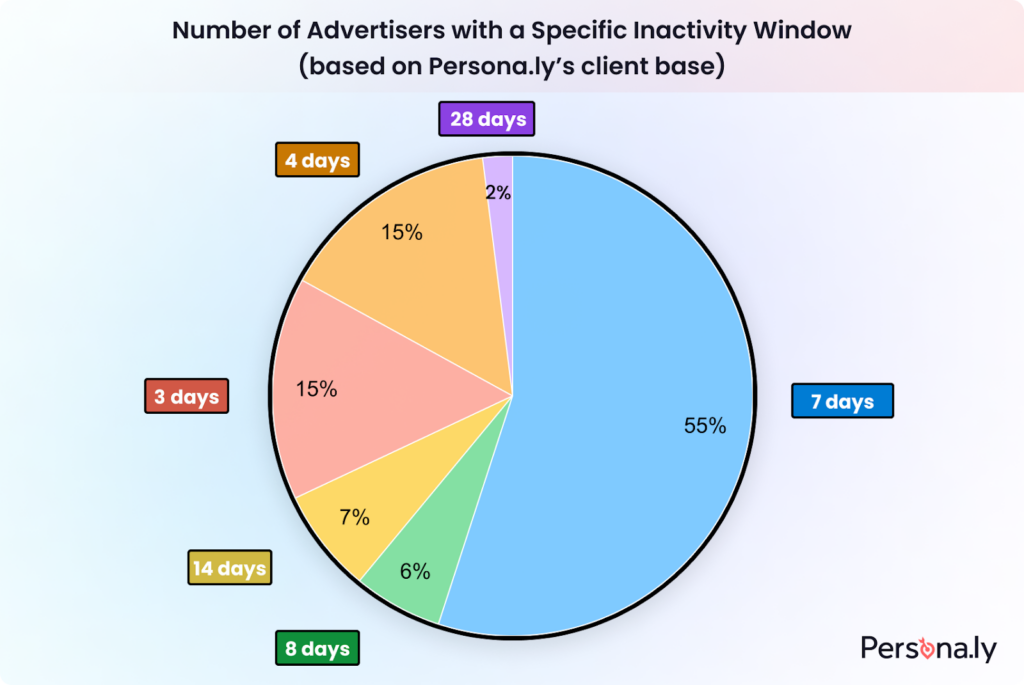
There’s no universal inactivity threshold for churn – 7 days since last in-app activity is just the default MMP setting. The ideal timing depends on the app’s LTV curve and user behavior.
Over the years, we’ve seen an increasing number of companies prioritize the insights from their data teams, who map the user lifecycle, spot main drop-offs, and test re-engagement windows.
Savvy publishers ensure that they hit the sweet spot in retargeting, as they know that retargeting too soon means cannibalizing their organic traffic by re-engaging audiences who would have returned organically or via CRM activations, and waiting too long means losing a user to a competitor.
What’s actually moving the needle right now:
- Data-led lifecycle mapping is standard. Teams no longer rely on assumptions for re-engagement windows; they conduct cohort-based survival analysis to precisely identify the “organic return cliff” – the distinct point at which the probability of organic re-engagement declines significantly.
- Incremental tests can’t be omitted. Without them, it is impossible to confidently distinguish true retargeting lift from users who would have returned organically or evaluate the performance of the programmatic partner.
- Competitive pressure is forcing earlier windows in some verticals. In hyper-competitive categories, teams are experimenting with day 4-5 windows because further delay often results in the permanent loss of the user to a competitor.
Retargeting+CTV: A Match Made in Heaven
CTV isn’t exactly the new kid on the block anymore, but it’s still overlooked by many advertisers. While the medium itself isn’t new, connected TV as a programmatic advertising channel is still relatively young, and that means many advertisers are only now starting to run serious trials and carve out dedicated budgets.
Like every emerging adtech channel before it, CTV can be vulnerable to fraud and inefficiencies if you jump in without understanding the fundamentals.
That said, the real reason CTV deserves attention is simple: it’s intent-light (not to be confused with low-intent) but extremely attention-heavy. Unlike mobile, where people are usually multitasking, distracted, or half-paying attention, CTV catches users when they’re relaxed, settled in, and actually focused on the big screen.
So what makes CTV especially powerful for retargeting?
High-impact creative formats, precise household-level targeting, and near-perfect timing. You’re reaching known users right in the middle of their real downtime, when they’re not commuting, not rushing between meetings, but actually locked in and receptive.
We’re already seeing a growing number of advertisers who either started investing in CTV in 2025 or are planning to ramp up in 2026. The ones doing it thoughtfully are quietly gaining a meaningful strategic advantage. Get it right, and this could easily turn out to be one of the smartest moves you make next year.
UA is Still in the Room
Retargeting is no longer optional – but it’s not a substitute for acquisition either. Retargeting can feel like swimming in a pool: efficient, predictable, and highly rewarding compared to the open water of UA.
That said, to keep growing at scale, publishers can’t stop investing in acquiring new users.
Splitmetrics
Apple Ads Conversion Rates Trends (Search Results Campaigns) 2025
1. Average CR Across Categories Fell Slightly
For search results campaigns in Apple Ads, the average CR across the top 15 categories decreased from 67.2% in 2024 to 66.2% in 2025.
This decline is driven by increased competition and market saturation in several high-traffic categories, which reduces the quality of traffic reaching apps. Users in crowded categories have more options, take longer to decide, and are less likely to convert after tapping an ad.
2. Sports and Travel Delivered the Highest CR
In terms of CR, Sports (73.0%) and Travel (72.6%) led all app categories in 2025.
Sports apps benefit from clear user intent. Searches are specific and decision paths are short, making ad taps more likely to convert. Travel also improved significantly, showing that users who tap on ads are acting with purpose, often planning immediate trips.
High conversion in these categories signals strong product-market fit. For marketers, this highlights the value of aligning campaigns with clear, high-intent keywords and well-optimized product pages.
3. Social Networking and Entertainment Saw the Biggest Drops
Social Networking and Entertainment categories saw the biggest CR declines in 2025. Social Networking dropped from 71.8% to 59.0%, Entertainment from 74.8% to 64.2%.
Social apps face market saturation and user selectivity, while Entertainment apps compete in fragmented discovery channels. Larger platforms aggressively defending market share also reduce traffic quality for smaller apps.
For UA managers, the takeaway is simple: focus on high-quality traffic, precise keywords, and differentiation through creatives and custom product pages to maintain efficiency.
Vibe
2026 CTV performance playbook
1. Performance CTV has crossed the attribution threshold
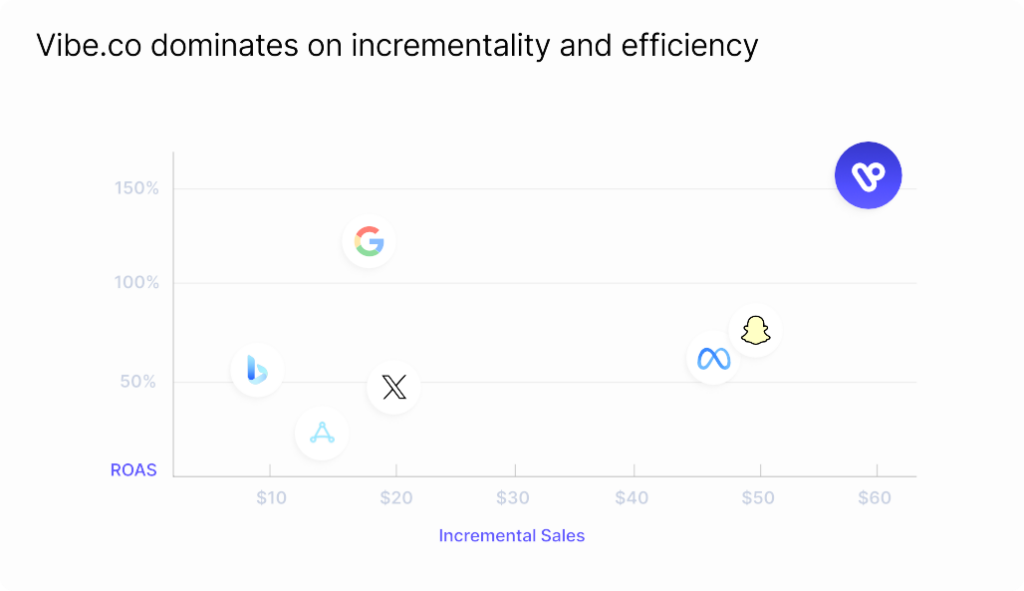
CTV is no longer an upper-funnel black box. When powered by verified supply and first-party identity data, CTV now delivers measurable, incremental performance comparable to (and in some cases more efficient than) paid social. Brands using verified CTV environments are seeing 55% lower CAC than paid social, stable week-over-week performance, and an average $1.52 in incremental revenue for every $1 spent, validated through incrementality testing.
2. Incrementality, not modeled attribution, is the KPI that matters
As signal loss accelerates across mobile and web, traditional last-click and platform-reported metrics increasingly overstate impact. The most effective CTV programs now rely on controlled lift tests and third-party MMP validation to measure true contribution. In controlled experiments, CTV accounted for 6–9% of total Shopify orders, with 81% of incremental conversions coming from net-new customers. This is a strong indicator that CTV is driving genuine growth rather than cannibalizing existing channels.
3. Creative + verified audiences unlock ROAS at scale
CTV performance isn’t driven by reach alone. It’s driven by precision and creative execution. Campaigns combining CRM-based retargeting or high-intent lookalike audiences with performance-optimized creatives consistently achieved 300–400%+ ROAS across ecommerce verticals. The takeaway for marketers is clear: treat CTV like a performance channel, not a branding expense, and optimize creative with the same rigor as paid social.
Footnotes
Countries and tiers
We look at global data through a number of filters. One is country tiers, which because of our customer base we define as:
- China
- Japan
- Rest of world
- Tier 1 East: Korea, India
- Tier 2 East: Taiwan, Indonesia, Turkey, Thailand, Philippines
- Tier 1 West: Canada, France, Germany, UK
- Tier 2 West: Australia, Mexico, Brazil, Spain, Italy, Netherlands, Poland
- United States
About this data
All of this data is based on Singular’s view of the adtech ecosystem. While we have a significant share of the Mobile Marketing Platform space and see a huge amount of data, our insights will be biased towards actively marketing and growing apps that are spending significantly on user acquisition.